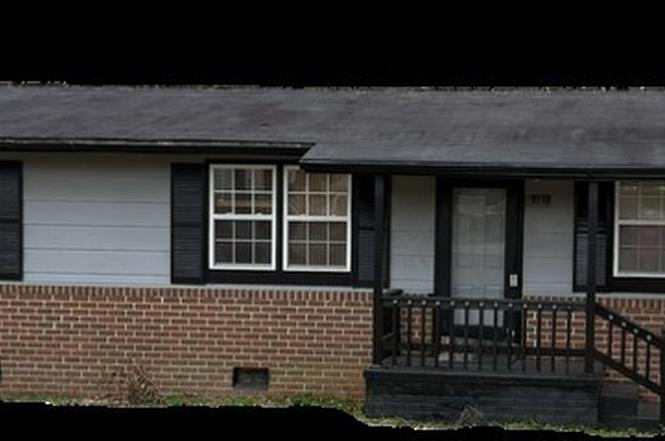
9118 Sussex Dr · Stony Creek, VA
Flood risk No data
- FEMA flood zone
- —
- Chance of flooding over 30 yrs
- —
- Est. flood insurance / yr
- —
Fire risk No data
- Est. fire insurance / yr
- —
Heat risk No data
- Hot days now (above threshold)
- —
- Hot days in 30 yrs
- —
Wind risk No data
- Chance of severe wind over 30 yrs
- —
Air-quality risk No data
- Unhealthy air days now
- —
- Unhealthy air days in 30 yrs
- —
Risk factors via First Street. Map © Google.
Why this score? — see what drove the B+ grade
The composite is a weighted blend of 9 inputs, each scored 0–100. Each bar is that input's sub-score; the figure is the points it added to the 100-point composite (weight × sub-score).
- Cash flow +30.0/30.0
- DSCR +10.0/10.0
- 1% rule +8.3/10.0
- Appreciation +7.9/10.0
- ARV discount +7.5/15.0
- Schools +3.8/10.0
- Livability +3.5/5.0
- Rent growth +2.5/5.0
- Condition / age +2.5/5.0
$105,000
🖨 Deal sheet (PDF) 📄 Offer letter ✓ Due diligence
Listing remarks
Investor special - this home in Stoney Creek, Va. is ready for your magic to make it a home for a family to enjoy the spacious yard. Home needs major interior work, doe shave a heat pump - there are window units in the windows but the owner never liked the heat pump/central air, so continued to use the window units in the summer. Nice little area with very similar homes near and within minutes of interstate 95. Dont delay and bring your MAGIC to this home.
Key facts
- Spacious yard
- Window units
- Heat pump
Tags
Neighborhood map
What this means for you Summary
Snapshot
- This is a 3-bed/1.0-bath single-family listed at $105k.
Deal economics
- At list price, monthly cash flow is $482 ($6k/yr) — positive.
- The deal already cash-flows at list — no discount required.
- Meets the 1% rule at list price ($1k rent vs $105k).
- Recommended offer: $102k (3.0% below list) — sets the bar for market timing.
Location & tenants
- Location reads 69/100 on livability (#255 in VA) — a middle-class / working-renter tenant base. Strengths: cost of living A+, health & safety A+, schools B+; Watch: employment D+, amenities F, commute F.
- Sussex County Public School District (rural): math 36% / reading 56% proficiency, ranked #111 of 131 in VA (top 85%) — families likely to look elsewhere, expect single-tenant / working-renter base with shorter leases; 74% free/reduced lunch — lower-income household profile, screen leases tightly.
- Market conditions: 16 active listings in the ZIP; 29 units permitted in Sussex County in 2024 (0 in 5+ unit buildings).
Forward outlook
- In year one you build about $7k of equity ($726 loan paydown + $6k appreciation (5.9% local appreciation)).
- Sussex County population projected at -11% by 2050 — secular population decline; favor cash flow + early exit over multi-decade hold.
- At projected returns (5.9% appreciation + 3.0% rent growth), your $29k cash investment doubles in ~3 years — after that, you're playing with house money.
- By year 5, paydown + projected appreciation supports a ~$30k cash-out refi (75% LTV) — recoverable capital for the next deal without selling this one.
Negotiation context
- It's been on market 54 days — a 3% lower offer ($102k) is reasonable based on typical stale-listing flexibility.
Questions for the listing agent
- It's been on market 54 days. Have you received any prior offers? Is the seller open to a 3% concession, seller financing, or rate buy-down credit?
- Built in 1972 — when were the roof, HVAC, electrical panel, plumbing, and water heater last replaced?
- Is there a deadline driving the sale (1031 exchange, divorce, estate, relocation)? That informs how much negotiation room exists.
- Schools are B-rated — typically a magnet for longer-tenancy family renters. What's the average tenant stay here, and is there a school-zone premium baked into asking?
- What's the average days-on-market for RENTAL listings here right now (not sales)? A rising rental-DOM trend means longer vacancies and softer asking-rent achievability than the comps imply.
- What's the recent tenant-quality profile in this submarket — average credit score on applications, eviction rate, late-payment / NSF rate, and stable-employment percentage? A property-management company in the area should have these aggregated.
- How much new for-sale + rental construction is in the pipeline within 1–3 miles? Heavy new supply typically softens prices + rents 12–24 months out; constrained supply supports both.
Investment metrics
- 1% rule
- 1.33% ✓
- Cap rate
- 11.80%
- Cash-on-cash
- 19.68%
- DSCR
- 1.88
- GRM
- 6.3
CMA / ARV
No comps found within radius.
Projected returns pro-forma
5.87% appreciation · 3.0% rent growth · sell at horizon
- IRR
- 31.6%
- Equity multiple
- 3.05×
- Total profit
- $60,141
- Equity at exit
- $65,120
- IRR
- 29.5%
- Equity multiple
- 6.20×
- Total profit
- $152,998
- Equity at exit
- $117,333
Cash invested: $29,400 (down + closing). Projections, not guarantees.
Landlord ↔ Tenant lean methodology
- Overall (STATE)
- 55 Moderately Landlord-Leaning
- State Virginia
- 55 Moderately Landlord-Leaning · D+2
- County
- — inherits STATE
- City
- — inherits STATE
ZIP-level market 23882
- Home prices YoY
- 3.8%
- Active inventory
- 16
- Price-to-rent
- 6.3×
Monthly cashflow live
- Estimated rent
- $1,395 medium interval (Pro) →
- Mortgage (P&I)
- −$551
- Tax from tax record
- −$26 /mo · $307/yr
- Insurance
- −$44
- HOA
- −$0
- Vacancy / Maint / Mgmt
- −$293
- Net cashflow
- $482
Break-even live
Sensitivity live
| Price | -10% $542 | -5% $512 | +0% $482 | +5% $452 | +10% $423 |
|---|---|---|---|---|---|
| Rent | -10% $372 | -5% $427 | +0% $482 | +5% $537 | +10% $592 |
| Rate | -1.0pp $535 | -0.5pp $509 | base $482 | +0.5pp $455 | +1.0pp $427 |
UW: 25.0% down · 7.5% · 30yr · 1.5% tax · 5.0% vac · 8.0% maint · 8.0% mgmt
Financing live
Cash to close
- Down payment
- $26,250
- Closing costs
- $3,150
- Reserves months
- —
- Total cash needed
- —
Loan-product check · same deal, 3 products live
Conventional
25% down · 7.5% · 30yr
- Down + closing
- —
- Monthly P&I
- —
- Monthly cashflow
- —
- DSCR
- —
- Eligible?
- —
Personal DTI + credit; lowest rate.
DSCR
20% down · 8.5% · 30yr
- Down + closing
- —
- Monthly P&I
- —
- Monthly cashflow
- —
- DSCR
- —
- Eligible?
- —
No personal income docs; deal must DSCR.
Hard money
10% down · 12.0% · 12mo
- Down + closing
- —
- Monthly P&I
- —
- Monthly cashflow
- —
- DSCR
- —
- Eligible?
- —
Short-term bridge; refi at stabilization.
Listing history 2 events
-
2026-04-14status Pending
-
2026-02-19$105,000 Active
ⓘ Source: listings_history table (triggers on properties + properties_extension) + one-shot
backfill from property_details.listing_events for pre-trigger history.
Tax reassessment forecast VA · Resets to sale price
- Current annual tax
- $307 · $26/mo
- Projected year-2 tax
- $861 · $72/mo
- Expected delta
- +$554/yr (+$46/mo · 180.1%)
ⓘ Screening estimate from a state-policy table — verify with the county assessor before closing.
Nearby sold comps map
Loading sold comps map…
Walkable amenities ~0.75 mi
Loading nearby amenities…
Taxation est. · year 1
- Rental income
- $16,740
- − Mortgage interest
- −$5,882
- − Property taxes
- −$307
- − Insurance
- −$525
- − Repairs & maintenance
- −$1,339
- − Management
- −$1,339
- − Depreciation
- −$3,055
- Taxable income
- $4,293
- Est. tax owed @ 24.0%
- −$1,030
- After-tax cash flow
- $4,754/yr
For passive investors: Depreciation is non-cash, so a rental often shows a tax loss while cash-flowing — sheltering income. Rental losses are passive: they offset passive income freely, and up to $25,000/yr can offset ordinary (W-2) income if you actively participate and your MAGI is under $100k (phasing out to $0 by $150k); unused losses carry forward. On sale, claimed depreciation is recaptured at up to 25%, and gains may owe capital-gains tax (a 1031 exchange can defer both). Figures are a year-1 estimate at your 24.0% rate — not tax advice; consult a CPA.
Schools (NCES district)
- District
- Sussex County Public School District
- NCES district ID
- 5103780
- Math proficiency
- 36% ▼ -46.00%
- Reading proficiency
- 56% ▼ -22.00%
- Median HH income
- $40,095
- Composite
- 38.44/100
- National rank
- #4198
- State rank
- #111 of 131 in VA
Livability — Stony Creek
- Score
- 69/100
- State rank
- #255
- US rank
- #8654
Category grades
Schools grade is shown separately in the Schools card above.
Census & demographics
- Population (ZIP)
- 1,967
Population outlook (Sussex County) Hauer SSP2
- Today (2025)
- 11,207 people
- By 2030
- 10,897 · -2.8%
- By 2040
- 10,451 · -6.7%
- By 2050
- 9,936 · -11.3%
- By 2075
- 8,643 · -22.9%
- By 2100
- 6,908 · -38.4%
Race, ethnicity, and origin ACS 2023
- Neighborhood character
- Majority White (57%)
- Race & ethnicity
- White 57% Black 39% Two or more races 3%
- Common ancestry
- Romanian 2% Lithuanian 1% Slovene 1%
- Foreign-born
- 1% · Canada
- Languages at home
- 99% English-only · Spanish 1%
Political lean MEDSL · Sussex
- 2024 margin
- Toss-up / Even · D 51.9% · R 47.5%
- 2008→2024 swing
- -19.3pp toward R · 2008: 23.8pp · 2024: 4.4pp
- All cycles
- 2024: D+4.4 2020: D+11.9 2016: D+16.3 2012: D+24.5 2008: D+23.8
Not yet ingested
- Civics
- —
Market trends
- HPI YoY
- ▲ 5.87%
- Current HPI
- 160.116
- Rent YoY
- —
- Metro
- —
- State GDP YoY
- ▲ 2.40%
- F500 in state
- 50
Industry mix (Fortune 500 HQ in VA)
| Industry | F500 HQs | Revenue |
|---|---|---|
| Aerospace / Defense | 4 | $236B |
|
||
| Technology / Defense | 3 | $32B |
|
||
| Financial Services | 2 | $176B |
|
||
| Utilities | 2 | $27B |
|
||
| Insurance | 2 | $25B |
|
||
| Technology | 2 | $15B |
|
||
Price history
2 events — show timeline
- 2026-04-14 Pending — CVRMLS
- 2026-02-19 Listed $105,000 CVRMLS
Property tax history
+1.9%/yrLatest (2025): $307 · +0.0% YoY. Source: county tax records.
Cash-flow waterfall
monthlySold comps — $/sqft
last 12 mo · ≤1 miLoading sold comps…