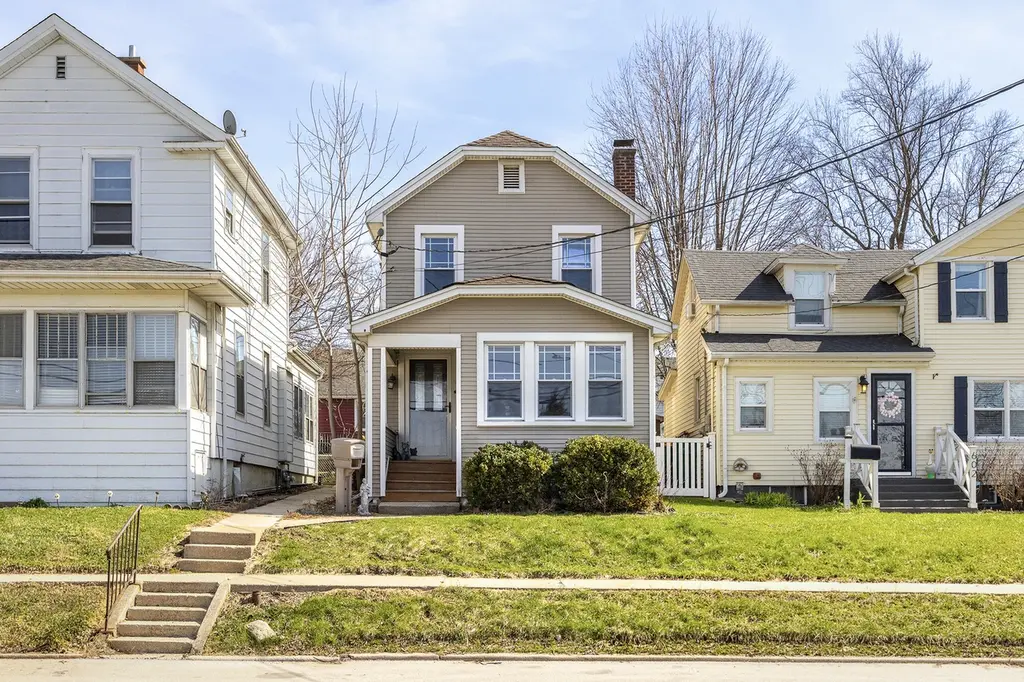
604 Illinois St · Lemont, IL
Flood risk 1/10 · Minimal
- FEMA flood zone
- X (unshaded)
- Chance of flooding over 30 yrs
- 0.0%
- Est. flood insurance / yr
- $473 – $860
Fire risk 1/10 · Minimal
- Est. fire insurance / yr
- $804 – $1,492
Heat risk 3/10 · Minor
- Hot days now (above 103°F)
- 7 days/yr
- Hot days in 30 yrs
- 15 days/yr
Wind risk 2/10 · Minimal
- Chance of severe wind over 30 yrs
- —
Air-quality risk 4/10 · Minor
- Unhealthy air days now
- 4 days/yr
- Unhealthy air days in 30 yrs
- 5 days/yr
Risk factors via First Street. Map © Google.
Why this score? — see what drove the C- grade
The composite is a weighted blend of 9 inputs, each scored 0–100. Each bar is that input's sub-score; the figure is the points it added to the 100-point composite (weight × sub-score).
- Cash flow +15.8/30.0
- ARV discount +15.0/15.0
- DSCR +4.9/10.0
- Schools +4.4/10.0
- 1% rule +4.1/10.0
- Livability +3.5/5.0
- Rent growth +2.5/5.0
- Condition / age +2.5/5.0
- Appreciation +0.0/10.0
$280,999
🖨 Deal sheet (PDF) 📄 Offer letter ✓ Due diligence
Listing remarks
Cozy home located just a short walk from all the fun downtown Lemont has to offer. Featuring 2 bedrooms, 1 bathroom, a spacious kitchen, and a generous backyard ideal for entertaining, this home is ready for your personal touches to make it the perfect place.
Key facts
- Spacious kitchen
- Generous backyard
- Built 1887
Tags
Property features AI
Finance
- Other: Possession at closing or immediate; Earnest money is held
- HOA & community: No master association fee required
Exterior
- Utilities: Public water; Public sewer
- Home design: Detached single-family home; Two-story; Fee simple ownership; Estimated living area; Property is over 100 years old; Built before 1978
- Construction: Vinyl siding exterior
- Exterior features: Lot between 0.25 and 0.49 acre; Lot dimensions recorded
Interior
- Kitchen: Main-level kitchen (15 x 12)
- Bedrooms: Master bedroom on second level (15 x 10); Second bedroom on second level (12 x 9); Additional bedrooms noted
- Bathrooms: 1 full bathroom; 1 half bathroom
- Heating & cooling: Forced air heating; Central air conditioning
- Interior features: Five total rooms; Unfinished partial basement
- Laundry & utility: Main-level laundry room (14 x 5)
Neighborhood map
What this means for you Summary
Snapshot
- This is a 3-bed/1.5-bath single-family listed at $281k.
Deal economics
- At list price, monthly cash flow is $131 ($2k/yr) — positive.
- The deal already cash-flows at list — no discount required.
- To meet the 1% rule (rent ≥ 1% of price), the offer needs to be $257k (8.7% below list).
- Recommended offer: $257k (8.7% below list) — sets the bar for 1% rule.
- Cap rate 6.9% vs local median 1.9% in Lemont — top-decile yield for the area; either an underpriced asset or a hidden risk that comps aren't pricing in. Stress-test before assuming the spread holds.
Location & tenants
- Location reads 69/100 on livability (#389 in IL) — a middle-class / working-renter tenant base. Strengths: crime A+, employment A+, housing A+; Watch: amenities F, commute F, cost of living F.
- Lemont Twp Hsd 210 (suburban): math 46% / reading 47% proficiency, ranked #57 of 620 in IL (top 9%) — families likely to look elsewhere, expect single-tenant / working-renter base with shorter leases.
- Zoned schools: Oakwood School (624 students, 0% FRL); Old Quarry Middle Sch (math 41% / reading 51%, grade D+, #85 of 665 statewide, top 13%, 819 students, 0% FRL); Lemont Twp High School (math 46% / reading 47%, grade D-, #57 of 693 statewide, top 8%, 1,324 students, 0% FRL).
- Market conditions: 135 active listings in the ZIP; 5 comparable units currently listed for rent nearby; rentals leasing fast (median 0d on market — plan ~1-2 weeks tenant-placement turnaround); high-income renter base; 6,272 units permitted in Cook County in 2024 (4,658 in 5+ unit buildings).
Forward outlook
- Local home prices are declining (-3.0%/yr); year-one equity from $2k of loan paydown is wiped out by about $8k of value loss. Plan a longer hold.
Negotiation context
- It's been on market 33 days — a 3% lower offer ($273k) is reasonable based on typical stale-listing flexibility.
- Current owner paid $219k; 28% above their basis — modest negotiation headroom, anchor on the comps not their cost.
Risks & watch-outs
- Watch-outs: built in 1887 — expect roof / HVAC / electrical / plumbing capex.
Questions for the listing agent
- It's been on market 33 days. Have you received any prior offers? Is the seller open to a 9% concession, seller financing, or rate buy-down credit?
- Built in 1887 — when were the roof, HVAC, electrical panel, plumbing, and water heater last replaced?
- Is there a deadline driving the sale (1031 exchange, divorce, estate, relocation)? That informs how much negotiation room exists.
- Schools are B-rated — typically a magnet for longer-tenancy family renters. What's the average tenant stay here, and is there a school-zone premium baked into asking?
- What's the average days-on-market for RENTAL listings here right now (not sales)? A rising rental-DOM trend means longer vacancies and softer asking-rent achievability than the comps imply.
- What's the recent tenant-quality profile in this submarket — average credit score on applications, eviction rate, late-payment / NSF rate, and stable-employment percentage? A property-management company in the area should have these aggregated.
- How much new for-sale + rental construction is in the pipeline within 1–3 miles? Heavy new supply typically softens prices + rents 12–24 months out; constrained supply supports both.
Investment metrics
- 1% rule
- 0.91% ✗
- Cap rate
- 6.85%
- Cash-on-cash
- 2.00%
- DSCR
- 1.09
- GRM
- 9.1
CMA / ARV
- ARV (on-the-fly)
- $407,232
- Comps found
- 12
Show comp detail 12 sales within ~0.75 mi
| Address | Dist | Beds/Ba | Sqft | Sold | Price | $/sf | Match |
|---|---|---|---|---|---|---|---|
| 214 Lincoln St | 0.33mi | 4/1.5 (+1) | 1,376 (+2%) | 5mo | $455,000 | $331 | 72 |
| 705 State St | 0.47mi | 3/1.0 | 1,330 (-1%) | 4mo | $302,551 | $227 | 71 |
| 903 Porter St | 0.16mi | 3/1.5 | 1,196 (-11%) | 6mo | $292,500 | $245 | 69 |
| 727 Mccarthy St | 0.46mi | 3/2.5 | 1,296 (-4%) | 9mo | $428,000 | $330 | 61 |
| 714 Walnut St | 0.48mi | 3/2.0 | 1,267 (-6%) | 8mo | $392,000 | $309 | 60 |
| 322 Freehauf St | 0.72mi | 3/2.0 | 1,384 (+3%) | 1mo | $419,000 | $303 | 59 |
| 611 Houston | 0.40mi | 3/2.5 | 1,217 (-9%) | 8mo | $375,000 | $308 | 55 |
| 306 Stephen St | 0.18mi | 2/2.0 (-1) | 1,513 (+13%) | 18mo | $300,000 | $198 | 48 |
| 414 Hillview Ct | 0.63mi | 3/2.0 | 1,222 (-9%) | 8mo | $475,000 | $389 | 47 |
| 906 State St | 0.71mi | 3/1.0 | 1,482 (+10%) | 5mo | $195,000 | $132 | 44 |
| 722 Czacki St | 0.44mi | 2/1.5 (-1) | 1,520 (+13%) | 12mo | $400,000 | $263 | 42 |
| 900 Singer Ave | 0.72mi | 3/1.0 | 1,251 (-7%) | 13mo | $264,500 | $211 | 42 |
Match score weights: distance 35% · size 25% · config 20% · recency 20%. Top-matched comps best support the ARV.
Projected returns pro-forma
-3.0% appreciation · 3.0% rent growth · sell at horizon
- IRR
- -13.1%
- Equity multiple
- 0.53×
- Total profit
- $-37,188
- Equity at exit
- $41,898
- IRR
- -4.2%
- Equity multiple
- 0.73×
- Total profit
- $-21,606
- Equity at exit
- $24,296
Cash invested: $78,680 (down + closing). Projections, not guarantees.
Landlord ↔ Tenant lean methodology
- Overall (STATE)
- 43 Moderately Tenant-Leaning
- State Illinois
- 43 Moderately Tenant-Leaning · D+7
- County
- — inherits STATE
- City
- — inherits STATE
ZIP-level market 60439
- Active inventory
- 135
- Price-to-rent
- 9.1×
Monthly cashflow live
- Estimated rent
- $2,567 high interval (Pro) →
- Mortgage (P&I)
- −$1,474
- Tax from tax record
- −$306 /mo · $3,675/yr
- Insurance
- −$117
- HOA
- −$0
- Vacancy / Maint / Mgmt
- −$539
- Net cashflow
- $131
Break-even live
Sensitivity live
| Price | -10% $290 | -5% $210 | +0% $131 | +5% $51 | +10% $-28 |
|---|---|---|---|---|---|
| Rent | -10% $-72 | -5% $29 | +0% $131 | +5% $232 | +10% $334 |
| Rate | -1.0pp $272 | -0.5pp $202 | base $131 | +0.5pp $58 | +1.0pp $-16 |
UW: 25.0% down · 7.5% · 30yr · 1.5% tax · 5.0% vac · 8.0% maint · 8.0% mgmt
Financing live
Cash to close
- Down payment
- $70,250
- Closing costs
- $8,430
- Reserves months
- —
- Total cash needed
- —
Loan-product check · same deal, 3 products live
Conventional
25% down · 7.5% · 30yr
- Down + closing
- —
- Monthly P&I
- —
- Monthly cashflow
- —
- DSCR
- —
- Eligible?
- —
Personal DTI + credit; lowest rate.
DSCR
20% down · 8.5% · 30yr
- Down + closing
- —
- Monthly P&I
- —
- Monthly cashflow
- —
- DSCR
- —
- Eligible?
- —
No personal income docs; deal must DSCR.
Hard money
10% down · 12.0% · 12mo
- Down + closing
- —
- Monthly P&I
- —
- Monthly cashflow
- —
- DSCR
- —
- Eligible?
- —
Short-term bridge; refi at stabilization.
Rent comps 5 comps
| Address | Beds | Baths | Sqft | Rent | $/sqft | DOM | Units | Dist |
|---|---|---|---|---|---|---|---|---|
| 225 Canal St Lemont, IL | 2.0 | 2.0 | 1193 | $2,880 | $2.41 | 0d | 1 | 0.30mi |
| 612 Moczygemba St Unit 1 Lemont, IL | 2.0 | 1.0 | 1000 | $1,575 | $1.57 | 3d | 1 | 0.37mi |
| 700 McCarthy St Lemont, IL | 3.0 | 2.0 | 1397 | $2,800 | $2.00 | 0d | 1 | 0.39mi |
| 1019 Kim Pl Lemont, IL | 3.0 | 2.0 | 1067 | $3,375 | $3.16 | 0d | 1 | 0.85mi |
| 16386 New Ave Lemont, IL | 3.0 | 3.0 | 1837 | $2,600 | $1.42 | 9d | 1 | 1.32mi |
Listing history 19 events
-
2026-06-21days on market $280,999 Active 33 DOM
-
2026-06-18days on market $280,999 Active 30 DOM
-
2026-06-17days on market $280,999 Active 29 DOM
-
2026-06-16days on market $280,999 Active 28 DOM
-
2026-06-15days on market $280,999 Active 27 DOM
-
2026-06-13days on market $280,999 Active 25 DOM
-
2026-06-09days on market $280,999 Active 21 DOM
-
2026-06-08days on market $280,999 Active 20 DOM
-
2026-06-07days on market $280,999 Active 19 DOM
-
2026-06-04pricedays on market $280,999 Active 16 DOM
-
2026-06-03days on market $285,999 Active 15 DOM
-
2026-06-02days on market $285,999 Active 14 DOM
-
2026-06-01days on market $285,999 Active 13 DOM
-
2026-05-31days on market $285,999 Active 12 DOM
-
2026-05-18$285,999 Active
-
2006-04-17soldstatus $219,000
-
2004-09-28soldstatus $180,000
-
2001-08-16soldstatus $135,000
-
1990-08-24soldstatus $65,000
ⓘ Source: listings_history table (triggers on properties + properties_extension) + one-shot
backfill from property_details.listing_events for pre-trigger history.
Tax reassessment forecast IL · Partial reset (capped growth)
- Current annual tax
- $3,675 · $306/mo
- Projected year-2 tax
- $5,027 · $419/mo
- Expected delta
- +$1,352/yr (+$113/mo · 36.8%)
ⓘ Screening estimate from a state-policy table — verify with the county assessor before closing.
Climate risk First Street
- Flood 1/10 Low FEMA zone X (unshaded) · 0% chance over 30 yrs
- Wildfire 1/10 Low
- Heat 3/10 Moderate 7 d/yr ≥103°F today · 15 d/yr by 30 yrs out
- Wind 2/10 Low
- Air quality 4/10 Moderate 4 unhealthy d/yr today · 5 by 30 yrs out
Nearby sold comps map
Loading sold comps map…
Walkable amenities ~0.75 mi
Loading nearby amenities…
Taxation est. · year 1
- Rental income
- $30,802
- − Mortgage interest
- −$15,740
- − Property taxes
- −$3,675
- − Insurance
- −$1,405
- − Repairs & maintenance
- −$2,464
- − Management
- −$2,464
- − Depreciation
- −$8,175
- Taxable loss
- −$3,121
- Est. tax savings @ 24.0%
- +$749
- After-tax cash flow
- $2,319/yr
For passive investors: Depreciation is non-cash, so a rental often shows a tax loss while cash-flowing — sheltering income. Rental losses are passive: they offset passive income freely, and up to $25,000/yr can offset ordinary (W-2) income if you actively participate and your MAGI is under $100k (phasing out to $0 by $150k); unused losses carry forward. On sale, claimed depreciation is recaptured at up to 25%, and gains may owe capital-gains tax (a 1031 exchange can defer both). Figures are a year-1 estimate at your 24.0% rate — not tax advice; consult a CPA.
Schools (NCES district)
- District
- Lemont Twp Hsd 210
- NCES district ID
- 1722500
- Math proficiency
- 46% ▼ -5.00%
- Reading proficiency
- 47% ▼ -9.00%
- Median HH income
- $92,102
- Composite
- 43.91/100
- National rank
- #2913
- State rank
- #57 of 620 in IL
Livability — Lemont
- Score
- 69/100
- State rank
- #389
- US rank
- #8173
Category grades
Schools grade is shown separately in the Schools card above.
Census & demographics
- Census place
- Lemont, IL
- County
- Cook County · 4,486,803 people
- City population
- 24,192
- Metro
- Chicago-Naperville-Elgin, IL-IN-WI
- Population (ZIP)
- 24,192
- Household income
- $121,724
- Rent vs Own
- Severe rent burden
- 169.0
Population outlook (Cook County) Hauer SSP2
- Today (2025)
- 5,347,519 people
- By 2030
- 5,357,703 · +0.2%
- By 2040
- 5,324,924 · -0.4%
- By 2050
- 5,230,762 · -2.2%
- By 2075
- 4,785,735 · -10.5%
- By 2100
- 4,188,836 · -21.7%
Race, ethnicity, and origin ACS 2023
- Neighborhood character
- Predominantly White (86%)
- Race & ethnicity
- White 86% Hispanic / Latino 10% Two or more races 7% Asian 2% Black 1%
- Hispanic origin (detail)
- Mexican 8% Puerto Rican 1%
- Common ancestry
- Romanian 25% Lithuanian 2% Iranian 1%
- Foreign-born
- 16% · Canada, China, Jamaica
- Languages at home
- 73% English-only · Russian/Polish/Slavic 13% Other Indo-European 8% Spanish 3%
Political lean MEDSL · Cook
- 2024 margin
- Solid D (+42.0) · D 70.4% · R 28.4% · Other 1.2%
- 2008→2024 swing
- -11.4pp toward R · 2008: 53.4pp · 2024: 42.0pp
- All cycles
- 2024: D+42.0 2020: D+50.3 2016: D+53.0 2012: D+49.4 2008: D+53.4
Not yet ingested
- Civics
- —
Market trends
- HPI YoY
- ▼ -228.46%
- Current HPI
- 204.861
- Rent YoY
- —
- Metro
- Chicago-Naperville-Elgin, IL-IN-WI
- State GDP YoY
- ▲ 1.59%
- F500 in state
- 60
Industry mix (Fortune 500 HQ in IL)
| Industry | F500 HQs | Revenue |
|---|---|---|
| Insurance | 4 | $201B |
|
||
| Consumer Goods | 4 | $87B |
|
||
| Industrial Machinery | 3 | $64B |
|
||
| Healthcare | 2 | $55B |
|
||
| Retail / Pharmacy | 1 | $148B |
|
||
| Agriculture / Food | 1 | $86B |
|
||
Price history
+340.0% since first listed5 events — show timeline
- 2026-05-18 Listed $285,999 MRED as Distributed by MLS Grid
- 2006-04-17 Sold (Public Records) $219,000 Public Records
- 2004-09-28 Sold (Public Records) $180,000 Public Records
- 2001-08-16 Sold (Public Records) $135,000 Public Records
- 1990-08-24 Sold (Public Records) $65,000 Public Records
Property tax history
+1.7%/yrLatest (2023): $3,675 · +26.8% YoY. Source: county tax records.
Cash-flow waterfall
monthlySold comps — $/sqft
last 12 mo · ≤1 miLoading sold comps…