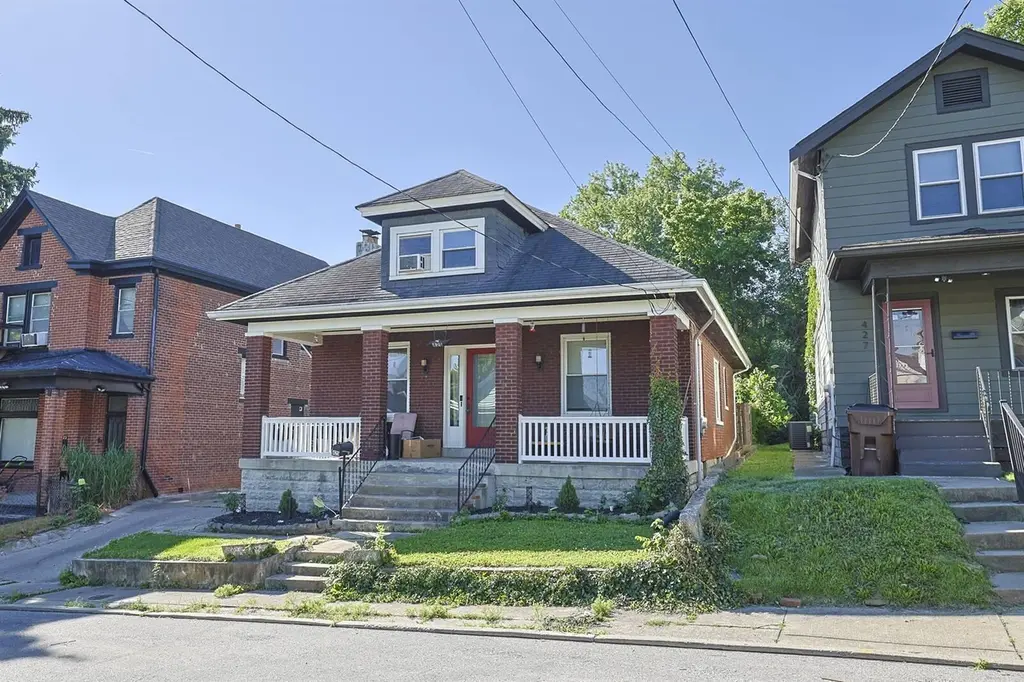
425 W 22nd St · Covington, KY
Flood risk 1/10 · Minimal
- FEMA flood zone
- X (unshaded)
- Chance of flooding over 30 yrs
- 0.0%
- Est. flood insurance / yr
- $507 – $1,088
Fire risk 1/10 · Minimal
- Est. fire insurance / yr
- $839 – $1,559
Heat risk 5/10 · Moderate
- Hot days now (above 102°F)
- 7 days/yr
- Hot days in 30 yrs
- 20 days/yr
Wind risk 2/10 · Minimal
- Chance of severe wind over 30 yrs
- 1.0%
Air-quality risk 3/10 · Minor
- Unhealthy air days now
- 2 days/yr
- Unhealthy air days in 30 yrs
- 3 days/yr
Risk factors via First Street. Map © Google.
Why this score? — see what drove the D grade
The composite is a weighted blend of 9 inputs, each scored 0–100. Each bar is that input's sub-score; the figure is the points it added to the 100-point composite (weight × sub-score).
- Cash flow +14.9/30.0
- ARV discount +8.9/15.0
- DSCR +4.6/10.0
- Livability +4.3/5.0
- Rent growth +3.8/5.0
- 1% rule +3.0/10.0
- Condition / age +2.5/5.0
- Schools +1.5/10.0
- Appreciation +0.0/10.0
$245,000
🖨 Deal sheet 📄 Offer letter ✓ Due diligence
Listing remarks
One of a Kind Classic designed Brick home with off Street Parking for many Vehicles in Peaselburg! Lots of character with all the beautiful woodwork. Spacious rooms with Over 1200 sq. ft. on the main Level and an additional 400 Plus on 2nd level. Fantastic full front Porch for Entertainment and relaxation. First floor laundry makes life easier. Fenced backyard for ease of mind. Make this piece of Covington history yours today!
Key facts
- Off street parking
- Full front porch
- 4,633 sq ft lot
Tags
Property features AI
Exterior
- Parking: 5 off-street parking spaces; Oversized parking
- Utilities: Public water; Private sewer; Cable available; Natural gas available
- Home design: Single family house; One and one half stories; Built in 1921; Has a view
- Construction: Brick construction; Asphalt shingle roof; Block and stone foundation
- Exterior features: Porch; Private yard; Partial fencing; Level lot; Lot dimensions approximately 50 x 93 x 50 x 90
Interior
- Kitchen: Gas cooktop; Gas range; Gas oven; Dishwasher; Microwave; Refrigerator
- Bedrooms: Primary bedroom (13 x 12)
- Bathrooms: 2 full bathrooms; 1 half bathroom
- Interior features: Entrance foyer; Ceiling fan(s); High ceilings; Multi-panel doors; Natural woodwork; Inoperable fireplace
- Laundry & utility: Main level laundry room; Washer; Dryer
Neighborhood map
What this means for you Summary
Snapshot
- This is a 4-bed/2.5-bath single-family listed at $245k.
Deal economics
- At list price, monthly cash flow is $72 ($862/yr) — positive.
- The deal already cash-flows at list — no discount required.
- To meet the 1% rule (rent ≥ 1% of price), the offer needs to be $197k (19.6% below list).
- Recommended offer: $197k (19.6% below list) — sets the bar for 1% rule.
- Cap rate 6.6% vs local median 5.3% in Covington — meaningfully above typical; check what's discounted (condition, days-on-market, listing class) to confirm the premium yield is real.
Location & tenants
- Location reads 86/100 on livability (#40 in KY, #376 nationally) — a professional / high-income tenant draw. Strengths: amenities A+, commute A+, cost of living A+; Watch: employment D+.
- Covington Independent (suburban): math 10% / reading 27% proficiency, ranked #162 of 165 in KY (top 98%) — low school quality limits family demand, transient renter base, plan for 1-2y turnover; 78% free/reduced lunch — lower-income household profile, screen leases tightly.
- Zoned schools: Glenn O Swing Elementary (math 29% / reading 50%, grade F, #208 of 676 statewide, top 34%, 407 students, 78% FRL); Holmes Middle School (math 8% / reading 26%, grade F, #211 of 217 statewide, top 97%, 656 students, 84% FRL); Holmes High School (math 12% / reading 17%, grade F, #227 of 254 statewide, top 89%, 878 students, 80% FRL) — zoned schools at 81% FRL track the district average.
- Market conditions: Rents rising fast (+5.1%/yr); 59 active listings in the ZIP; 6 comparable units currently listed for rent nearby; rentals at typical pace (median 20d on market — plan ~3-4 weeks tenant-placement turnaround); 699 units permitted in Kenton County in 2024 (287 in 5+ unit buildings).
- This rent runs 39% of the median local income ($61k/yr) — at the standard rent-burdened threshold; future hikes will face affordability resistance.
Forward outlook
- Local home prices are declining (-3.0%/yr); year-one equity from $2k of loan paydown is wiped out by about $7k of value loss. Plan a longer hold.
- Kenton County population projected at +5% by 2050 — modest demand growth; plan on rents tracking national, not racing it.
Negotiation context
- Only 10 days on market — expect competitive offers; lowballing is unlikely to land.
- 5 sale attempts since 17y ago with the ask held roughly flat each time — persistent listings suggest the price (not the market) is what's stuck; bring a comps-based counter.
- Current owner paid $85k; list at $245k implies a 188% gain — meaningful room to come down on a strong offer.
Risks & watch-outs
- Watch-outs: built in 1921 — expect roof / HVAC / electrical / plumbing capex.
- Climate carrying-cost: extreme-heat days projected 7→20/yr by 2055 (HVAC capex compounding) — expect insurance premiums to compound above CPI over the hold.
Questions for the listing agent
- Built in 1921 — when were the roof, HVAC, electrical panel, plumbing, and water heater last replaced?
- Is there a deadline driving the sale (1031 exchange, divorce, estate, relocation)? That informs how much negotiation room exists.
- The area grade is low — what's the realistic commute time and amenity access for the typical tenant pool here? Any planned neighborhood developments (good or bad) we should know about?
- What's the average days-on-market for RENTAL listings here right now (not sales)? A rising rental-DOM trend means longer vacancies and softer asking-rent achievability than the comps imply.
- What's the recent tenant-quality profile in this submarket — average credit score on applications, eviction rate, late-payment / NSF rate, and stable-employment percentage? A property-management company in the area should have these aggregated.
- How much new for-sale + rental construction is in the pipeline within 1–3 miles? Heavy new supply typically softens prices + rents 12–24 months out; constrained supply supports both.
Investment metrics
- 1% rule
- 0.80% ✗
- Cap rate
- 6.64%
- Cash-on-cash
- 1.26%
- DSCR
- 1.06
- GRM
- 10.4
CMA / ARV
- ARV (on-the-fly)
- $253,128
- Comps found
- 12
Show comp detail 12 sales within ~0.75 mi
| Address | Dist | Beds/Ba | Sqft | Sold | Price | $/sf | Match |
|---|---|---|---|---|---|---|---|
| 2307 Herman St | 0.13mi | 3/1.0 (-1) | 1,264 (-1%) | 0mo | $145,000 | $115 | 82 |
| 218 W 21st St | 0.18mi | 3/2.0 (-1) | 1,240 (-2%) | 3mo | $246,500 | $199 | 78 |
| 1735 Woodburn Ave | 0.38mi | 3/1.5 (-1) | 1,255 (-1%) | 1mo | $259,900 | $207 | 70 |
| 1844 Euclid Ave | 0.26mi | 5/2.0 (+1) | 1,399 (+10%) | 1mo | $294,900 | $211 | 64 |
| 332 W 21st St | 0.12mi | 3/1.5 (-1) | 1,120 (-12%) | 3mo | $167,000 | $149 | 63 |
| 2011 Howell St | 0.11mi | 3/1.5 (-1) | 1,104 (-13%) | 2mo | $189,000 | $171 | 63 |
| 1733 Jefferson Ave | 0.41mi | 3/1.5 (-1) | 1,203 (-5%) | 1mo | $242,000 | $201 | 62 |
| 9 Madison Ct | 0.60mi | 3/2.0 (-1) | 1,297 (+2%) | 2mo | $230,000 | $177 | 60 |
| 1821 Jefferson Ave | 0.32mi | 3/2.0 (-1) | 1,116 (-12%) | 2mo | $242,000 | $217 | 56 |
| 25 W 28th St | 0.66mi | 3/1.5 (-1) | 1,234 (-3%) | 2mo | $266,000 | $216 | 54 |
| 30 W 28th St | 0.63mi | 3/2.0 (-1) | 1,157 (-9%) | 1mo | $200,000 | $173 | 48 |
| 8 W 30th St | 0.73mi | 3/1.0 (-1) | 1,348 (+6%) | 3mo | $77,600 | $58 | 42 |
Match score weights: distance 35% · size 25% · config 20% · recency 20%. Top-matched comps best support the ARV.
Projected returns pro-forma
-3.0% appreciation · 5.13% rent growth · sell at horizon
- IRR
- -12.2%
- Equity multiple
- 0.55×
- Total profit
- $-30,909
- Equity at exit
- $36,530
- IRR
- -0.6%
- Equity multiple
- 0.96×
- Total profit
- $-2,937
- Equity at exit
- $21,183
Cash invested: $68,600 (down + closing). Projections, not guarantees.
Landlord ↔ Tenant lean methodology
- Overall (STATE)
- 83 Strongly Landlord-Friendly
- State Kentucky
- 83 Strongly Landlord-Friendly · R+16
- County
- — inherits STATE
- City
- — inherits STATE
ZIP-level market 41014
- Rents YoY
- 5.1%
- Active inventory
- 59
- Price-to-rent
- 10.4×
Monthly cashflow live
- Estimated rent
- $1,970 high interval (Pro) →
- Mortgage (P&I)
- −$1,285
- Tax from tax record
- −$98 /mo · $1,174/yr
- Insurance
- −$102
- HOA
- −$0
- Vacancy / Maint / Mgmt
- −$414
- Net cashflow
- $72
Break-even live
UW: 25.0% down · 7.5% · 30yr · 1.5% tax · 5.0% vac · 8.0% maint · 8.0% mgmt
Financing live
Cash to close
- Down payment
- $61,250
- Closing costs
- $7,350
- Reserves months
- —
- Total cash needed
- —
Loan-product check · same deal, 3 products live
Conventional
25% down · 7.5% · 30yr
- Down + closing
- —
- Monthly P&I
- —
- Monthly cashflow
- —
- DSCR
- —
- Eligible?
- —
Personal DTI + credit; lowest rate.
DSCR
20% down · 8.5% · 30yr
- Down + closing
- —
- Monthly P&I
- —
- Monthly cashflow
- —
- DSCR
- —
- Eligible?
- —
No personal income docs; deal must DSCR.
Hard money
10% down · 12.0% · 12mo
- Down + closing
- —
- Monthly P&I
- —
- Monthly cashflow
- —
- DSCR
- —
- Eligible?
- —
Short-term bridge; refi at stabilization.
Rent comps 6 comps
| Address | Beds | Baths | Sqft | Rent | $/sqft | DOM | Units | Dist |
|---|---|---|---|---|---|---|---|---|
| 2307 Center St Covington, KY | 3.0 | 1.5 | 1216 | $1,950 | $1.60 | 8d | 1 | 0.14mi |
| 1927 Scott St Apt 1 Covington, KY | 3.0 | 2.0 | 1865 | $2,100 | $1.13 | 20d | 1 | 0.46mi |
| 2030 Mackoy St Covington, KY | 3.0 | 1.5 | 1598 | $1,779 | $1.11 | 4d | 1 | 0.55mi |
| 1222 E Henry Clay Ave Fort Wright, KY | 3.0 | 1.5 | 1200 | $1,548 | $1.29 | 24d | 1 | 0.86mi |
| 1205 Lee St Unit 3 Covington, KY | 3.0 | 2.5 | 1850 | $3,000 | $1.62 | 24d | 1 | 0.95mi |
| 1700 Aspen Pines Dr Wilder, KY | 1.0–3.0 | 1.0–2.5 | 1420 | $2,365 | $1.67 | 2d | 14 | 1.45mi |
Listing history 7 events
-
2026-06-18days on market $245,000 Active 10 DOM
-
2026-06-17days on market $245,000 Active 9 DOM
-
2026-06-16days on market $245,000 Active 8 DOM
-
2026-06-15days on market $245,000 Active 7 DOM
-
2026-06-10remarks 431-char remark
-
2026-06-08remarks 252-char remark
-
2026-06-08$245,000 Active 1 DOM
ⓘ Source: listings_history table (triggers on properties + properties_extension) + one-shot
backfill from property_details.listing_events for pre-trigger history.
Tax reassessment forecast KY · Resets to sale price
- Current annual tax
- $1,174 · $98/mo
- Projected year-2 tax
- $2,107 · $176/mo
- Expected delta
- +$933/yr (+$78/mo · 79.5%)
ⓘ Screening estimate from a state-policy table — verify with the county assessor before closing.
Climate risk First Street
- Flood 1/10 Low FEMA zone X (unshaded) · 0% chance over 30 yrs
- Wildfire 1/10 Low
- Heat 5/10 Major 7 d/yr ≥102°F today · 20 d/yr by 30 yrs out
- Wind 2/10 Low 100% chance of damaging wind over 30 yrs
- Air quality 3/10 Moderate 2 unhealthy d/yr today · 3 by 30 yrs out
Nearby sold comps map
Loading sold comps map…
Walkable amenities ~0.75 mi
Loading nearby amenities…
Taxation est. · year 1
- Rental income
- $23,644
- − Mortgage interest
- −$13,724
- − Property taxes
- −$1,174
- − Insurance
- −$1,225
- − Repairs & maintenance
- −$1,892
- − Management
- −$1,892
- − Depreciation
- −$7,127
- Taxable loss
- −$3,389
- Est. tax savings @ 24.0%
- +$813
- After-tax cash flow
- $1,676/yr
For passive investors: Depreciation is non-cash, so a rental often shows a tax loss while cash-flowing — sheltering income. Rental losses are passive: they offset passive income freely, and up to $25,000/yr can offset ordinary (W-2) income if you actively participate and your MAGI is under $100k (phasing out to $0 by $150k); unused losses carry forward. On sale, claimed depreciation is recaptured at up to 25%, and gains may owe capital-gains tax (a 1031 exchange can defer both). Figures are a year-1 estimate at your 24.0% rate — not tax advice; consult a CPA.
Schools (NCES district)
- District
- Covington Independent
- NCES district ID
- 2101350
- Math proficiency
- 10% ▼ -20.00%
- Reading proficiency
- 27% ▼ -14.00%
- Median HH income
- $33,681
- Composite
- 15.04/100
- National rank
- #9353
- State rank
- #162 of 165 in KY
Livability — Covington
- Score
- 86/100
- State rank
- #40
- US rank
- #376
Category grades
Schools grade is shown separately in the Schools card above.
Census & demographics
- Census place
- Covington, KY
- County
- Kenton County · 142,881 people
- City population
- 34,373
- Metro
- Cincinnati, OH-KY-IN
- Population (ZIP)
- 7,392
- Household income
- $61,382
- Rent vs Own
- Severe rent burden
- 511.0
Population outlook (Kenton County) Hauer SSP2
- Today (2025)
- 174,205 people
- By 2030
- 177,897 · +2.1%
- By 2040
- 182,671 · +4.9%
- By 2050
- 183,543 · +5.4%
- By 2075
- 178,977 · +2.7%
- By 2100
- 159,920 · -8.2%
Race, ethnicity, and origin ACS 2023
- Neighborhood character
- Predominantly White (71%)
- Race & ethnicity
- White 71% Two or more races 11% Hispanic / Latino 10% Black 8% Asian 2%
- Hispanic origin (detail)
- Mexican 1%
- Common ancestry
- Romanian 2% Lithuanian 1% Italian 1%
- Foreign-born
- 6% · Canada, China
- Languages at home
- 91% English-only · Spanish 8%
Political lean MEDSL · Kenton
- 2024 margin
- Strong R (+21.7) · D 38.2% · R 59.9% · Other 1.9%
- 2008→2024 swing
- -0.9pp no change · 2008: -20.9pp · 2024: -21.7pp
- All cycles
- 2024: R+21.7 2020: R+19.3 2016: R+26.1 2012: R+24.3 2008: R+20.9
Not yet ingested
- Civics
- —
Market trends
- HPI YoY
- ▼ -172.77%
- Current HPI
- 233.8216
- Rent YoY
- ▲ 5.13%
- Metro
- Cincinnati, OH-KY-IN
- State GDP YoY
- ▲ 1.81%
- F500 in state
- 4
Industry mix (Fortune 500 HQ in KY)
| Industry | F500 HQs | Revenue |
|---|---|---|
| Healthcare | 1 | $118B |
|
||
| Food / Beverage | 1 | $7B |
|
||
Price history
+390.0% since first listed11 events — show timeline
- 2026-06-08 Listed $245,000 NKMLS
- 2015-01-16 Sold (Public Records) $85,000 Public Records
- 2013-11-30 Listing Removed — NKMLS
- 2013-08-30 Listed $84,000 NKMLS
- 2010-08-31 Listing Removed — NKMLS
- 2010-05-21 Listed $99,900 NKMLS
- 2010-05-03 Listing Removed — NKMLS
- 2010-02-04 Listed $103,000 NKMLS
- 2009-12-31 Listing Removed — NKMLS
- 2009-09-18 Listed $109,900 NKMLS
- 2008-09-12 Sold (Public Records) $50,000 Public Records
Property tax history
-0.5%/yrLatest (2025): $1,174 · +0.7% YoY. Source: county tax records.
Cash-flow waterfall
monthlySold comps — $/sqft
last 12 mo · ≤1 miLoading sold comps…