 🏗️ New Construction
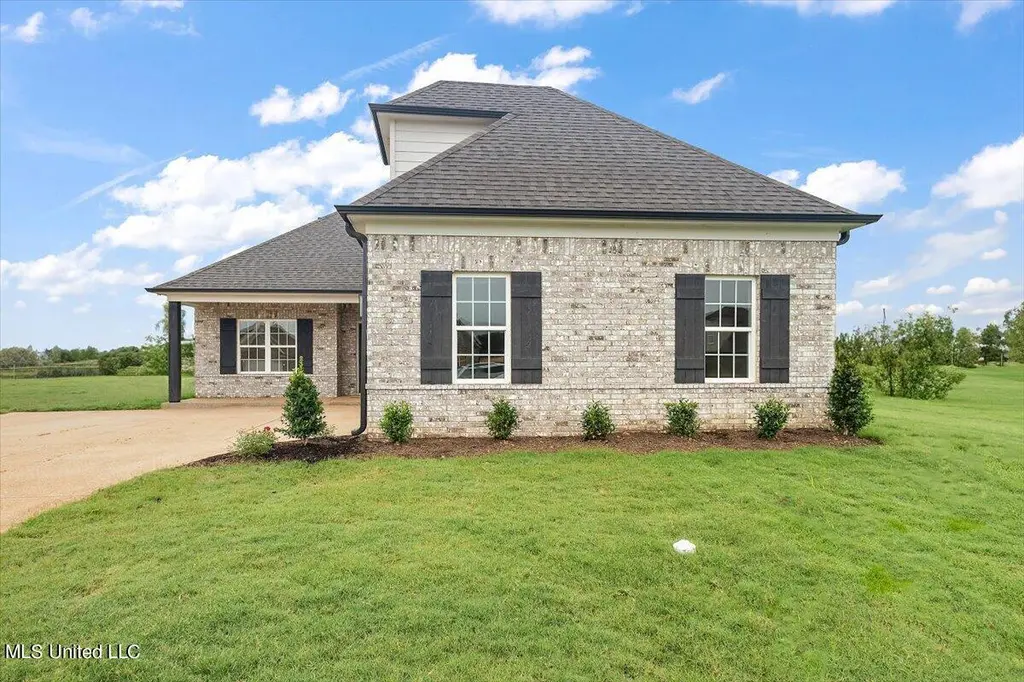
6358 River Ln · Lynchburg, MS
Flood risk No data
- FEMA flood zone
- —
- Chance of flooding over 30 yrs
- —
- Est. flood insurance / yr
- —
Fire risk No data
- Est. fire insurance / yr
- —
Heat risk No data
- Hot days now (above threshold)
- —
- Hot days in 30 yrs
- —
Wind risk No data
- Chance of severe wind over 30 yrs
- —
Air-quality risk No data
- Unhealthy air days now
- —
- Unhealthy air days in 30 yrs
- —
Risk factors via First Street. Map © Google.
Why this score? — see what drove the D- grade
The composite is a weighted blend of 9 inputs, each scored 0–100. Each bar is that input's sub-score; the figure is the points it added to the 100-point composite (weight × sub-score).
- Appreciation +10.0/10.0
- ARV discount +7.5/15.0
- Cash flow +6.3/30.0
- Schools +4.0/10.0
- Livability +3.2/5.0
- Rent growth +2.5/5.0
- Condition / age +2.5/5.0
- 1% rule +1.6/10.0
- DSCR +0.6/10.0
$312,900
🖨 Deal sheet 📄 Offer letter ✓ Due diligence
Listing remarks
Seller will consider paying 3% concessions or allowances toward buyers closing costs, upgrades, rate buy-down LAKE CORMORANT SCHOOLS! Sunflower floor plan in the newest Walls subdivision, Long Branch! Beautiful carriage load floor plan with front porch sitting! As you enter the front door you are welcomed with a large family room with cozy fireplace. Divided by a breakfast bar is the kitchen with a great view of the back yard and living area. The kitchen features granite countertops, stainless steel appliances, kitchen island and custom painted cabinets! Just off the kitchen is a nice size covered pack porch to enjoy the nice country setting of Long Branch! Back off of the living room you
Key facts
- Sunflower floor plan
- Kitchen island
- Granite countertops
Tags
Property features AI
Finance
- HOA & community: Homeowners association with annual fee of $300 covering grounds maintenance
Exterior
- Parking: Attached 2-car garage with carriage load, garage door opener and concrete driveway
- Security: Smoke detectors; Carbon monoxide detectors; Deadbolt locks
- Utilities: Public water; Public sewer; Electricity connected; Natural gas connected; Underground utilities
- Home design: Single-family house; Sunflower plan (builder model); Two levels; Under construction / new construction
- Construction: Brick and siding exterior; Architectural shingle roof; Slab foundation; Built by builder (living area and year built sourced from builder)
- Exterior features: Front porch, rear porch and additional porch; Rain gutters; Cleared, landscaped and level lot
Interior
- Kitchen: Dishwasher; Disposal; Free-standing electric oven and range; Microwave; Stone counters; Kitchen island; Breakfast bar
- Bedrooms: Primary bedroom on first floor (approx. 12 x 15); Two additional first-floor bedrooms (each approx. 11 x 12); Bonus room on second floor (approx. 13 x 20); Additional first-floor bonus room (approx. 6 x 6)
- Flooring: Luxury vinyl; Carpet; Combination of flooring types
- Bathrooms: Two full bathrooms (including primary bathroom on first floor)
- Heating & cooling: Central heating (natural gas) with fireplace supplemental heat; Central air; Ceiling fans; Dual/multi-unit cooling options; Electric and gas utilities for HVAC
- Interior features: Open floorplan with high ceilings; Recessed lighting; Ceiling fans; Breakfast bar; Eat-in kitchen; Kitchen island; Stone counters; Double vanity in primary bath; His and hers closets; Walk-in closets; Bay windows and shutters; Insulated windows; Deadbolt locks; Fireplace in great room; 10 total rooms
- Laundry & utility: Laundry room with washer and electric dryer hookups; Washer hookup available; Laundry access on main and lower levels
Neighborhood map
What this means for you Summary
Snapshot
- This is a 4-bed/2.0-bath single-family listed at $313k.
Deal economics
- At list price, monthly cash flow is $-555 ($-7k/yr) — negative.
- To cash-flow at today's rent, offer at most $229k (26.9% below list).
- To meet the 1% rule (rent ≥ 1% of price), the offer needs to be $203k (35.1% below list).
- Recommended offer: $203k (35.1% below list) — sets the bar for 1% rule.
Location & tenants
- Location reads 63/100 on livability (#145 in MS) — a middle-class / working-renter tenant base. Strengths: crime A+, cost of living A+, housing A+; Watch: amenities F, commute F, health & safety F.
- Desoto County School District (suburban): math 48% / reading 42% proficiency, ranked #20 of 130 in MS (top 15%) — families likely to look elsewhere, expect single-tenant / working-renter base with shorter leases.
- Zoned schools: Lake Cormorant Elementary (math 48% / reading 55%, grade C-, #56 of 375 statewide, top 15%, 647 students, 100% FRL); Lake Cormorant Middle (math 51% / reading 30%, grade F, #60 of 179 statewide, top 37%, 764 students, 100% FRL); Lake Cormorant High (math 29% / reading 42%, grade F, #66 of 197 statewide, top 34%, 969 students, 100% FRL) — zoned schools average 100% FRL vs 43% district-wide (56 pts higher); higher-poverty schools than district average — tighter screening recommended.
- Market conditions: 51 active listings in the ZIP; 12 comparable units currently listed for rent nearby; rentals at typical pace (median 17d on market — plan ~3-4 weeks tenant-placement turnaround); 1,155 units permitted in DeSoto County in 2024 (0 in 5+ unit buildings).
- This rent runs 41% of the median local income ($60k/yr) — at the standard rent-burdened threshold; future hikes will face affordability resistance.
Forward outlook
- In year one you build about $33k of equity ($2k loan paydown + $31k appreciation (10.0% local appreciation)).
- DeSoto County population projected at +33% by 2050 — long-run rental-demand tailwind backs the buy-and-hold thesis.
- By year 2, paydown + projected appreciation supports a ~$53k cash-out refi (75% LTV) — recoverable capital for the next deal without selling this one.
Negotiation context
- It's been on market 15 days — a 2% lower offer ($308k) is reasonable based on typical stale-listing flexibility.
Questions for the listing agent
- What do current leases actually rent for vs. the listed asking? Can we see a recent rent roll and the last 12 months of T-12 income?
- What does the HOA fee cover, when was the last increase, and are there any pending special assessments or reserve-fund shortfalls?
- Is there a deadline driving the sale (1031 exchange, divorce, estate, relocation)? That informs how much negotiation room exists.
- Schools are F-rated, which usually means shorter tenancies and higher turnover. Who's the typical renter profile here, and what's been the actual vacancy rate?
- The area grade is low — what's the realistic commute time and amenity access for the typical tenant pool here? Any planned neighborhood developments (good or bad) we should know about?
- What's the average days-on-market for RENTAL listings here right now (not sales)? A rising rental-DOM trend means longer vacancies and softer asking-rent achievability than the comps imply.
- What's the recent tenant-quality profile in this submarket — average credit score on applications, eviction rate, late-payment / NSF rate, and stable-employment percentage? A property-management company in the area should have these aggregated.
- How much new for-sale + rental construction is in the pipeline within 1–3 miles? Heavy new supply typically softens prices + rents 12–24 months out; constrained supply supports both.
Investment metrics
- 1% rule
- 0.66% ✗
- Cap rate
- 4.14%
- Cash-on-cash
- -7.70%
- DSCR
- 0.66
- GRM
- 12.7
CMA / ARV
- ARV (on-the-fly)
- $308,952
- Comps found
- 12
Show comp detail 12 sales within ~0.75 mi
| Address | Dist | Beds/Ba | Sqft | Sold | Price | $/sf | Match |
|---|---|---|---|---|---|---|---|
| 6510 Benjamin Cv | 0.08mi | 4/2.0 | 1,839 (0%) | 1mo | $309,900 | $169 | 95 |
| 6343 Jameson Cv | 0.04mi | 4/2.0 | 1,853 (+1%) | 3mo | $309,900 | $167 | 94 |
| 6432 Clover Ct | 0.05mi | 4/2.0 | 1,853 (+1%) | 2mo | $309,900 | $167 | 94 |
| 6518 Benjamin Cv | 0.09mi | 4/2.0 | 1,840 (+0%) | 3mo | $309,900 | $168 | 93 |
| 6393 Jameson Cv | 0.05mi | 4/2.0 | 1,839 (0%) | 5mo | $309,900 | $169 | 93 |
| 6416 Clover Ct | 0.06mi | 4/2.0 | 1,840 (+0%) | 5mo | $307,900 | $167 | 93 |
| 6394 Jameson Cv | 0.09mi | 4/2.0 | 1,839 (0%) | 5mo | $309,900 | $169 | 92 |
| 6359 Jameson Cv | 0.04mi | 4/2.0 | 1,903 (+4%) | 1mo | $319,900 | $168 | 91 |
| 6502 Benjamin Cv | 0.07mi | 4/2.0 | 1,903 (+4%) | 2mo | $319,900 | $168 | 89 |
| 6398 Jameson Cv | 0.08mi | 4/2.0 | 1,903 (+4%) | 6mo | $315,900 | $166 | 86 |
| 6251 Clover Ct | 0.21mi | 4/2.0 | 1,986 (+8%) | 2mo | $330,900 | $167 | 75 |
| 6263 Clover Ct | 0.20mi | 3/2.0 (-1) | 1,940 (+6%) | 3mo | $324,900 | $167 | 74 |
Match score weights: distance 35% · size 25% · config 20% · recency 20%. Top-matched comps best support the ARV.
Projected returns pro-forma
10.0% appreciation · 3.0% rent growth · sell at horizon
- IRR
- 18.9%
- Equity multiple
- 2.54×
- Total profit
- $132,934
- Equity at exit
- $278,328
- IRR
- 17.5%
- Equity multiple
- 5.85×
- Total profit
- $419,378
- Equity at exit
- $600,226
Cash invested: $86,507 (down + closing). Projections, not guarantees.
Landlord ↔ Tenant lean methodology
- Overall (STATE)
- 90 Strongly Landlord-Friendly
- State Mississippi
- 90 Strongly Landlord-Friendly · R+11
- County
- — inherits STATE
- City
- — inherits STATE
ZIP-level market 38680
- Home prices YoY
- 4.6%
- Active inventory
- 51
- Price-to-rent
- 12.8×
Monthly cashflow live
- Estimated rent
- $2,031 high interval (Pro) →
- Mortgage (P&I)
- −$1,620
- Tax est. 1.5%
- −$386 /mo · $4,634/yr
- Insurance
- −$129
- HOA
- −$25
- Vacancy / Maint / Mgmt
- −$427
- Net cashflow
- $-555
Break-even live
UW: 25.0% down · 7.5% · 30yr · 1.5% tax · 5.0% vac · 8.0% maint · 8.0% mgmt
Financing live
Cash to close
- Down payment
- $77,238
- Closing costs
- $9,269
- Reserves months
- —
- Total cash needed
- —
Loan-product check · same deal, 3 products live
Conventional
25% down · 7.5% · 30yr
- Down + closing
- —
- Monthly P&I
- —
- Monthly cashflow
- —
- DSCR
- —
- Eligible?
- —
Personal DTI + credit; lowest rate.
DSCR
20% down · 8.5% · 30yr
- Down + closing
- —
- Monthly P&I
- —
- Monthly cashflow
- —
- DSCR
- —
- Eligible?
- —
No personal income docs; deal must DSCR.
Hard money
10% down · 12.0% · 12mo
- Down + closing
- —
- Monthly P&I
- —
- Monthly cashflow
- —
- DSCR
- —
- Eligible?
- —
Short-term bridge; refi at stabilization.
Rent comps 12 comps
| Address | Beds | Baths | Sqft | Rent | $/sqft | DOM | Units | Dist |
|---|---|---|---|---|---|---|---|---|
| 6670 Tangleberry Cv Walls, MS | 3.0 | 2.0 | 1600 | $1,770 | $1.11 | 20d | 1 | 0.26mi |
| 6640 Poplar Corner Rd Walls, MS | 3.0 | 3.0 | 2267 | $2,300 | $1.01 | 4d | 1 | 0.57mi |
| 7051 Lake Forest Dr N Walls, MS | 3.0 | 2.0 | 1551 | $1,595 | $1.03 | 43d | 1 | 0.77mi |
| 6757 River Birch Rd Walls, MS | 3.0 | 2.0 | 1331 | $1,720 | $1.29 | 11d | 1 | 0.87mi |
| 5968 Shannon Dr Horn Lake, MS | 3.0 | 2.0 | 1374 | $1,650 | $1.20 | 20d | 1 | 1.00mi |
| 6915 Black Thorn Dr Walls, MS | 4.0 | 2.0 | 1382 | $1,655 | $1.20 | 4d | 1 | 1.02mi |
| 6916 Fox Briar Cv Walls, MS | 3.0 | 2.0 | 1350 | $1,600 | $1.19 | 4d | 1 | 1.10mi |
| 7089 Willow Point Dr Horn Lake, MS | 3.0 | 2.0 | 1900 | $1,895 | $1.00 | 17d | 1 | 1.22mi |
| 5309 Longwood Cv Horn Lake, MS | 4.0 | 2.0 | 1704 | $1,400 | $0.82 | 21d | 1 | 1.22mi |
| 6205 Liberty Estates Dr Walls, MS | 3.0 | 2.0 | 1357 | $1,555 | $1.15 | 4d | 1 | 1.24mi |
| 7601 Broken Hickory Dr Walls, MS | 4.0 | 3.0 | 2176 | $1,811 | $0.83 | 43d | 1 | 1.28mi |
| 5331 Greenwood Rd Horn Lake, MS | 4.0 | 2.0 | 1774 | $1,970 | $1.11 | 11d | 1 | 1.45mi |
HOA detail
- Monthly dues
- $25 · $300/yr
Listing history 10 events
-
2026-06-18days on market $312,900 Active 15 DOM
-
2026-06-17days on market $312,900 Active 14 DOM
-
2026-06-16days on market $312,900 Active 13 DOM
-
2026-06-15days on market $312,900 Active 12 DOM
-
2026-06-13days on market $312,900 Active 10 DOM
-
2026-06-10days on market $312,900 Active 7 DOM
-
2026-06-09days on market $312,900 Active 6 DOM
-
2026-06-08days on market $312,900 Active 5 DOM
-
2026-06-07remarks 699-char remark
-
2026-06-07$312,900 Active 4 DOM
ⓘ Source: listings_history table (triggers on properties + properties_extension) + one-shot
backfill from property_details.listing_events for pre-trigger history.
Nearby sold comps map
Loading sold comps map…
Walkable amenities ~0.75 mi
Loading nearby amenities…
Taxation est. · year 1
- Rental income
- $24,375
- − Mortgage interest
- −$17,306
- − Property taxes
- −$4,634
- − Insurance
- −$1,545
- − Repairs & maintenance
- −$1,950
- − Management
- −$1,950
- − HOA
- −$300
- − Depreciation
- −$8,988
- Taxable loss
- −$12,298
- Est. tax savings @ 24.0%
- +$2,952
- After-tax cash flow
- $-3,714/yr
For passive investors: Depreciation is non-cash, so a rental often shows a tax loss while cash-flowing — sheltering income. Rental losses are passive: they offset passive income freely, and up to $25,000/yr can offset ordinary (W-2) income if you actively participate and your MAGI is under $100k (phasing out to $0 by $150k); unused losses carry forward. On sale, claimed depreciation is recaptured at up to 25%, and gains may owe capital-gains tax (a 1031 exchange can defer both). Figures are a year-1 estimate at your 24.0% rate — not tax advice; consult a CPA.
Schools (NCES district)
- District
- Desoto County School District
- NCES district ID
- 2801320
- Math proficiency
- 48% ▼ -13.00%
- Reading proficiency
- 42% ▼ -6.00%
- Median HH income
- $59,272
- Composite
- 39.56/100
- National rank
- #3933
- State rank
- #20 of 130 in MS
Livability — Lynchburg
- Score
- 63/100
- State rank
- #145
- US rank
- #14967
Category grades
Schools grade is shown separately in the Schools card above.
Census & demographics
- Census place
- Lynchburg, MS
- County
- DeSoto County · 176,513 people
- City population
- 9,171
- Metro
- Memphis, TN-MS-AR
- Population (ZIP)
- 6,839
- Household income
- $59,503
- Rent vs Own
- Severe rent burden
- 229.0
Population outlook (DeSoto County) Hauer SSP2
- Today (2025)
- 203,338 people
- By 2030
- 217,692 · +7.1%
- By 2040
- 245,320 · +20.6%
- By 2050
- 270,133 · +32.8%
- By 2075
- 323,341 · +59.0%
- By 2100
- 348,742 · +71.5%
Race, ethnicity, and origin ACS 2023
- Neighborhood character
- Diverse neighborhood (Simpson 0.60)
- Race & ethnicity
- Black 46% White 42% Hispanic / Latino 8% Two or more races 3% Native American 1% Asian 1%
- Hispanic origin (detail)
- Mexican 6%
- Common ancestry
- Romanian 1% Serbian 1% British 1%
- Foreign-born
- 4% · Canada
- Languages at home
- 93% English-only · Spanish 6%
Political lean MEDSL · DeSoto
- 2024 margin
- Strong R (+24.1) · D 36.7% · R 60.8% · Other 2.5%
- 2008→2024 swing
- +14.2pp toward D · 2008: -38.2pp · 2024: -24.1pp
- All cycles
- 2024: R+24.1 2020: R+23.9 2016: R+34.8 2012: R+33.5 2008: R+38.2
Not yet ingested
- Civics
- —
Market trends
- HPI YoY
- ▲ 10.29%
- Current HPI
- 232.28
- Rent YoY
- —
- Metro
- Memphis, TN-MS-AR
- State GDP YoY
- —
- F500 in state
- 0
Price history
1 event — show timeline
- 2026-06-03 Listed $312,900 MLSU
Cash-flow waterfall
monthlySold comps — $/sqft
last 12 mo · ≤1 miLoading sold comps…