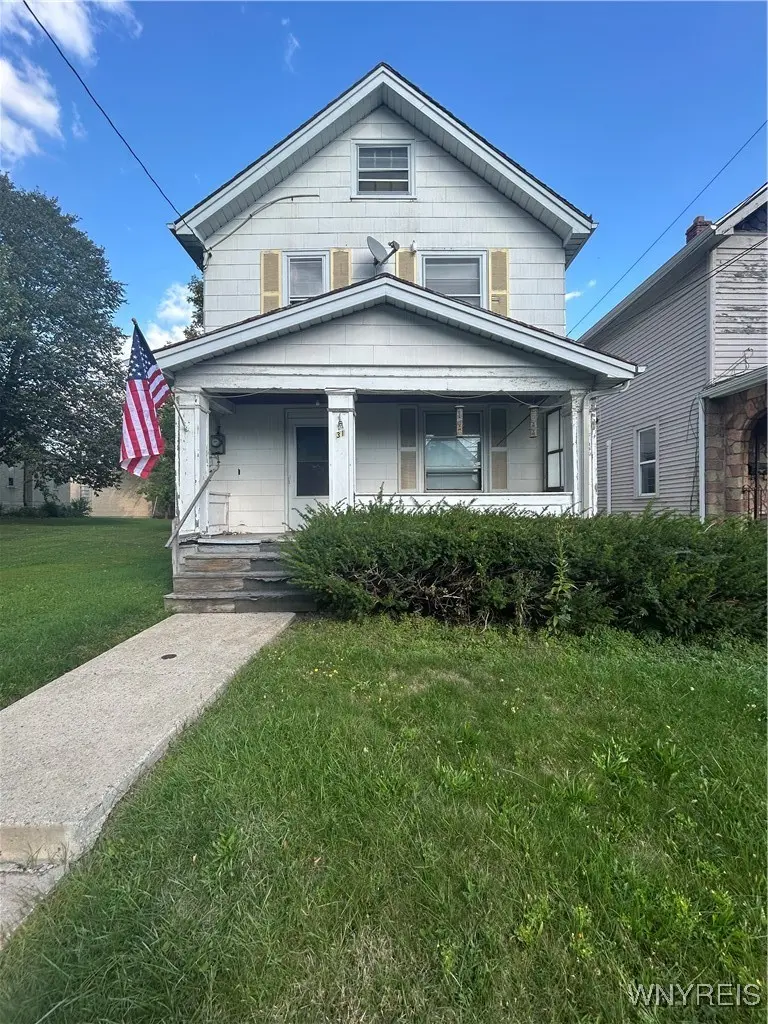
31 Ideal St · Buffalo, NY
Flood risk 4/10 · Minor
- FEMA flood zone
- X (unshaded)
- Chance of flooding over 30 yrs
- 0.24%
- Est. flood insurance / yr
- $507 – $1,088
Fire risk 1/10 · Minimal
- Est. fire insurance / yr
- $691 – $1,283
Heat risk 3/10 · Minor
- Hot days now (above 92°F)
- 7 days/yr
- Hot days in 30 yrs
- 15 days/yr
Wind risk 1/10 · Minimal
- Chance of severe wind over 30 yrs
- —
Air-quality risk 3/10 · Minor
- Unhealthy air days now
- 2 days/yr
- Unhealthy air days in 30 yrs
- 3 days/yr
Risk factors via First Street. Map © Google.
Why this score? — see what drove the A grade
The composite is a weighted blend of 9 inputs, each scored 0–100. Each bar is that input's sub-score; the figure is the points it added to the 100-point composite (weight × sub-score).
- Cash flow +30.0/30.0
- ARV discount +15.0/15.0
- 1% rule +10.0/10.0
- DSCR +10.0/10.0
- Appreciation +9.0/10.0
- Livability +3.9/5.0
- Schools +3.3/10.0
- Rent growth +2.5/5.0
- Condition / age +2.5/5.0
$99,900
🖨 Deal sheet 📄 Offer letter ✓ Due diligence
Listing remarks MLS
This 4BR/2BA multi-family home with a laundry room in each unit is an ideal investment opportunity! Located near major development areas including the Niagara Street corridor, D'Youville University and minutes from Downtown Buffalo this property offers strong upside for investors seeking value-add potential on Buffalo’s West Side.
Key facts
- Value-add potential
- Multi-family home
- 4,020 sq ft lot
Tags
Neighborhood map
What this means for you Summary
Snapshot
- This is a 4-bed/1.5-bath single-family listed at $100k.
Deal economics
- At list price, monthly cash flow is $626 ($8k/yr) — positive.
- The deal already cash-flows at list — no discount required.
- Meets the 1% rule at list price ($2k rent vs $100k).
- Cap rate 13.8% vs local median 8.0% in Buffalo — top-decile yield for the area; either an underpriced asset or a hidden risk that comps aren't pricing in. Stress-test before assuming the spread holds.
Location & tenants
- Location reads 77/100 on livability (#195 in NY, #3,011 nationally) — a middle-class / working-renter tenant base. Strengths: commute A+, housing A+, health & safety A+; Watch: crime F, employment D-.
- Buffalo City School District (urban): math 41% / reading 40% proficiency, ranked #535 of 590 in NY (top 91%) — families likely to look elsewhere, expect single-tenant / working-renter base with shorter leases; 75% free/reduced lunch — lower-income household profile, screen leases tightly.
- Market conditions: 169 active listings in the ZIP; 4 comparable units currently listed for rent nearby; rentals at typical pace (median 24d on market — plan ~3-4 weeks tenant-placement turnaround); 1,244 units permitted in Erie County in 2024 (563 in 5+ unit buildings).
- This rent runs 37% of the median local income ($50k/yr) — at the standard rent-burdened threshold; future hikes will face affordability resistance.
Forward outlook
- In year one you build about $9k of equity ($691 loan paydown + $8k appreciation (8.1% local appreciation)).
- At projected returns (8.1% appreciation + 3.0% rent growth), your $28k cash investment doubles in ~2 years — after that, you're playing with house money.
- By year 4, paydown + projected appreciation supports a ~$30k cash-out refi (75% LTV) — recoverable capital for the next deal without selling this one.
Negotiation context
- Only 10 days on market — expect competitive offers; lowballing is unlikely to land.
- 2 sale attempts since 10y ago; this cycle's ask has dropped $20k (17%) from the opening price — seller is motivated, your offer sets the floor, not the list.
- Current owner paid $40k; list at $100k implies a 150% gain — meaningful room to come down on a strong offer.
Risks & watch-outs
- Watch-outs: built in 1920 — expect roof / HVAC / electrical / plumbing capex.
Questions for the listing agent
- Built in 1920 — when were the roof, HVAC, electrical panel, plumbing, and water heater last replaced?
- Is there a deadline driving the sale (1031 exchange, divorce, estate, relocation)? That informs how much negotiation room exists.
- Crime grade is F in this area — have there been break-ins, vandalism, or insurance claims at this property in the last 3 years? What carrier currently insures it and at what premium?
- What's the average days-on-market for RENTAL listings here right now (not sales)? A rising rental-DOM trend means longer vacancies and softer asking-rent achievability than the comps imply.
- What's the recent tenant-quality profile in this submarket — average credit score on applications, eviction rate, late-payment / NSF rate, and stable-employment percentage? A property-management company in the area should have these aggregated.
- How much new for-sale + rental construction is in the pipeline within 1–3 miles? Heavy new supply typically softens prices + rents 12–24 months out; constrained supply supports both.
Investment metrics
- 1% rule
- 1.54% ✓
- Cap rate
- 13.81%
- Cash-on-cash
- 26.85%
- DSCR
- 2.19
- GRM
- 5.4
CMA / ARV
- ARV (median comp)
- $156,492
- List price
- $99,900
- Delta
- -29.71%
- Verdict
- UNDERPRICED
- Comps
- 20 within 1.0 mi
Show comp detail 12 sales within ~0.75 mi
| Address | Dist | Beds/Ba | Sqft | Sold | Price | $/sf | Match |
|---|---|---|---|---|---|---|---|
| 146 Longnecker St | 0.23mi | 4/1.0 | 1,460 (-1%) | 9mo | $160,400 | $110 | 79 |
| 57 N Ogden St | 0.27mi | 3/2.0 (-1) | 1,350 (-8%) | 1mo | $120,000 | $89 | 66 |
| 107 Stanley St | 0.46mi | 4/1.0 | 1,401 (-5%) | 7mo | $190,000 | $136 | 63 |
| 138 Wagner Ave | 0.59mi | 4/2.0 | 1,487 (+1%) | 7mo | $220,000 | $148 | 62 |
| 43 Ludington St | 0.28mi | 3/2.0 (-1) | 1,364 (-7%) | 8mo | $90,000 | $66 | 62 |
| 129 Schiller St | 0.38mi | 4/1.0 | 1,328 (-10%) | 7mo | $179,900 | $135 | 58 |
| 231 N Pleasant Pkwy | 0.71mi | 4/1.0 | 1,512 (+3%) | 8mo | $155,000 | $103 | 54 |
| 226 Davey St | 0.40mi | 4/2.0 | 1,314 (-11%) | 10mo | $213,000 | $162 | 54 |
| 580 S Ogden St Unit W | 0.65mi | 4/1.0 | 1,362 (-7%) | 3mo | $145,800 | $107 | 53 |
| 136 Benzinger St | 0.20mi | 3/1.0 (-1) | 1,266 (-14%) | 10mo | $140,000 | $111 | 52 |
| 307 Benzinger St | 0.53mi | 3/3.0 (-1) | 1,363 (-7%) | 2mo | $247,000 | $181 | 51 |
| 16 Regent St | 0.51mi | 3/1.0 (-1) | 1,604 (+9%) | 8mo | $115,000 | $72 | 47 |
Match score weights: distance 35% · size 25% · config 20% · recency 20%. Top-matched comps best support the ARV.
Projected returns pro-forma
8.06% appreciation · 3.0% rent growth · sell at horizon
- IRR
- 41.4%
- Equity multiple
- 3.91×
- Total profit
- $81,345
- Equity at exit
- $76,294
- IRR
- 37.0%
- Equity multiple
- 8.38×
- Total profit
- $206,337
- Equity at exit
- $151,823
Cash invested: $27,972 (down + closing). Projections, not guarantees.
Landlord ↔ Tenant lean methodology
- Overall (STATE)
- 15 Strongly Tenant-Friendly
- State New York
- 15 Strongly Tenant-Friendly · D+10
- County
- — inherits STATE
- City
- — inherits STATE
ZIP-level market 14206
- Home prices YoY
- 1.8%
- Active inventory
- 169
- Price-to-rent
- 5.4×
Monthly cashflow live
- Estimated rent
- $1,539 medium interval (Pro) →
- Mortgage (P&I)
- −$524
- Tax from tax record
- −$24 /mo · $291/yr
- Insurance
- −$42
- HOA
- −$0
- Vacancy / Maint / Mgmt
- −$323
- Net cashflow
- $626
Break-even live
UW: 25.0% down · 7.5% · 30yr · 1.5% tax · 5.0% vac · 8.0% maint · 8.0% mgmt
Financing live
Cash to close
- Down payment
- $24,975
- Closing costs
- $2,997
- Reserves months
- —
- Total cash needed
- —
Loan-product check · same deal, 3 products live
Conventional
25% down · 7.5% · 30yr
- Down + closing
- —
- Monthly P&I
- —
- Monthly cashflow
- —
- DSCR
- —
- Eligible?
- —
Personal DTI + credit; lowest rate.
DSCR
20% down · 8.5% · 30yr
- Down + closing
- —
- Monthly P&I
- —
- Monthly cashflow
- —
- DSCR
- —
- Eligible?
- —
No personal income docs; deal must DSCR.
Hard money
10% down · 12.0% · 12mo
- Down + closing
- —
- Monthly P&I
- —
- Monthly cashflow
- —
- DSCR
- —
- Eligible?
- —
Short-term bridge; refi at stabilization.
Rent comps 4 comps
| Address | Beds | Baths | Sqft | Rent | $/sqft | DOM | Units | Dist |
|---|---|---|---|---|---|---|---|---|
| 1150 Bailey Ave Buffalo, NY | 4.0 | 1.5 | 1100 | $1,200 | $1.09 | 23d | 1 | 0.38mi |
| 1777 Broadway Unit 2 Buffalo, NY | 3.0 | 1.0 | 1300 | $1,200 | $0.92 | 44d | 1 | 0.79mi |
| 14 Rutland Ave Buffalo, NY | 4.0 | 1.0 | 1430 | $2,200 | $1.54 | 10d | 1 | 1.26mi |
| 979 Walden Ave Buffalo, NY | 4.0 | 3.0 | 1793 | $2,000 | $1.12 | 1d | 1 | 1.47mi |
Listing history 19 events
-
2026-06-18days on market $99,900 Active 10 DOM
-
2026-06-17days on market $99,900 Active 9 DOM
-
2026-06-16days on market $99,900 Active 8 DOM
-
2026-06-15days on market $99,900 Active 7 DOM
-
2026-06-13days on market $99,900 Active 5 DOM
-
2026-06-13days on market $99,900 Active 4 DOM
-
2026-06-10days on market $99,900 Active 2 DOM
-
2026-06-08remarks 378-char remark
-
2026-06-08pricedays on market $99,900 Active 1 DOM
-
2026-06-03days on market $109,999 Active 183 DOM
-
2026-06-02days on market $109,999 Active 182 DOM
-
2026-06-01days on market $109,999 Active 181 DOM
-
2026-05-31days on market $109,999 Active 180 DOM
-
2026-04-22price $109,999 339-char remark
Show marketing remark (339 chars)
This 4BR/2BA multi-family home with a laundry room in each unit is an ideal investment opportunity! Located near major development areas including the Niagara Street corridor, D'Youville University and minutes from Downtown Buffalo this property offers strong upside for investors seeking value-add potential on Buffalo’s West Side.
-
2026-02-04price $119,999 339-char remark
Show marketing remark (339 chars)
This 4BR/2BA multi-family home with a laundry room in each unit is an ideal investment opportunity! Located near major development areas including the Niagara Street corridor, D'Youville University and minutes from Downtown Buffalo this property offers strong upside for investors seeking value-add potential on Buffalo’s West Side.
-
2025-12-02$120,000 Active 339-char remark
Show marketing remark (339 chars)
This 4BR/2BA multi-family home with a laundry room in each unit is an ideal investment opportunity! Located near major development areas including the Niagara Street corridor, D'Youville University and minutes from Downtown Buffalo this property offers strong upside for investors seeking value-add potential on Buffalo’s West Side.
-
2016-11-23soldstatus $40,000 Closed Sale or Rented 254-char remark
Show marketing remark (254 chars)
Church-owned two-family property with long-term tenants being sold as is. Each spacious apartment has its own private laundry room and private entrance. Nice sized backyard. One furnace & one electric service: Tenants divide bills and pay 1/2 each.
-
2016-09-13status Pending Sale 254-char remark
Show marketing remark (254 chars)
Church-owned two-family property with long-term tenants being sold as is. Each spacious apartment has its own private laundry room and private entrance. Nice sized backyard. One furnace & one electric service: Tenants divide bills and pay 1/2 each.
-
2016-08-19$46,000 Active 254-char remark
Show marketing remark (254 chars)
Church-owned two-family property with long-term tenants being sold as is. Each spacious apartment has its own private laundry room and private entrance. Nice sized backyard. One furnace & one electric service: Tenants divide bills and pay 1/2 each.
ⓘ Source: listings_history table (triggers on properties + properties_extension) + one-shot
backfill from property_details.listing_events for pre-trigger history.
Tax reassessment forecast NY · Partial reset (capped growth)
- Current annual tax
- $291 · $24/mo
- Projected year-2 tax
- $990 · $82/mo
- Expected delta
- +$698/yr (+$58/mo · 239.6%)
ⓘ Screening estimate from a state-policy table — verify with the county assessor before closing.
Climate risk First Street
- Flood 4/10 Moderate FEMA zone X (unshaded) · 24% chance over 30 yrs
- Wildfire 1/10 Low
- Heat 3/10 Moderate 7 d/yr ≥92°F today · 15 d/yr by 30 yrs out
- Wind 1/10 Low
- Air quality 3/10 Moderate 2 unhealthy d/yr today · 3 by 30 yrs out
Nearby sold comps map
Loading sold comps map…
Walkable amenities ~0.75 mi
Loading nearby amenities…
Taxation est. · year 1
- Rental income
- $18,465
- − Mortgage interest
- −$5,596
- − Property taxes
- −$291
- − Insurance
- −$500
- − Repairs & maintenance
- −$1,477
- − Management
- −$1,477
- − Depreciation
- −$2,906
- Taxable income
- $6,217
- Est. tax owed @ 24.0%
- −$1,492
- After-tax cash flow
- $6,017/yr
For passive investors: Depreciation is non-cash, so a rental often shows a tax loss while cash-flowing — sheltering income. Rental losses are passive: they offset passive income freely, and up to $25,000/yr can offset ordinary (W-2) income if you actively participate and your MAGI is under $100k (phasing out to $0 by $150k); unused losses carry forward. On sale, claimed depreciation is recaptured at up to 25%, and gains may owe capital-gains tax (a 1031 exchange can defer both). Figures are a year-1 estimate at your 24.0% rate — not tax advice; consult a CPA.
Schools (NCES district)
- District
- Buffalo City School District
- NCES district ID
- 3605850
- Math proficiency
- 41% ▲ 11.00%
- Reading proficiency
- 40% ▲ 7.00%
- Median HH income
- $31,665
- Composite
- 33.17/100
- National rank
- #5544
- State rank
- #535 of 590 in NY
Livability — Buffalo
- Score
- 77/100
- State rank
- #195
- US rank
- #3011
Category grades
Schools grade is shown separately in the Schools card above.
Census & demographics
- Census place
- Buffalo, NY
- County
- Erie County · 714,559 people
- City population
- 440,021
- Metro
- Buffalo-Cheektowaga, NY
- Population (ZIP)
- 21,631
- Household income
- $50,450
- Rent vs Own
- Severe rent burden
- 841.0
Population outlook (Erie County) Hauer SSP2
- Today (2025)
- 933,037 people
- By 2030
- 935,181 · +0.2%
- By 2040
- 928,531 · -0.5%
- By 2050
- 905,725 · -2.9%
- By 2075
- 834,037 · -10.6%
- By 2100
- 708,033 · -24.1%
Race, ethnicity, and origin ACS 2023
- Neighborhood character
- Majority White (65%)
- Race & ethnicity
- White 65% Hispanic / Latino 13% Black 12% Two or more races 8% Asian 4%
- Hispanic origin (detail)
- Mexican 2% Puerto Rican 10%
- Common ancestry
- Romanian 25% Lithuanian 1% Italian 1%
- Foreign-born
- 6% · Canada, China
- Languages at home
- 88% English-only · Spanish 5% Other Indo-European 3% Arabic 2%
Political lean MEDSL · Erie
- 2024 margin
- Lean D (+9.7) · D 54.8% · R 45.2%
- 2008→2024 swing
- -7.9pp toward R · 2008: 17.5pp · 2024: 9.7pp
- All cycles
- 2024: D+9.7 2020: D+14.7 2016: D+4.8 2012: D+15.6 2008: D+17.5
Not yet ingested
- Civics
- —
Market trends
- HPI YoY
- ▲ 8.06%
- Current HPI
- 457.3935
- Rent YoY
- —
- Metro
- Buffalo-Cheektowaga, NY
- State GDP YoY
- ▲ 2.60%
- F500 in state
- 92
Industry mix (Fortune 500 HQ in NY)
| Industry | F500 HQs | Revenue |
|---|---|---|
| Financial Services | 10 | $950B |
|
||
| Consumer Goods | 9 | $162B |
|
||
| Insurance | 4 | $225B |
|
||
| Telecommunications | 2 | $144B |
|
||
| Pharmaceuticals | 2 | $112B |
|
||
| Media / Entertainment | 2 | $69B |
|
||
Price history
+139.1% since first listed6 events — show timeline
- 2026-04-22 Price Changed $109,999 WNYREIS
- 2026-02-04 Price Changed $119,999 WNYREIS
- 2025-12-02 Listed $120,000 WNYREIS
- 2016-11-23 Sold (MLS) $40,000 WNYREIS
- 2016-09-13 Pending — WNYREIS
- 2016-08-19 Listed $46,000 WNYREIS
Property tax history
+1.2%/yrLatest (2025): $291 · +0.0% YoY. Source: county tax records.
Cash-flow waterfall
monthlySold comps — $/sqft
last 12 mo · ≤1 miLoading sold comps…