3975 Torsby Pl · Paradise, NV
Flood risk 1/10 · Minimal
- FEMA flood zone
- X (unshaded)
- Chance of flooding over 30 yrs
- 0.0%
- Est. flood insurance / yr
- $507 – $1,088
Fire risk 1/10 · Minimal
- Est. fire insurance / yr
- $490 – $910
Heat risk 8/10 · Major
- Hot days now (above 106°F)
- 7 days/yr
- Hot days in 30 yrs
- 17 days/yr
Wind risk 1/10 · Minimal
- Chance of severe wind over 30 yrs
- —
Air-quality risk 3/10 · Minor
- Unhealthy air days now
- 3 days/yr
- Unhealthy air days in 30 yrs
- 4 days/yr
Risk factors via First Street. Map © Google.
Why this score? — see what drove the D+ grade
The composite is a weighted blend of 9 inputs, each scored 0–100. Each bar is that input's sub-score; the figure is the points it added to the 100-point composite (weight × sub-score).
- Cash flow +18.7/30.0
- ARV discount +7.5/15.0
- 1% rule +6.7/10.0
- DSCR +5.9/10.0
- Livability +3.8/5.0
- Schools +2.6/10.0
- Condition / age +2.5/5.0
- Rent growth +2.0/5.0
- Appreciation +0.0/10.0
$170,000
🖨 Deal sheet (PDF) 📄 Offer letter ✓ Due diligence
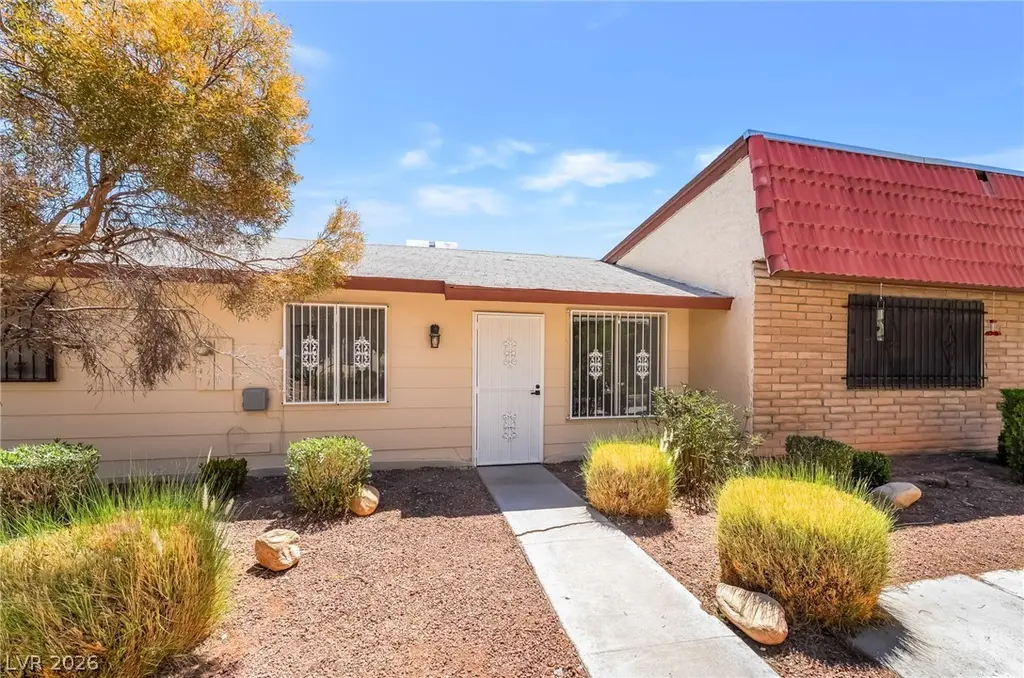
Listing remarks
Discover a charming oasis in Las Vegas, where comfort and practicality converge in a single-story residence. This delightful home, featuring two bedrooms and one bathroom across 772 square feet, offers a serene living experience. The exterior showcases a harmonious blend of brick and wood siding, topped with an appealing red tile roof, complemented by low-maintenance desert landscaping. The property features unique security window bars, adding both character and peace of mind. A private courtyard, accessible via a decorative wrought iron gate and block retaining wall, provides an intimate outdoor sanctuary for relaxation. The inviting entryway, adorned with durable wood-look flooring, leads
Key facts
- Red tile roof
- Block retaining wall
- Private courtyard
Tags
Property features AI
Finance
- HOA & community: Homeowners association (monthly fee); HOA includes association management; Community amenities: clubhouse, dog park, barbecue, community pool; Community pool
Exterior
- Parking: Assigned parking; Guest parking; One assigned space
- Utilities: Above ground utilities; Public water; Public sewer; No photovoltaics
- Home design: Single-family property; One story; Resale; Faces east; Attached to another property
- Construction: Drywall construction; Composition/shingle roof
- Exterior features: Covered patio; Private yard; Desert landscaping; Landscaped; Less than quarter acre lot
Interior
- Kitchen: Custom cabinets; Laminate countertops; Gas range; Microwave; Man-made wood or laminate flooring in kitchen
- Bedrooms: Two possible bedrooms; Bedroom (12 x 12) with ceiling fan; Bedroom (12 x 12) with ceiling fan and walk-in closet
- Flooring: Hardwood flooring; Laminate flooring
- Bathrooms: One full bathroom; Tub/shower combo
- Heating & cooling: Central heating (gas); Central electric air conditioning
- Interior features: Blinds and window treatments; Unfurnished
- Laundry & utility: Electric dryer hookup; Gas dryer hookup; Laundry closet
Neighborhood map
What this means for you Summary
Snapshot
- This is a 2-bed/1.0-bath townhouse listed at $170k.
Deal economics
- At list price, monthly cash flow is $168 ($2k/yr) — positive.
- The deal already cash-flows at list — no discount required.
- Meets the 1% rule at list price ($2k rent vs $170k).
Location & tenants
- Location reads 76/100 on livability (#10 in NV, #3,494 nationally) — a middle-class / working-renter tenant base. Strengths: commute A+, housing A-, cost of living B; Watch: employment D+, schools F, crime D-.
- Clark County School District (urban): math 21% / reading 39% proficiency, ranked #11 of 17 in NV (top 65%) — families likely to look elsewhere, expect single-tenant / working-renter base with shorter leases.
- Market conditions: Rents soft (-1.8%/yr); 199 active listings in the ZIP; 29 comparable units currently listed for rent nearby; rentals lingering (median 44d on market — plan ~5-8 weeks vacancy on turnover, expect pricing pressure); 66% of comp listings sitting > 30 days — soft ceiling on asking rent; 14,754 units permitted in Clark County in 2024 (2,301 in 5+ unit buildings).
- At $1,984/mo this rent would consume 51% of the median local household income ($47k/yr) (locally 4678% of renters already pay >50% of income on rent) — very limited rent-growth headroom before tenants either downsize or default.
Forward outlook
- Local home prices are declining (-3.0%/yr); year-one equity from $1k of loan paydown is wiped out by about $5k of value loss. Plan a longer hold.
- Clark County population projected at +36% by 2050 — long-run rental-demand tailwind backs the buy-and-hold thesis.
Negotiation context
- Only 6 days on market — expect competitive offers; lowballing is unlikely to land.
- Current owner paid $80k; list at $170k implies a 112% gain — meaningful room to come down on a strong offer.
Risks & watch-outs
- Watch-outs: HOA is 20% of rent.
- Climate carrying-cost: extreme-heat days projected 7→17/yr by 2055 (HVAC capex compounding) — expect insurance premiums to compound above CPI over the hold.
Questions for the listing agent
- Built in 1973 — when were the roof, HVAC, electrical panel, plumbing, and water heater last replaced?
- What does the HOA fee cover, when was the last increase, and are there any pending special assessments or reserve-fund shortfalls?
- Is there a deadline driving the sale (1031 exchange, divorce, estate, relocation)? That informs how much negotiation room exists.
- Schools are F-rated, which usually means shorter tenancies and higher turnover. Who's the typical renter profile here, and what's been the actual vacancy rate?
- Crime grade is D in this area — have there been break-ins, vandalism, or insurance claims at this property in the last 3 years? What carrier currently insures it and at what premium?
- The area grade is low — what's the realistic commute time and amenity access for the typical tenant pool here? Any planned neighborhood developments (good or bad) we should know about?
- What's the average days-on-market for RENTAL listings here right now (not sales)? A rising rental-DOM trend means longer vacancies and softer asking-rent achievability than the comps imply.
- What's the recent tenant-quality profile in this submarket — average credit score on applications, eviction rate, late-payment / NSF rate, and stable-employment percentage? A property-management company in the area should have these aggregated.
- How much new for-sale + rental construction is in the pipeline within 1–3 miles? Heavy new supply typically softens prices + rents 12–24 months out; constrained supply supports both.
Investment metrics
- 1% rule
- 1.17% ✓
- Cap rate
- 7.48%
- Cash-on-cash
- 4.24%
- DSCR
- 1.19
- GRM
- 7.1
CMA / ARV
No comps found within radius.
Projected returns pro-forma
-3.0% appreciation · 0.0% rent growth · sell at horizon
- IRR
- -13.6%
- Equity multiple
- 0.53×
- Total profit
- $-22,472
- Equity at exit
- $25,348
- IRR
- -11.5%
- Equity multiple
- 0.42×
- Total profit
- $-27,549
- Equity at exit
- $14,698
Cash invested: $47,600 (down + closing). Projections, not guarantees.
Landlord ↔ Tenant lean methodology
- Overall (STATE)
- 71 Landlord-Friendly
- State Nevada
- 71 Landlord-Friendly · R+1
- County
- — inherits STATE
- City
- — inherits STATE
ZIP-level market 89119
- Rents YoY
- -1.8%
- Active inventory
- 199
- Price-to-rent
- 7.1×
Monthly cashflow live
- Estimated rent
- $1,984 high interval (Pro) →
- Mortgage (P&I)
- −$891
- Tax from tax record
- −$38 /mo · $461/yr
- Insurance
- −$71
- HOA
- −$398
- Vacancy / Maint / Mgmt
- −$417
- Net cashflow
- $168
Break-even live
Sensitivity live
| Price | -10% $265 | -5% $216 | +0% $168 | +5% $120 | +10% $72 |
|---|---|---|---|---|---|
| Rent | -10% $12 | -5% $90 | +0% $168 | +5% $247 | +10% $325 |
| Rate | -1.0pp $254 | -0.5pp $212 | base $168 | +0.5pp $124 | +1.0pp $79 |
UW: 25.0% down · 7.5% · 30yr · 1.5% tax · 5.0% vac · 8.0% maint · 8.0% mgmt
Financing live
Cash to close
- Down payment
- $42,500
- Closing costs
- $5,100
- Reserves months
- —
- Total cash needed
- —
Loan-product check · same deal, 3 products live
Conventional
25% down · 7.5% · 30yr
- Down + closing
- —
- Monthly P&I
- —
- Monthly cashflow
- —
- DSCR
- —
- Eligible?
- —
Personal DTI + credit; lowest rate.
DSCR
20% down · 8.5% · 30yr
- Down + closing
- —
- Monthly P&I
- —
- Monthly cashflow
- —
- DSCR
- —
- Eligible?
- —
No personal income docs; deal must DSCR.
Hard money
10% down · 12.0% · 12mo
- Down + closing
- —
- Monthly P&I
- —
- Monthly cashflow
- —
- DSCR
- —
- Eligible?
- —
Short-term bridge; refi at stabilization.
Rent comps 29 comps
| Address | Beds | Baths | Sqft | Rent | $/sqft | DOM | Units | Dist |
|---|---|---|---|---|---|---|---|---|
| 818 E Flamingo Rd Las Vegas, NV | 1.0–2.0 | 1.0–2.5 | 1158 | $2,895 | $2.50 | 3d | 34 | 0.19mi |
| 3930 University Center Dr Las Vegas, NV | 2.0 | 2.0–3.0 | 1200 | $1,725 | $1.44 | 44d | 2 | 0.26mi |
| 3930 Paradise Rd Las Vegas, NV | 3.0 | 1.0–2.0 | 999 | $2,805 | $2.81 | 3d | 87 | 0.26mi |
| 595 S Royal Crest Cir #18 Las Vegas, NV | 2.0 | 1.0 | 816 | $1,575 | $1.93 | 44d | 1 | 0.39mi |
| 3776 Howard Hughes Pkwy Las Vegas, NV | 3.0 | 1.0–2.5 | 1548 | $3,028 | $1.96 | 2d | 9 | 0.46mi |
| 1061 E Flamingo Rd Las Vegas, NV | 1.0–2.0 | 1.0–2.0 | 967 | $2,203 | $2.28 | 15d | 35 | 0.51mi |
| 3550 Paradise Rd Las Vegas, NV | 3.0 | 1.0–2.0 | 947 | $1,425 | $1.50 | 44d | 20 | 0.57mi |
| 270 E Flamingo Rd Las Vegas, NV | 1.0–2.0 | 1.0–2.0 | 877 | $2,100 | $2.39 | 44d | 7 | 0.68mi |
| 260 E Flamingo Rd Las Vegas, NV | 2.0 | 2.0 | 1018 | $2,372 | $2.33 | 24d | 2 | 0.68mi |
| 260 E Flamingo Rd Las Vegas, NV | 1.0–2.0 | 1.0–2.0 | 881 | $2,295 | $2.60 | 44d | 4 | 0.68mi |
| 260 E Flamingo Rd Las Vegas, NV | 2.0 | 2.0 | 1018 | $2,475 | $2.43 | 3d | 1 | 0.68mi |
| 230 E Flamingo Rd #335 Las Vegas, NV | 1.0 | 1.0 | 727 | $1,600 | $2.20 | 44d | 1 | 0.73mi |
| 220 E Flamingo Rd #229 Las Vegas, NV | 1.0 | 1.0 | 692 | $2,195 | $3.17 | 22d | 1 | 0.78mi |
| 220 E Flamingo Rd #229 Las Vegas, NV | 1.0 | 1.0 | 692 | $2,195 | $3.17 | 24d | 1 | 0.78mi |
| 220 E Flamingo Rd Las Vegas, NV | 1.0–2.0 | 1.0–2.0 | 863 | $2,195 | $2.54 | 44d | 7 | 0.79mi |
| 210 E Flamingo Rd Las Vegas, NV | 1.0–2.0 | 1.0–2.0 | 833 | $2,100 | $2.52 | 44d | 6 | 0.81mi |
| 900 E Desert Inn Rd Las Vegas, NV | 1.0–2.0 | 1.0–2.0 | 1077 | $1,800 | $1.67 | 44d | 5 | 0.95mi |
| 1601 E Katie Ave Las Vegas, NV | 1.0–2.0 | 1.0–2.0 | 809 | $1,852 | $2.29 | 44d | 13 | 0.99mi |
| 4674 Monterey Cir #1 Las Vegas, NV | 2.0 | 1.0 | 1000 | $1,750 | $1.75 | 44d | 1 | 1.01mi |
| 205 E Harmon Ave Las Vegas, NV | 1.0–2.0 | 1.5–2.0 | 1182 | $1,950 | $1.65 | 44d | 5 | 1.01mi |
| 1700 E Viking Rd Las Vegas, NV | 2.0 | 2.0 | 1085 | $1,662 | $1.53 | 44d | 3 | 1.06mi |
| 4700 S Maryland Pkwy Las Vegas, NV | 1.0 | 1.0 | 409 | $1,382 | $3.37 | 44d | 48 | 1.15mi |
| 350 E Desert Inn Rd Unit H203 Las Vegas, NV | 2.0 | 1.5 | 849 | $1,725 | $2.03 | 44d | 1 | 1.16mi |
| 145 E Harmon Ave Unit 1332448P Las Vegas, NV | 1.0 | 1.0 | 548 | $3,796 | $6.93 | 2d | 1 | 1.26mi |
| 1481 Lorilyn Ave #4 Las Vegas, NV | 1.0 | 1.0 | 792 | $1,835 | $2.32 | 44d | 1 | 1.30mi |
| 2831 Geary Pl #2909 Las Vegas, NV | 2.0 | 1.0 | 1112 | $1,899 | $1.71 | 44d | 1 | 1.42mi |
| 1577 Elizabeth Ave #1 Las Vegas, NV | 2.0 | 2.0 | 1064 | $1,600 | $1.50 | 44d | 1 | 1.44mi |
| 3700 Las Vegas Blvd S #672 Las Vegas, NV | 1.0 | 1.0 | 606 | $2,500 | $4.13 | 8d | 1 | 1.46mi |
| 4801 Spencer St Las Vegas, NV | 1.0–3.0 | 1.0–2.0 | 1072 | $1,548 | $1.44 | 44d | 14 | 1.47mi |
HOA detail
- Monthly dues
- $398 · $4,776/yr
- Likely covers
- gaslandscapingsecurity
Listing history 6 events
-
2026-06-18days on market $170,000 Active 6 DOM
-
2026-06-17days on market $170,000 Active 5 DOM
-
2026-06-16days on market $170,000 Active 4 DOM
-
2026-06-15days on market $170,000 Active 3 DOM
-
2026-06-13remarks 699-char remark
-
2026-06-13$170,000 Active 1 DOM
ⓘ Source: listings_history table (triggers on properties + properties_extension) + one-shot
backfill from property_details.listing_events for pre-trigger history.
Tax reassessment forecast NV · Resets to sale price
- Current annual tax
- $461 · $38/mo
- Projected year-2 tax
- $1,003 · $84/mo
- Expected delta
- +$542/yr (+$45/mo · 117.6%)
ⓘ Screening estimate from a state-policy table — verify with the county assessor before closing.
Climate risk First Street
- Flood 1/10 Low FEMA zone X (unshaded) · 0% chance over 30 yrs
- Wildfire 1/10 Low
- Heat 8/10 Severe 7 d/yr ≥106°F today · 17 d/yr by 30 yrs out
- Wind 1/10 Low
- Air quality 3/10 Moderate 3 unhealthy d/yr today · 4 by 30 yrs out
Nearby sold comps map
Loading sold comps map…
Walkable amenities ~0.75 mi
Loading nearby amenities…
Taxation est. · year 1
- Rental income
- $23,803
- − Mortgage interest
- −$9,523
- − Property taxes
- −$461
- − Insurance
- −$850
- − Repairs & maintenance
- −$1,904
- − Management
- −$1,904
- − HOA
- −$4,776
- − Depreciation
- −$4,945
- Taxable loss
- −$560
- Est. tax savings @ 24.0%
- +$134
- After-tax cash flow
- $2,154/yr
For passive investors: Depreciation is non-cash, so a rental often shows a tax loss while cash-flowing — sheltering income. Rental losses are passive: they offset passive income freely, and up to $25,000/yr can offset ordinary (W-2) income if you actively participate and your MAGI is under $100k (phasing out to $0 by $150k); unused losses carry forward. On sale, claimed depreciation is recaptured at up to 25%, and gains may owe capital-gains tax (a 1031 exchange can defer both). Figures are a year-1 estimate at your 24.0% rate — not tax advice; consult a CPA.
Schools (NCES district)
- District
- Clark County School District
- NCES district ID
- 3200060
- Math proficiency
- 21% ▼ -13.00%
- Reading proficiency
- 39% ▼ -8.00%
- Median HH income
- $53,611
- Composite
- 26.48/100
- National rank
- #7211
- State rank
- #11 of 17 in NV
Livability — Paradise
- Score
- 76/100
- State rank
- #10
- US rank
- #3494
Category grades
Schools grade is shown separately in the Schools card above.
Census & demographics
- Census place
- Paradise, NV
- County
- Clark County · 2,306,105 people
- City population
- 227,885
- Metro
- Las Vegas-Henderson-Paradise, NV
- Population (ZIP)
- 50,196
- Household income
- $46,960
- Rent vs Own
- Severe rent burden
- 4678.0
Population outlook (Clark County) Hauer SSP2
- Today (2025)
- 2,504,101 people
- By 2030
- 2,693,770 · +7.6%
- By 2040
- 3,061,208 · +22.2%
- By 2050
- 3,400,072 · +35.8%
- By 2075
- 4,139,522 · +65.3%
- By 2100
- 4,596,916 · +83.6%
Race, ethnicity, and origin ACS 2023
- Neighborhood character
- Highly diverse neighborhood (Simpson 0.74)
- Race & ethnicity
- Hispanic / Latino 38% White 29% Two or more races 18% Black 13% Asian 11%
- Hispanic origin (detail)
- Mexican 23% Puerto Rican 1% Cuban 4%
- Common ancestry
- Romanian 2% Lithuanian 1% Scotch-Irish 1%
- Foreign-born
- 31% · Canada, China, Jamaica
- Languages at home
- 57% English-only · Spanish 29% Tagalog/Filipino 6% Other Indo-European 3%
Political lean MEDSL · Clark
- 2024 margin
- Toss-up / Even · D 50.4% · R 47.8% · Other 1.7%
- 2008→2024 swing
- -16.5pp toward R · 2008: 19.1pp · 2024: 2.6pp
- All cycles
- 2024: D+2.6 2020: D+9.3 2016: D+10.7 2012: D+14.5 2008: D+19.1
Not yet ingested
- Civics
- —
Market trends
- HPI YoY
- ▼ -221.72%
- Current HPI
- 266.4892
- Rent YoY
- ▼ -1.81%
- Metro
- Las Vegas-Henderson-Paradise, NV
- State GDP YoY
- ▲ 3.08%
- F500 in state
- 6
Industry mix (Fortune 500 HQ in NV)
| Industry | F500 HQs | Revenue |
|---|---|---|
| Hotels / Casinos | 3 | $36B |
|
||
Price history
+54.5% since first listed4 events — show timeline
- 2026-06-12 Listed $170,000 GLVAR
- 2026-04-13 Sold (Public Records) $80,000 Public Records
- 2003-08-15 Sold (Public Records) $51,000 Public Records
- 1994-01-31 Sold (Public Records) $110,005 Public Records
Property tax history
-0.9%/yrLatest (2025): $461 · +7.3% YoY. Source: county tax records.
Cash-flow waterfall
monthlySold comps — $/sqft
last 12 mo · ≤1 miLoading sold comps…