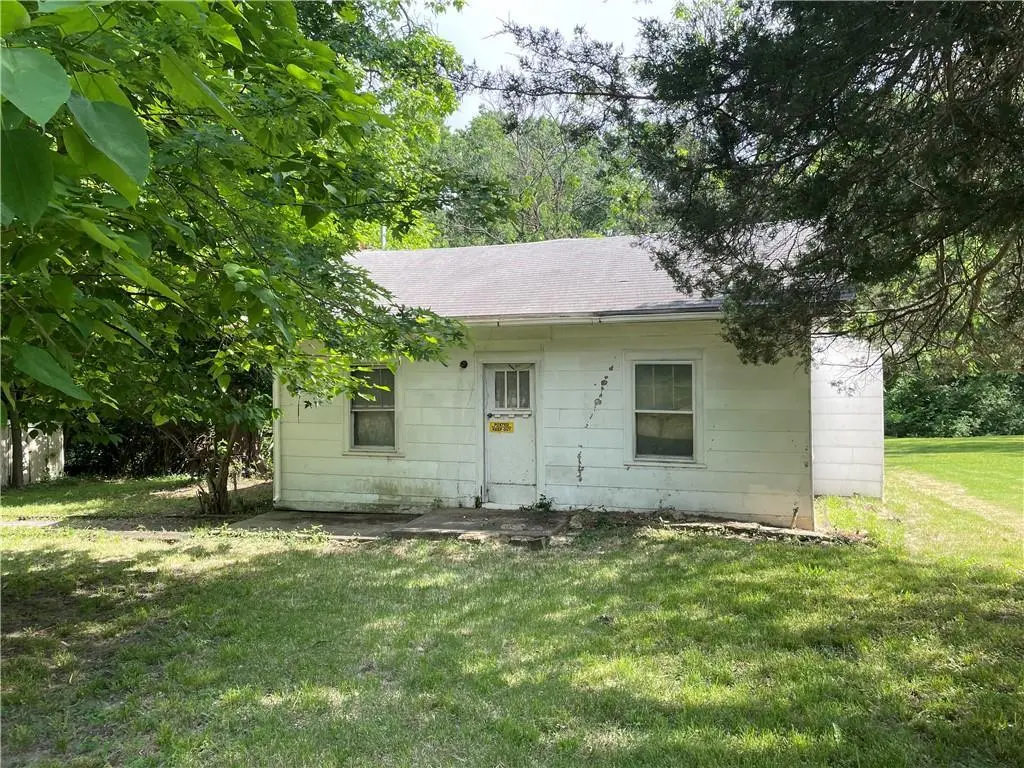
3627 NE 41st St · Kansas City, MO
Flood risk 1/10 · Minimal
- FEMA flood zone
- X (unshaded)
- Chance of flooding over 30 yrs
- 0.0%
- Est. flood insurance / yr
- $473 – $860
Fire risk 1/10 · Minimal
- Est. fire insurance / yr
- $1,054 – $1,958
Heat risk 4/10 · Minor
- Hot days now (above 108°F)
- 7 days/yr
- Hot days in 30 yrs
- 17 days/yr
Wind risk 2/10 · Minimal
- Chance of severe wind over 30 yrs
- —
Air-quality risk 3/10 · Minor
- Unhealthy air days now
- 2 days/yr
- Unhealthy air days in 30 yrs
- 3 days/yr
Risk factors via First Street. Map © Google.
Why this score? — see what drove the B grade
The composite is a weighted blend of 9 inputs, each scored 0–100. Each bar is that input's sub-score; the figure is the points it added to the 100-point composite (weight × sub-score).
- Cash flow +30.0/30.0
- 1% rule +10.0/10.0
- DSCR +10.0/10.0
- ARV discount +7.5/15.0
- Livability +3.9/5.0
- Schools +3.8/10.0
- Rent growth +2.6/5.0
- Condition / age +2.5/5.0
- Appreciation +0.0/10.0
$69,900
🖨 Deal sheet 📄 Offer letter ✓ Due diligence
Listing remarks
Investors! This is the one! Come see this beautiful treed private almost half acre lot (. 48 approximately). There is a house and unattached garage on the property. The house & garage are tear downs or total rebuilds. Sold as is and no contingencies. Great investment property. Great location!
Key facts
- 0.48 acre lot
- Garage
- Built 1950
Property features AI
Exterior
- Parking: Detached 1-car garage
- Utilities: City/public water (verify); Public sewer
- Home design: Single family residence; Residential property type; Ranch style; Approximately 900 above-grade living area
- Construction: Board & batten siding; Composition roof; Has basement
- Exterior features: City lot; Wooded lot
Interior
- Bedrooms: 2 bedrooms
- Bathrooms: 1 full bathroom
- Heating & cooling: Other heating; No central cooling
- Interior features: Ranch floor plan; Cellar; Other basement features
Neighborhood map
What this means for you Summary
Snapshot
- This is a 2-bed/1.0-bath single-family listed at $70k.
Deal economics
- At list price, monthly cash flow is $450 ($5k/yr) — positive.
- The deal already cash-flows at list — no discount required.
- Meets the 1% rule at list price ($1k rent vs $70k).
- Cap rate 14.0% vs local median 3.9% in Kansas City — top-decile yield for the area; either an underpriced asset or a hidden risk that comps aren't pricing in. Stress-test before assuming the spread holds.
Location & tenants
- Location reads 78/100 on livability (#28 in MO, #2,671 nationally) — a middle-class / working-renter tenant base. Strengths: amenities A+, commute A+, cost of living A+; Watch: schools C-, crime F.
- North Kansas City 74 (urban): math 38% / reading 49% proficiency, ranked #98 of 324 in MO (top 30%) — families likely to look elsewhere, expect single-tenant / working-renter base with shorter leases.
- Market conditions: Rents flat; 50 active listings in the ZIP; 12 comparable units currently listed for rent nearby; rentals at typical pace (median 21d on market — plan ~3-4 weeks tenant-placement turnaround); 341 units permitted in Clay County in 2024 (40 in 5+ unit buildings).
Forward outlook
- Local home prices are declining (-3.0%/yr); year-one equity from $483 of loan paydown is wiped out by about $2k of value loss. Plan a longer hold.
- Clay County population projected at +24% by 2050 — long-run rental-demand tailwind backs the buy-and-hold thesis.
- At projected returns (-3.0% appreciation + 0.5% rent growth), your $20k cash investment doubles in ~5 years — after that, you're playing with house money.
Negotiation context
- Only 13 days on market — expect competitive offers; lowballing is unlikely to land.
Risks & watch-outs
- Watch-outs: built in 1950 — expect roof / HVAC / electrical / plumbing capex.
Questions for the listing agent
- Built in 1950 — when were the roof, HVAC, electrical panel, plumbing, and water heater last replaced?
- Is there a deadline driving the sale (1031 exchange, divorce, estate, relocation)? That informs how much negotiation room exists.
- Crime grade is F in this area — have there been break-ins, vandalism, or insurance claims at this property in the last 3 years? What carrier currently insures it and at what premium?
- What's the average days-on-market for RENTAL listings here right now (not sales)? A rising rental-DOM trend means longer vacancies and softer asking-rent achievability than the comps imply.
- What's the recent tenant-quality profile in this submarket — average credit score on applications, eviction rate, late-payment / NSF rate, and stable-employment percentage? A property-management company in the area should have these aggregated.
- How much new for-sale + rental construction is in the pipeline within 1–3 miles? Heavy new supply typically softens prices + rents 12–24 months out; constrained supply supports both.
Investment metrics
- 1% rule
- 1.74% ✓
- Cap rate
- 14.02%
- Cash-on-cash
- 27.59%
- DSCR
- 2.23
- GRM
- 4.8
CMA / ARV
- ARV (on-the-fly)
- $184,416
- Comps found
- 12
Show comp detail 12 sales within ~0.75 mi
| Address | Dist | Beds/Ba | Sqft | Sold | Price | $/sf | Match |
|---|---|---|---|---|---|---|---|
| 4420 N Jackson Ave | 0.52mi | 2/1.0 | 912 (+1%) | 2mo | $164,950 | $181 | 73 |
| 4013 NE Chaumiere Rd | 0.18mi | 2/1.0 | 1,012 (+12%) | 6mo | $132,500 | $131 | 67 |
| 4437 N Jackson Ave | 0.58mi | 3/1.0 (+1) | 925 (+2%) | 1mo | $169,900 | $184 | 64 |
| 4444 N Chestnut Ave | 0.68mi | 2/1.0 | 888 (-2%) | 5mo | $181,000 | $204 | 62 |
| 4449 N Bellefontaine Ave | 0.56mi | 3/1.0 (+1) | 874 (-3%) | 3mo | $85,000 | $97 | 61 |
| 3737 N Walrond Ave | 0.50mi | 3/2.0 (+1) | 936 (+4%) | 1mo | $85,000 | $91 | 61 |
| 4452 N Walrond Ave | 0.54mi | 1/1.0 (-1) | 866 (-4%) | 5mo | $139,000 | $161 | 58 |
| 4412 N Jackson Ave | 0.51mi | 3/1.0 (+1) | 831 (-8%) | 0mo | $170,000 | $205 | 58 |
| 2800 Russell Rd | 0.51mi | 2/1.0 | 780 (-14%) | 1mo | $180,000 | $231 | 53 |
| 3634 N College Ave | 0.64mi | 2/1.0 | 1,013 (+12%) | 1mo | $215,000 | $212 | 50 |
| 4526 N Bellefontaine Ave | 0.67mi | 2/1.0 | 783 (-13%) | 2mo | $210,000 | $268 | 45 |
| 3636 NE Antioch Rd | 0.74mi | 2/1.0 | 784 (-13%) | 2mo | $164,900 | $210 | 42 |
Match score weights: distance 35% · size 25% · config 20% · recency 20%. Top-matched comps best support the ARV.
Projected returns pro-forma
-3.0% appreciation · 0.49% rent growth · sell at horizon
- IRR
- 18.7%
- Equity multiple
- 1.73×
- Total profit
- $14,371
- Equity at exit
- $10,422
- IRR
- 25.2%
- Equity multiple
- 2.93×
- Total profit
- $37,867
- Equity at exit
- $6,044
Cash invested: $19,572 (down + closing). Projections, not guarantees.
Landlord ↔ Tenant lean methodology
- Overall (STATE)
- 81 Strongly Landlord-Friendly
- State Missouri
- 81 Strongly Landlord-Friendly · R+10
- County
- — inherits STATE
- City
- — inherits STATE
ZIP-level market 64117
- Rents YoY
- 0.5%
- Active inventory
- 50
- Price-to-rent
- 4.8×
Monthly cashflow live
- Estimated rent
- $1,216 high interval (Pro) →
- Mortgage (P&I)
- −$367
- Tax from tax record
- −$115 /mo · $1,382/yr
- Insurance
- −$29
- HOA
- −$0
- Vacancy / Maint / Mgmt
- −$255
- Net cashflow
- $450
Break-even live
UW: 25.0% down · 7.5% · 30yr · 1.5% tax · 5.0% vac · 8.0% maint · 8.0% mgmt
Financing live
Cash to close
- Down payment
- $17,475
- Closing costs
- $2,097
- Reserves months
- —
- Total cash needed
- —
Loan-product check · same deal, 3 products live
Conventional
25% down · 7.5% · 30yr
- Down + closing
- —
- Monthly P&I
- —
- Monthly cashflow
- —
- DSCR
- —
- Eligible?
- —
Personal DTI + credit; lowest rate.
DSCR
20% down · 8.5% · 30yr
- Down + closing
- —
- Monthly P&I
- —
- Monthly cashflow
- —
- DSCR
- —
- Eligible?
- —
No personal income docs; deal must DSCR.
Hard money
10% down · 12.0% · 12mo
- Down + closing
- —
- Monthly P&I
- —
- Monthly cashflow
- —
- DSCR
- —
- Eligible?
- —
Short-term bridge; refi at stabilization.
Rent comps 12 comps
| Address | Beds | Baths | Sqft | Rent | $/sqft | DOM | Units | Dist |
|---|---|---|---|---|---|---|---|---|
| 4140 N Walrond Ave Unit 1-40108 Kansas City, MO | 1.0 | 1.0 | 643 | $900 | $1.40 | 21d | 1 | 0.31mi |
| 4140 N Walrond Ave Unit 1-40010 Kansas City, MO | 2.0 | 1.0 | 732 | $1,000 | $1.37 | 20d | 1 | 0.31mi |
| 4431 NE Winn Rd Kansas City, MO | 2.0 | 1.0 | 600 | $1,000 | $1.67 | 23d | 1 | 0.49mi |
| 3735 N Walrond Ave Kansas City, MO | 3.0 | 1.5 | 936 | $1,175 | $1.26 | 19d | 1 | 0.54mi |
| 3622 N Chouteau Trfy Kansas City, MO | 2.0 | 2.0 | 1000 | $1,125 | $1.12 | 43d | 1 | 0.59mi |
| 4623 NE Winn Rd Kansas City, MO | 2.0 | 1.0–2.0 | 852 | $1,185 | $1.39 | 2d | 18 | 0.78mi |
| 4515 NE 46th Ter Kansas City, MO | 3.0 | 1.0 | 1047 | $1,585 | $1.51 | 23d | 1 | 0.83mi |
| 3501 N Drury Ave Kansas City, MO | 2.0 | 1.0 | 890 | $1,295 | $1.46 | 21d | 1 | 1.35mi |
| 4763 N Highland Ave Kansas City, MO | 1.0–2.0 | 1.0 | 950 | $1,195 | $1.26 | 2d | 13 | 1.43mi |
| 1321a NE 39th St Kansas City, MO | 2.0 | 1.5–2.0 | 952 | $1,732 | $1.82 | 43d | 3 | 1.46mi |
| 5322 N Bales Ave Kansas City, MO | 3.0 | 1.0 | 912 | $1,495 | $1.64 | 23d | 1 | 1.49mi |
| 1300 NE Parvin Rd Kansas City, MO | 1.0–2.0 | 1.0–2.0 | 881 | $1,530 | $1.74 | 1d | 15 | 1.50mi |
Listing history 1 events
-
2026-05-15$69,900 Active
ⓘ Source: listings_history table (triggers on properties + properties_extension) + one-shot
backfill from property_details.listing_events for pre-trigger history.
Tax reassessment forecast MO · Resets to sale price
- Current annual tax
- $1,382 · $115/mo
- Projected year-2 tax
- $1,382 · $115/mo
- Expected delta
- $0/yr ($0/mo · 0.0%)
ⓘ Screening estimate from a state-policy table — verify with the county assessor before closing.
Climate risk First Street
- Flood 1/10 Low FEMA zone X (unshaded) · 0% chance over 30 yrs
- Wildfire 1/10 Low
- Heat 4/10 Moderate 7 d/yr ≥108°F today · 17 d/yr by 30 yrs out
- Wind 2/10 Low
- Air quality 3/10 Moderate 2 unhealthy d/yr today · 3 by 30 yrs out
Nearby sold comps map
Loading sold comps map…
Walkable amenities ~0.75 mi
Loading nearby amenities…
Taxation est. · year 1
- Rental income
- $14,595
- − Mortgage interest
- −$3,915
- − Property taxes
- −$1,382
- − Insurance
- −$350
- − Repairs & maintenance
- −$1,168
- − Management
- −$1,168
- − Depreciation
- −$2,033
- Taxable income
- $4,579
- Est. tax owed @ 24.0%
- −$1,099
- After-tax cash flow
- $4,301/yr
For passive investors: Depreciation is non-cash, so a rental often shows a tax loss while cash-flowing — sheltering income. Rental losses are passive: they offset passive income freely, and up to $25,000/yr can offset ordinary (W-2) income if you actively participate and your MAGI is under $100k (phasing out to $0 by $150k); unused losses carry forward. On sale, claimed depreciation is recaptured at up to 25%, and gains may owe capital-gains tax (a 1031 exchange can defer both). Figures are a year-1 estimate at your 24.0% rate — not tax advice; consult a CPA.
Schools (NCES district)
- District
- North Kansas City 74
- NCES district ID
- 2922800
- Math proficiency
- 38% ▼ -11.00%
- Reading proficiency
- 49% ▼ -3.00%
- Median HH income
- $55,444
- Composite
- 37.88/100
- National rank
- #4321
- State rank
- #98 of 324 in MO
Livability — Kansas City
- Score
- 78/100
- State rank
- #28
- US rank
- #2671
Category grades
Schools grade is shown separately in the Schools card above.
Census & demographics
- Census place
- Kansas City, MO
- County
- Clay County · 220,651 people
- City population
- 439,467
- Metro
- Kansas City, MO-KS
- Population (ZIP)
- 14,919
- Household income
- $59,601
- Rent vs Own
- Severe rent burden
- 788.0
Population outlook (Clay County) Hauer SSP2
- Today (2025)
- 266,022 people
- By 2030
- 280,057 · +5.3%
- By 2040
- 306,153 · +15.1%
- By 2050
- 328,630 · +23.5%
- By 2075
- 375,182 · +41.0%
- By 2100
- 392,861 · +47.7%
Race, ethnicity, and origin ACS 2023
- Neighborhood character
- Diverse neighborhood (Simpson 0.56)
- Race & ethnicity
- White 63% Hispanic / Latino 15% Black 14% Two or more races 8% Asian 2%
- Hispanic origin (detail)
- Mexican 9%
- Common ancestry
- Arab 3% Lithuanian 2% Serbian 1%
- Foreign-born
- 13% · Canada
- Languages at home
- 84% English-only · Spanish 9% Other Indo-European 3% Arabic 2%
Political lean MEDSL · Clay
- 2024 margin
- Lean R (+5.6) · D 46.4% · R 52.0% · Other 1.6%
- 2008→2024 swing
- -4.9pp toward R · 2008: -0.7pp · 2024: -5.6pp
- All cycles
- 2024: R+5.6 2020: R+4.1 2016: R+11.1 2012: R+8.4 2008: R+0.7
Not yet ingested
- Civics
- —
Market trends
- HPI YoY
- ▼ -229.68%
- Current HPI
- 304.5632
- Rent YoY
- ▲ 0.49%
- Metro
- Kansas City, MO-KS
- State GDP YoY
- ▲ 1.84%
- F500 in state
- 20
Industry mix (Fortune 500 HQ in MO)
| Industry | F500 HQs | Revenue |
|---|---|---|
| Healthcare | 1 | $163B |
|
||
| Insurance | 1 | $21B |
|
||
| Industrial Technology | 1 | $17B |
|
||
| Retail | 1 | $16B |
|
||
| Industrial Distribution | 1 | $10B |
|
||
| Utilities | 1 | $9B |
|
||
Price history
1 event — show timeline
- 2026-05-15 Listed $69,900 Heartland MLS as Distributed by MLS Grid
Property tax history
+3.4%/yrLatest (2025): $1,382 · +12.4% YoY. Source: county tax records.
Cash-flow waterfall
monthlySold comps — $/sqft
last 12 mo · ≤1 miLoading sold comps…