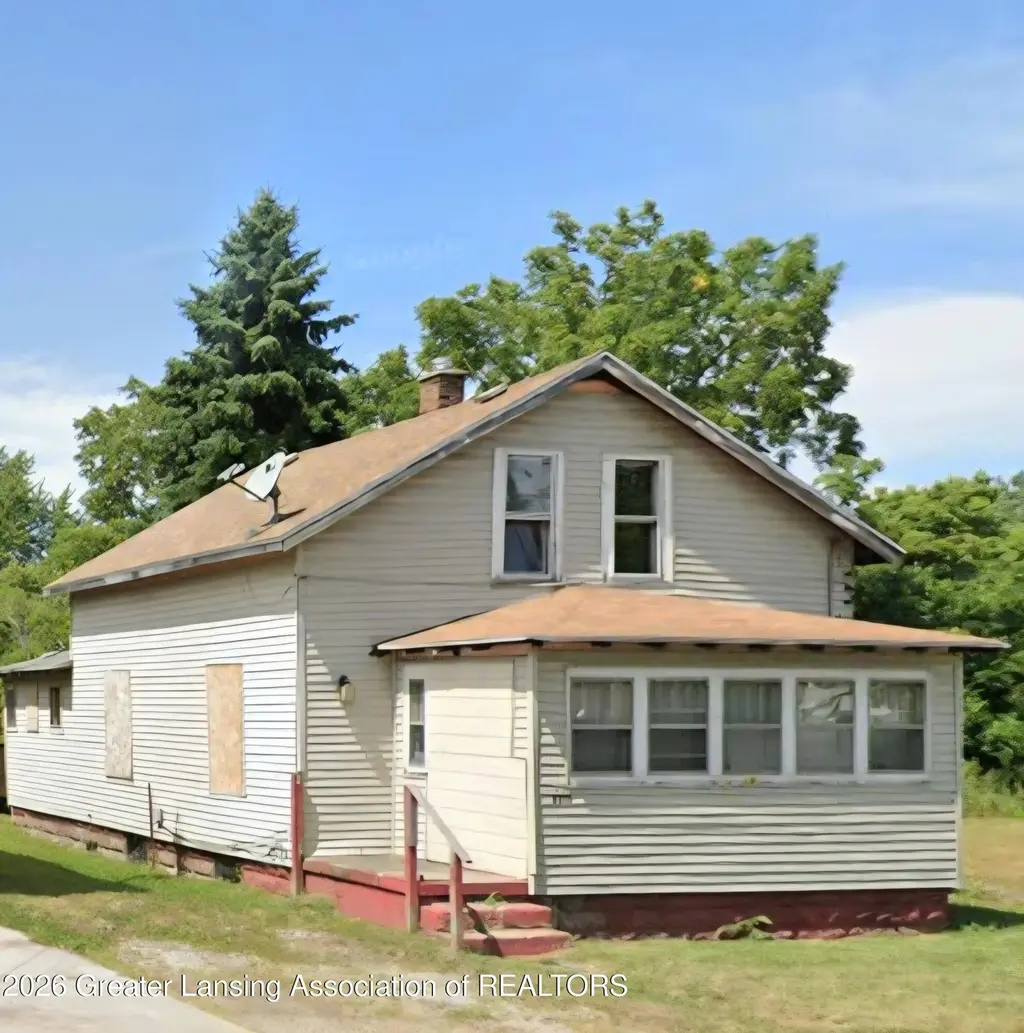
2315 N High St · Lansing, MI
Flood risk 1/10 · Minimal
- FEMA flood zone
- X (unshaded)
- Chance of flooding over 30 yrs
- 0.0%
- Est. flood insurance / yr
- $473 – $860
Fire risk 1/10 · Minimal
- Est. fire insurance / yr
- $784 – $1,456
Heat risk 2/10 · Minimal
- Hot days now (above 97°F)
- 7 days/yr
- Hot days in 30 yrs
- 16 days/yr
Wind risk 2/10 · Minimal
- Chance of severe wind over 30 yrs
- —
Air-quality risk 2/10 · Minimal
- Unhealthy air days now
- 1 days/yr
- Unhealthy air days in 30 yrs
- 2 days/yr
Risk factors via First Street. Map © Google.
Why this score? — see what drove the D+ grade
The composite is a weighted blend of 9 inputs, each scored 0–100. Each bar is that input's sub-score; the figure is the points it added to the 100-point composite (weight × sub-score).
- Cash flow +15.0/30.0
- ARV discount +7.5/15.0
- 1% rule +5.0/10.0
- DSCR +5.0/10.0
- Rent growth +5.0/5.0
- Livability +4.0/5.0
- Condition / age +2.5/5.0
- Schools +1.9/10.0
- Appreciation +0.0/10.0
$34,999
🖨 Deal sheet 📄 Offer letter ✓ Due diligence
Listing remarks MLS
4 bedroom, 1/2 bath house. Currently red tagged by the city of Lansing. Rehab condition, Cash offers only!
Key facts
- 4,356 sq ft lot
- Built 1918
- Listed 120 days
Neighborhood map
What this means for you Summary
Snapshot
- This is a 4-bed/1.0-bath single-family listed at $35k.
Deal economics
- At list price, monthly cash flow is $1k ($12k/yr) — positive.
- The deal already cash-flows at list — no discount required.
- Meets the 1% rule at list price ($2k rent vs $35k).
- Recommended offer: $32k (9.0% below list) — sets the bar for market timing.
- Cap rate 41.9% vs local median 6.0% in Lansing — top-decile yield for the area; either an underpriced asset or a hidden risk that comps aren't pricing in. Stress-test before assuming the spread holds.
Location & tenants
- Location reads 79/100 on livability (#94 in MI, #2,182 nationally) — a middle-class / working-renter tenant base. Strengths: amenities A+, commute A+, cost of living A+; Watch: employment D, schools F, crime F.
- Lansing Public School District (urban): math 14% / reading 23% proficiency, ranked #650 of 760 in MI (top 86%) — low school quality limits family demand, transient renter base, plan for 1-2y turnover; 68% free/reduced lunch — lower-income household profile, screen leases tightly.
- Market conditions: Rents rising fast (+10.5%/yr); 138 active listings in the ZIP; 5 comparable units currently listed for rent nearby; rentals lingering (median 44d on market — plan ~5-8 weeks vacancy on turnover, expect pricing pressure); 60% of comp listings sitting > 30 days — soft ceiling on asking rent; 350 units permitted in Ingham County in 2024 (186 in 5+ unit buildings).
- This rent runs 30% of the median local income ($64k/yr) — at the standard rent-burdened threshold; future hikes will face affordability resistance.
Forward outlook
- Local home prices are declining (-3.0%/yr); year-one equity from $242 of loan paydown is wiped out by about $1k of value loss. Plan a longer hold.
- Ingham County population projected at +11% by 2050 — modest demand growth; plan on rents tracking national, not racing it.
- At projected returns (-3.0% appreciation + 8.0% rent growth), your $10k cash investment doubles in ~1 year — after that, you're playing with house money.
Negotiation context
- It's been on market 120 days — a 9% lower offer ($32k) is reasonable based on typical stale-listing flexibility.
- 2 sale attempts; this cycle's ask has dropped $14k (29%) from the opening price — seller is motivated, your offer sets the floor, not the list.
Risks & watch-outs
- Watch-outs: built in 1918 — expect roof / HVAC / electrical / plumbing capex.
Questions for the listing agent
- It's been on market 120 days. Have you received any prior offers? Is the seller open to a 9% concession, seller financing, or rate buy-down credit?
- Built in 1918 — when were the roof, HVAC, electrical panel, plumbing, and water heater last replaced?
- Why hasn't it sold? Are there any deal-killer items the seller is aware of (foundation, flood, title, zoning, code violations)?
- Is there a deadline driving the sale (1031 exchange, divorce, estate, relocation)? That informs how much negotiation room exists.
- Schools are F-rated, which usually means shorter tenancies and higher turnover. Who's the typical renter profile here, and what's been the actual vacancy rate?
- Crime grade is F in this area — have there been break-ins, vandalism, or insurance claims at this property in the last 3 years? What carrier currently insures it and at what premium?
- The area grade is low — what's the realistic commute time and amenity access for the typical tenant pool here? Any planned neighborhood developments (good or bad) we should know about?
- What's the average days-on-market for RENTAL listings here right now (not sales)? A rising rental-DOM trend means longer vacancies and softer asking-rent achievability than the comps imply.
- What's the recent tenant-quality profile in this submarket — average credit score on applications, eviction rate, late-payment / NSF rate, and stable-employment percentage? A property-management company in the area should have these aggregated.
- How much new for-sale + rental construction is in the pipeline within 1–3 miles? Heavy new supply typically softens prices + rents 12–24 months out; constrained supply supports both.
Investment metrics
- 1% rule
- 4.64% ✓
- Cap rate
- 41.94%
- Cash-on-cash
- 127.33%
- DSCR
- 6.67
- GRM
- 1.8
CMA / ARV
- ARV (median comp)
- $113,547
- List price
- $34,999
- Delta
- -69.18%
- Verdict
- UNDERPRICED
- Comps
- 20 within 1.0 mi
Show comp detail 12 sales within ~0.75 mi
| Address | Dist | Beds/Ba | Sqft | Sold | Price | $/sf | Match |
|---|---|---|---|---|---|---|---|
| 816 E Harris St | 0.23mi | 4/1.0 | 1,028 (-0%) | 2mo | $55,850 | $54 | 87 |
| 2318 N High St | 0.03mi | 3/1.0 (-1) | 1,113 (+8%) | 2mo | $117,575 | $106 | 79 |
| 1016 Lake Lansing Rd | 0.17mi | 3/1.0 (-1) | 960 (-7%) | 3mo | $74,000 | $77 | 73 |
| 1922 Vermont Ave | 0.27mi | 3/1.0 (-1) | 1,054 (+2%) | 9mo | $118,000 | $112 | 72 |
| 1632 Ohio Ave | 0.48mi | 3/1.0 (-1) | 1,044 (+1%) | 1mo | $155,000 | $148 | 70 |
| 1311 Illinois Ave | 0.66mi | 3/1.0 (-1) | 1,056 (+2%) | 3mo | $137,000 | $130 | 58 |
| 1430 New York Ave | 0.56mi | 3/1.0 (-1) | 1,013 (-2%) | 10mo | $119,900 | $118 | 58 |
| 1614 Vermont Ave | 0.44mi | 3/2.0 (-1) | 1,074 (+4%) | 7mo | $142,000 | $132 | 58 |
| 2610 Gary Ave | 0.59mi | 3/2.0 (-1) | 998 (-3%) | 1mo | $160,000 | $160 | 57 |
| 1527 Massachusetts Ave | 0.49mi | 3/1.0 (-1) | 1,172 (+14%) | 1mo | $90,000 | $77 | 49 |
| 1530 New York Ave | 0.48mi | 3/2.0 (-1) | 1,161 (+12%) | 1mo | $130,000 | $112 | 47 |
| 1318 Massachusetts Ave | 0.64mi | 3/1.0 (-1) | 913 (-12%) | 7mo | $86,000 | $94 | 40 |
Match score weights: distance 35% · size 25% · config 20% · recency 20%. Top-matched comps best support the ARV.
Projected returns pro-forma
-3.0% appreciation · 8.0% rent growth · sell at horizon
- IRR
- —
- Equity multiple
- 8.06×
- Total profit
- $69,152
- Equity at exit
- $5,218
- IRR
- —
- Equity multiple
- 19.84×
- Total profit
- $184,614
- Equity at exit
- $3,026
Cash invested: $9,800 (down + closing). Projections, not guarantees.
Landlord ↔ Tenant lean methodology
- Overall (STATE)
- 62 Landlord-Friendly
- State Michigan
- 62 Landlord-Friendly · EVEN
- County
- — inherits STATE
- City
- — inherits STATE
ZIP-level market 48906
- Rents YoY
- 10.5%
- Active inventory
- 138
- Price-to-rent
- 1.8×
Monthly cashflow live
- Estimated rent
- $1,622 high interval (Pro) →
- Mortgage (P&I)
- −$184
- Tax est. 1.5%
- −$44 /mo · $525/yr
- Insurance
- −$15
- HOA
- −$0
- Vacancy / Maint / Mgmt
- −$341
- Net cashflow
- $1,040
Break-even live
UW: 25.0% down · 7.5% · 30yr · 1.5% tax · 5.0% vac · 8.0% maint · 8.0% mgmt
Financing live
Cash to close
- Down payment
- $8,750
- Closing costs
- $1,050
- Reserves months
- —
- Total cash needed
- —
Loan-product check · same deal, 3 products live
Conventional
25% down · 7.5% · 30yr
- Down + closing
- —
- Monthly P&I
- —
- Monthly cashflow
- —
- DSCR
- —
- Eligible?
- —
Personal DTI + credit; lowest rate.
DSCR
20% down · 8.5% · 30yr
- Down + closing
- —
- Monthly P&I
- —
- Monthly cashflow
- —
- DSCR
- —
- Eligible?
- —
No personal income docs; deal must DSCR.
Hard money
10% down · 12.0% · 12mo
- Down + closing
- —
- Monthly P&I
- —
- Monthly cashflow
- —
- DSCR
- —
- Eligible?
- —
Short-term bridge; refi at stabilization.
Rent comps 5 comps
| Address | Beds | Baths | Sqft | Rent | $/sqft | DOM | Units | Dist |
|---|---|---|---|---|---|---|---|---|
| 1561 Massachusetts Ave Lansing, MI | 3.0 | 2.0 | 1100 | $1,400 | $1.27 | 43d | 1 | 0.45mi |
| 1715 Peppertree Ln Lansing, MI | 2.0–3.0 | 1.5 | 1120 | $1,595 | $1.42 | 43d | 2 | 0.62mi |
| 1102 Clark St Lansing, MI | 3.0 | 1.0 | 1232 | $1,550 | $1.26 | 21d | 1 | 0.91mi |
| 1228 N Fairview Ave Lansing, MI | 3.0 | 2.0 | 1100 | $1,700 | $1.55 | 43d | 1 | 1.14mi |
| 16751 Turner Rd Lansing, MI | 4.0 | 2.0 | 1344 | $1,599 | $1.19 | 13d | 1 | 1.26mi |
Listing history 22 events
-
2026-06-18days on market $34,999 Active 120 DOM
-
2026-06-17days on market $34,999 Active 119 DOM
-
2026-06-16days on market $34,999 Active 118 DOM
-
2026-06-15days on market $34,999 Active 117 DOM
-
2026-06-14days on market $34,999 Active 115 DOM
-
2026-06-13days on market $34,999 Active 114 DOM
-
2026-06-10days on market $34,999 Active 112 DOM
-
2026-06-09days on market $34,999 Active 111 DOM
-
2026-06-08days on market $34,999 Active 110 DOM
-
2026-06-07days on market $34,999 Active 109 DOM
-
2026-06-05days on market $34,999 Active 106 DOM
-
2026-06-03days on market $34,999 Active 105 DOM
-
2026-06-02days on market $34,999 Active 104 DOM
-
2026-06-01days on market $34,999 Active 103 DOM
-
2026-05-31days on market $34,999 Active 102 DOM
-
2026-05-30days on market $34,999 Active 101 DOM
-
2026-05-20price $34,999 106-char remark
Show marketing remark (113 chars)
4 bedroom, 1¹/2 bath house. Currently red tagged by the city of Lansing. Rehab condition, Cash offers only!
-
2026-05-20price $34,999 113-char remark
Show marketing remark (113 chars)
4 bedroom, 1¹/2 bath house. Currently red tagged by the city of Lansing. Rehab condition, Cash offers only!
-
2026-03-12price $40,000 106-char remark
Show marketing remark (113 chars)
4 bedroom, 1¹/2 bath house. Currently red tagged by the city of Lansing. Rehab condition, Cash offers only!
-
2026-03-12price $40,000 113-char remark
Show marketing remark (113 chars)
4 bedroom, 1¹/2 bath house. Currently red tagged by the city of Lansing. Rehab condition, Cash offers only!
-
2026-02-17$49,000 Active 106-char remark
Show marketing remark (113 chars)
4 bedroom, 1¹/2 bath house. Currently red tagged by the city of Lansing. Rehab condition, Cash offers only!
-
2026-02-17$49,000 Active 113-char remark
Show marketing remark (113 chars)
4 bedroom, 1¹/2 bath house. Currently red tagged by the city of Lansing. Rehab condition, Cash offers only!
ⓘ Source: listings_history table (triggers on properties + properties_extension) + one-shot
backfill from property_details.listing_events for pre-trigger history.
Climate risk First Street
- Flood 1/10 Low FEMA zone X (unshaded) · 0% chance over 30 yrs
- Wildfire 1/10 Low
- Heat 2/10 Low 7 d/yr ≥97°F today · 16 d/yr by 30 yrs out
- Wind 2/10 Low
- Air quality 2/10 Low 1 unhealthy d/yr today · 2 by 30 yrs out
Nearby sold comps map
Loading sold comps map…
Walkable amenities ~0.75 mi
Loading nearby amenities…
Taxation est. · year 1
- Rental income
- $19,468
- − Mortgage interest
- −$1,960
- − Property taxes
- −$525
- − Insurance
- −$175
- − Repairs & maintenance
- −$1,557
- − Management
- −$1,557
- − Depreciation
- −$1,018
- Taxable income
- $12,675
- Est. tax owed @ 24.0%
- −$3,042
- After-tax cash flow
- $9,436/yr
For passive investors: Depreciation is non-cash, so a rental often shows a tax loss while cash-flowing — sheltering income. Rental losses are passive: they offset passive income freely, and up to $25,000/yr can offset ordinary (W-2) income if you actively participate and your MAGI is under $100k (phasing out to $0 by $150k); unused losses carry forward. On sale, claimed depreciation is recaptured at up to 25%, and gains may owe capital-gains tax (a 1031 exchange can defer both). Figures are a year-1 estimate at your 24.0% rate — not tax advice; consult a CPA.
Schools (NCES district)
- District
- Lansing Public School District
- NCES district ID
- 2621150
- Math proficiency
- 14% ▲ 1.00%
- Reading proficiency
- 23% ▲ 3.00%
- Median HH income
- $37,453
- Composite
- 18.76/100
- National rank
- #14002
- State rank
- #650 of 760 in MI
Livability — Lansing
- Score
- 79/100
- State rank
- #94
- US rank
- #2182
Category grades
Schools grade is shown separately in the Schools card above.
Census & demographics
- Census place
- Lansing, MI
- County
- Ingham County · 237,052 people
- City population
- 161,269
- Metro
- Lansing-East Lansing, MI
- Population (ZIP)
- 25,901
- Household income
- $64,315
- Rent vs Own
- Severe rent burden
- 851.0
Population outlook (Ingham County) Hauer SSP2
- Today (2025)
- 300,362 people
- By 2030
- 307,808 · +2.5%
- By 2040
- 320,492 · +6.7%
- By 2050
- 333,223 · +10.9%
- By 2075
- 373,693 · +24.4%
- By 2100
- 392,021 · +30.5%
Race, ethnicity, and origin ACS 2023
- Neighborhood character
- Diverse neighborhood (Simpson 0.56)
- Race & ethnicity
- White 64% Black 15% Two or more races 12% Hispanic / Latino 12% Asian 2%
- Hispanic origin (detail)
- Mexican 9%
- Common ancestry
- Romanian 3% Lithuanian 2% Iranian 2%
- Foreign-born
- 6% · Canada, China
- Languages at home
- 88% English-only · Spanish 5% Other Asian/Pacific 1% French/Haitian/Cajun 1%
Political lean MEDSL · Ingham
- 2024 margin
- Strong D (+29.7) · D 63.9% · R 34.2% · Other 2.0%
- 2008→2024 swing
- -3.6pp toward R · 2008: 33.3pp · 2024: 29.7pp
- All cycles
- 2024: D+29.7 2020: D+32.2 2016: D+27.6 2012: D+27.9 2008: D+33.3
Not yet ingested
- Civics
- —
Market trends
- HPI YoY
- ▼ -135.54%
- Current HPI
- 228.7023
- Rent YoY
- ▲ 10.50%
- Metro
- Lansing-East Lansing, MI
- State GDP YoY
- ▲ 1.37%
- F500 in state
- 28
Industry mix (Fortune 500 HQ in MI)
| Industry | F500 HQs | Revenue |
|---|---|---|
| Automotive Parts | 3 | $48B |
|
||
| Automotive | 2 | $372B |
|
||
| Chemicals | 1 | $45B |
|
||
| Automotive Retail | 1 | $29B |
|
||
| Healthcare / Medical Devices | 1 | $23B |
|
||
| Automotive Technology | 1 | $20B |
|
||
Price history
-28.6% since first listed6 events — show timeline
- 2026-05-20 Price Changed $34,999 REALCOMP
- 2026-05-20 Price Changed $34,999 Greater Lansing AoR
- 2026-03-12 Price Changed $40,000 REALCOMP
- 2026-03-12 Price Changed $40,000 Greater Lansing AoR
- 2026-02-17 Listed $49,000 Greater Lansing AoR
- 2026-02-17 Listed $49,000 REALCOMP
Property tax history
+12.4%/yrLatest (2025): $3,999 · -22.9% YoY. Source: county tax records.
Cash-flow waterfall
monthlySold comps — $/sqft
last 12 mo · ≤1 miLoading sold comps…