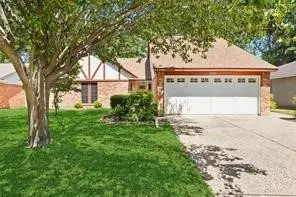
5707 Toddington Rd · Atascocita, TX
Flood risk 1/10 · Minimal
- FEMA flood zone
- X (unshaded)
- Chance of flooding over 30 yrs
- 0.0%
- Est. flood insurance / yr
- $507 – $1,088
Fire risk 3/10 · Minor
- Est. fire insurance / yr
- $1,222 – $2,270
Heat risk 9/10 · Severe
- Hot days now (above 110°F)
- 7 days/yr
- Hot days in 30 yrs
- 25 days/yr
Wind risk 9/10 · Severe
- Chance of severe wind over 30 yrs
- 99.0%
Air-quality risk 3/10 · Minor
- Unhealthy air days now
- 3 days/yr
- Unhealthy air days in 30 yrs
- 3 days/yr
Risk factors via First Street. Map © Google.
Why this score? — see what drove the D grade
The composite is a weighted blend of 9 inputs, each scored 0–100. Each bar is that input's sub-score; the figure is the points it added to the 100-point composite (weight × sub-score).
- ARV discount +10.7/15.0
- Cash flow +9.2/30.0
- Appreciation +4.5/10.0
- Schools +3.9/10.0
- Livability +3.5/5.0
- 1% rule +3.4/10.0
- DSCR +2.6/10.0
- Rent growth +2.5/5.0
- Condition / age +2.5/5.0
$275,000
🖨 Deal sheet (PDF) 📄 Offer letter ✓ Due diligence
Listing remarks
Beautifully renovated 4-bedroom, 2 bath home in the established Atascocita Trails community. This move in ready property features a spacious upstairs game room, modern updates throughout, and brand new appliances including refrigerator, dishwasher, and microwave. the functional layout offers comfortable living and entertaining space for the whole family. Conveniently located near schools, shopping, dining and major highways with easy access to Houston. Make sure to schedule your showing today! Room measurements are approximate. The Pictures attached are prior to tenant moving in.
Key facts
- Renovated home
- Brand new appliances
- Modern updates
Tags
Property features AI
Finance
- Other: Living area approximately 2,245; Lot is about 0.1591 acres (6,930 sq ft)
- HOA & community: Homeowners association: Atascocita Tris/CIA Services, INC; Annual association fee of $400
Exterior
- Parking: Attached garage with 2 spaces
- Utilities: Public water; Public sewer
- Home design: Residential property; Single-story primary living with a second-floor game room; Built in 1977; Slab foundation
- Construction: Brick and cement siding construction; Composition roof
- Exterior features: Located in a subdivision
Interior
- Bedrooms: Primary bedroom on the first floor (approx. 14 x 11); Bedroom on the first floor (approx. 12 x 9); Bedroom on the first floor (approx. 11 x 10); Bedroom on the first floor (approx. 10 x 10)
- Bathrooms: 2 full bathrooms
- Heating & cooling: Central heating (gas); Central electric air conditioning
- Interior features: One fireplace; Game room on the second floor; Total of 5 rooms
Neighborhood map
What this means for you Summary
Snapshot
- This is a 4-bed/2.0-bath single-family listed at $275k.
Deal economics
- At list price, monthly cash flow is $-205 ($-2k/yr) — negative.
- To cash-flow at today's rent, offer at most $239k (13.2% below list).
- To meet the 1% rule (rent ≥ 1% of price), the offer needs to be $231k (16.1% below list).
- Recommended offer: $231k (16.1% below list) — sets the bar for 1% rule.
- Cap rate 5.4% vs local median 4.0% in Atascocita — top-decile yield for the area; either an underpriced asset or a hidden risk that comps aren't pricing in. Stress-test before assuming the spread holds.
Location & tenants
- Location reads 70/100 on livability (#346 in TX) — a middle-class / working-renter tenant base. Strengths: employment A+, cost of living A+, housing A+; Watch: amenities F, commute F, health & safety F.
- Humble ISD (urban): math 38% / reading 44% proficiency, ranked #262 of 826 in TX (top 32%) — families likely to look elsewhere, expect single-tenant / working-renter base with shorter leases.
- Zoned schools: Oak Forest El (math 28% / reading 32%, grade F, #2,500 of 4,322 statewide, top 58%, 755 students, 67% FRL); Timberwood Middle (math 31% / reading 46%, grade F, #704 of 1,662 statewide, top 43%, 1,094 students, 54% FRL); Atascocita H S (math 41% / reading 52%, grade D-, #621 of 1,632 statewide, top 38%, 3,829 students, 42% FRL) — zoned schools average 54% FRL vs 32% district-wide (22 pts higher); higher-poverty schools than district average — tighter screening recommended.
- Market conditions: Rents flat; 682 active listings in the ZIP; 19 comparable units currently listed for rent nearby; rentals at typical pace (median 19d on market — plan ~3-4 weeks tenant-placement turnaround); high-income renter base; 29,883 units permitted in Harris County in 2024 (8,621 in 5+ unit buildings).
Forward outlook
- Local home prices are declining (-0.9%/yr); year-one equity from $2k of loan paydown is wiped out by about $3k of value loss. Plan a longer hold.
- Harris County population projected at +47% by 2050 — long-run rental-demand tailwind backs the buy-and-hold thesis.
Negotiation context
- Only 11 days on market — expect competitive offers; lowballing is unlikely to land.
- 7 sale attempts since 2y ago with the ask held roughly flat each time — persistent listings suggest the price (not the market) is what's stuck; bring a comps-based counter.
Risks & watch-outs
- Climate carrying-cost: severe wind risk, 99% chance of damaging wind over 30y; extreme-heat days projected 7→25/yr by 2055 (HVAC capex compounding) — expect insurance premiums to compound above CPI over the hold.
Questions for the listing agent
- What do current leases actually rent for vs. the listed asking? Can we see a recent rent roll and the last 12 months of T-12 income?
- Built in 1977 — when were the roof, HVAC, electrical panel, plumbing, and water heater last replaced?
- What does the HOA fee cover, when was the last increase, and are there any pending special assessments or reserve-fund shortfalls?
- Is there a deadline driving the sale (1031 exchange, divorce, estate, relocation)? That informs how much negotiation room exists.
- The area grade is low — what's the realistic commute time and amenity access for the typical tenant pool here? Any planned neighborhood developments (good or bad) we should know about?
- What's the average days-on-market for RENTAL listings here right now (not sales)? A rising rental-DOM trend means longer vacancies and softer asking-rent achievability than the comps imply.
- What's the recent tenant-quality profile in this submarket — average credit score on applications, eviction rate, late-payment / NSF rate, and stable-employment percentage? A property-management company in the area should have these aggregated.
- How much new for-sale + rental construction is in the pipeline within 1–3 miles? Heavy new supply typically softens prices + rents 12–24 months out; constrained supply supports both.
Investment metrics
- 1% rule
- 0.84% ✗
- Cap rate
- 5.40%
- Cash-on-cash
- -3.20%
- DSCR
- 0.86
- GRM
- 9.9
CMA / ARV
- ARV (on-the-fly)
- $296,340
- Comps found
- 12
Show comp detail 12 sales within ~0.75 mi
| Address | Dist | Beds/Ba | Sqft | Sold | Price | $/sf | Match |
|---|---|---|---|---|---|---|---|
| 5531 Flax Bourton St | 0.12mi | 4/2.5 | 2,318 (+3%) | 1mo | $285,000 | $123 | 86 |
| 18610 Timbers Dr | 0.15mi | 4/2.0 | 2,149 (-4%) | 4mo | $293,000 | $136 | 82 |
| 18622 Timbers Dr | 0.11mi | 4/2.0 | 1,992 (-11%) | 1mo | $270,000 | $136 | 76 |
| 5202 Flax Bourton St | 0.50mi | 4/2.5 | 2,205 (-2%) | 1mo | $260,000 | $118 | 71 |
| 18803 Timber Spring Dr | 0.14mi | 3/2.0 (-1) | 2,030 (-10%) | 3mo | $299,999 | $148 | 69 |
| 19311 Forest Fern Ct | 0.61mi | 4/2.5 | 2,276 (+1%) | 1mo | $299,900 | $132 | 67 |
| 5527 Enchanted Timbers Dr | 0.51mi | 4/2.5 | 2,348 (+5%) | 2mo | $279,900 | $119 | 66 |
| 12935 Cascadia Knoll Ct | 0.63mi | 3/2.0 (-1) | 2,127 (-5%) | 3mo | $349,900 | $165 | 54 |
| 18423 Yellowstone Trl | 0.67mi | 3/2.0 (-1) | 2,116 (-6%) | 2mo | $279,900 | $132 | 52 |
| 18502 Huron Park Trl | 0.65mi | 3/2.5 (-1) | 2,325 (+4%) | 6mo | $249,900 | $107 | 51 |
| 12335 Landsdown Ridge Way | 0.72mi | 4/2.5 | 2,408 (+7%) | 6mo | $239,500 | $99 | 47 |
| 19102 Milloak Dr | 0.68mi | 4/2.5 | 2,490 (+11%) | 2mo | $315,000 | $127 | 47 |
Match score weights: distance 35% · size 25% · config 20% · recency 20%. Top-matched comps best support the ARV.
Projected returns pro-forma
-0.95% appreciation · 0.09% rent growth · sell at horizon
- IRR
- -12.2%
- Equity multiple
- 0.49×
- Total profit
- $-39,649
- Equity at exit
- $66,987
- IRR
- -8.3%
- Equity multiple
- 0.31×
- Total profit
- $-53,302
- Equity at exit
- $70,859
Cash invested: $77,000 (down + closing). Projections, not guarantees.
Landlord ↔ Tenant lean methodology
- Overall (STATE)
- 87 Strongly Landlord-Friendly
- State Texas
- 87 Strongly Landlord-Friendly · R+5
- County
- — inherits STATE
- City
- — inherits STATE
ZIP-level market 77346
- Home prices YoY
- -0.4%
- Rents YoY
- 0.1%
- Active inventory
- 682
- Price-to-rent
- 9.9×
Monthly cashflow live
- Estimated rent
- $2,306 high interval (Pro) →
- Mortgage (P&I)
- −$1,442
- Tax from tax record
- −$437 /mo · $5,245/yr
- Insurance
- −$115
- HOA
- −$33
- Vacancy / Maint / Mgmt
- −$484
- Net cashflow
- $-205
Break-even live
Sensitivity live
| Price | -10% $-49 | -5% $-127 | +0% $-205 | +5% $-283 | +10% $-361 |
|---|---|---|---|---|---|
| Rent | -10% $-387 | -5% $-296 | +0% $-205 | +5% $-114 | +10% $-23 |
| Rate | -1.0pp $-67 | -0.5pp $-135 | base $-205 | +0.5pp $-276 | +1.0pp $-349 |
UW: 25.0% down · 7.5% · 30yr · 1.5% tax · 5.0% vac · 8.0% maint · 8.0% mgmt
Financing live
Cash to close
- Down payment
- $68,750
- Closing costs
- $8,250
- Reserves months
- —
- Total cash needed
- —
Loan-product check · same deal, 3 products live
Conventional
25% down · 7.5% · 30yr
- Down + closing
- —
- Monthly P&I
- —
- Monthly cashflow
- —
- DSCR
- —
- Eligible?
- —
Personal DTI + credit; lowest rate.
DSCR
20% down · 8.5% · 30yr
- Down + closing
- —
- Monthly P&I
- —
- Monthly cashflow
- —
- DSCR
- —
- Eligible?
- —
No personal income docs; deal must DSCR.
Hard money
10% down · 12.0% · 12mo
- Down + closing
- —
- Monthly P&I
- —
- Monthly cashflow
- —
- DSCR
- —
- Eligible?
- —
Short-term bridge; refi at stabilization.
Rent comps 19 comps
| Address | Beds | Baths | Sqft | Rent | $/sqft | DOM | Units | Dist |
|---|---|---|---|---|---|---|---|---|
| 5303 Hill Timbers Dr Humble, TX | 3.0 | 2.0 | 1884 | $2,050 | $1.09 | 45d | 1 | 0.38mi |
| 5231 Flax Bourton St Humble, TX | 3.0 | 2.0 | 1513 | $1,806 | $1.19 | 0d | 1 | 0.40mi |
| 19322 Forest Fern Ct Humble, TX | 4.0 | 2.5 | 2626 | $3,500 | $1.33 | 45d | 1 | 0.64mi |
| 12214 Landsdown Ridge Way Humble, TX | 4.0 | 2.5 | 2389 | $2,165 | $0.91 | 13d | 1 | 0.78mi |
| 18810 Woodbreeze Dr Humble, TX | 4.0 | 2.5 | 2200 | $2,279 | $1.04 | 26d | 1 | 0.83mi |
| 18103 Yellowstone Trl Humble, TX | 4.0 | 2.5 | 2602 | $2,371 | $0.91 | 45d | 1 | 0.91mi |
| 18810 Summer Anne Dr Humble, TX | 4.0 | 2.5 | 3000 | $2,376 | $0.79 | 45d | 1 | 0.93mi |
| 18835 Atasca Oaks Dr Humble, TX | 3.0 | 2.0 | 1432 | $1,829 | $1.28 | 7d | 1 | 0.95mi |
| 18123 Noble Forest Dr Humble, TX | 4.0 | 2.5 | 2328 | $2,595 | $1.11 | 7d | 1 | 0.99mi |
| 6227 Spruce Bough Ct Humble, TX | 3.0 | 2.0 | 1432 | $1,800 | $1.26 | 45d | 1 | 1.04mi |
| 7002 Echo Pines Dr Humble, TX | 3.0 | 2.0 | 1738 | $1,869 | $1.08 | 17d | 1 | 1.09mi |
| 17923 Diamond Peak Ct Humble, TX | 4.0 | 2.0 | 2171 | $2,306 | $1.06 | 0d | 1 | 1.14mi |
| 7131 Maple Walk Dr Humble, TX | 3.0 | 2.0 | 1808 | $1,895 | $1.05 | 7d | 1 | 1.17mi |
| 19902 Burle Oak Dr Humble, TX | 3.0 | 2.5 | 1532 | $1,699 | $1.11 | 45d | 1 | 1.17mi |
| 18030 June Forest Dr Humble, TX | 4.0 | 2.5 | 2341 | $2,156 | $0.92 | 0d | 1 | 1.27mi |
| 18018 Heron Forest Ln Humble, TX | 3.0 | 2.0 | 1795 | $1,939 | $1.08 | 26d | 1 | 1.35mi |
| 6519 Kings Glen Dr Humble, TX | 1.0–3.0 | 1.0–2.5 | 1255 | $2,813 | $2.24 | 0d | 14 | 1.37mi |
| 17834 Yellow Birch Trl Humble, TX | 3.0 | 2.0 | 1532 | $1,646 | $1.07 | 45d | 1 | 1.39mi |
| 7403 Misty Morning Dr Humble, TX | 3.0 | 2.0 | 1628 | $1,900 | $1.17 | 19d | 1 | 1.40mi |
HOA detail
- Monthly dues
- $33 · $396/yr
Listing history 8 events
-
2026-06-21days on market $275,000 Active 11 DOM
-
2026-06-18days on market $275,000 Active 8 DOM
-
2026-06-17days on market $275,000 Active 7 DOM
-
2026-06-16days on market $275,000 Active 6 DOM
-
2026-06-15days on market $275,000 Active 5 DOM
-
2026-06-13days on market $275,000 Active 3 DOM
-
2026-06-13remarks 586-char remark
-
2026-06-13$275,000 Active 2 DOM
ⓘ Source: listings_history table (triggers on properties + properties_extension) + one-shot
backfill from property_details.listing_events for pre-trigger history.
Tax reassessment forecast TX · Resets to sale price
- Current annual tax
- $5,245 · $437/mo
- Projected year-2 tax
- $5,245 · $437/mo
- Expected delta
- $0/yr ($0/mo · 0.0%)
ⓘ Screening estimate from a state-policy table — verify with the county assessor before closing.
Climate risk First Street
- Flood 1/10 Low FEMA zone X (unshaded) · 0% chance over 30 yrs
- Wildfire 3/10 Moderate
- Heat 9/10 Extreme 7 d/yr ≥110°F today · 25 d/yr by 30 yrs out
- Wind 9/10 Extreme 99% chance of damaging wind over 30 yrs
- Air quality 3/10 Moderate 3 unhealthy d/yr today · 3 by 30 yrs out
Nearby sold comps map
Loading sold comps map…
Walkable amenities ~0.75 mi
Loading nearby amenities…
Taxation est. · year 1
- Rental income
- $27,671
- − Mortgage interest
- −$15,404
- − Property taxes
- −$5,245
- − Insurance
- −$1,375
- − Repairs & maintenance
- −$2,214
- − Management
- −$2,214
- − HOA
- −$396
- − Depreciation
- −$8,000
- Taxable loss
- −$7,176
- Est. tax savings @ 24.0%
- +$1,722
- After-tax cash flow
- $-739/yr
For passive investors: Depreciation is non-cash, so a rental often shows a tax loss while cash-flowing — sheltering income. Rental losses are passive: they offset passive income freely, and up to $25,000/yr can offset ordinary (W-2) income if you actively participate and your MAGI is under $100k (phasing out to $0 by $150k); unused losses carry forward. On sale, claimed depreciation is recaptured at up to 25%, and gains may owe capital-gains tax (a 1031 exchange can defer both). Figures are a year-1 estimate at your 24.0% rate — not tax advice; consult a CPA.
Schools (NCES district)
- District
- Humble ISD
- NCES district ID
- 4823910
- Math proficiency
- 38% ▼ -11.00%
- Reading proficiency
- 44% ▼ -7.00%
- Median HH income
- $83,946
- Composite
- 38.55/100
- National rank
- #4171
- State rank
- #262 of 826 in TX
Livability — Atascocita
- Score
- 70/100
- State rank
- #346
- US rank
- #7586
Category grades
Schools grade is shown separately in the Schools card above.
Census & demographics
- Census place
- Atascocita, TX
- County
- Harris County · 4,702,590 people
- City population
- 79,538
- Metro
- Houston-The Woodlands-Sugar Land, TX
- Population (ZIP)
- 79,538
- Household income
- $122,241
- Rent vs Own
- Severe rent burden
- 1072.0
Population outlook (Harris County) Hauer SSP2
- Today (2025)
- 5,571,493 people
- By 2030
- 6,089,821 · +9.3%
- By 2040
- 7,142,806 · +28.2%
- By 2050
- 8,185,864 · +46.9%
- By 2075
- 10,574,329 · +89.8%
- By 2100
- 12,109,958 · +117.4%
Race, ethnicity, and origin ACS 2023
- Neighborhood character
- Diverse neighborhood (Simpson 0.70)
- Race & ethnicity
- White 42% Hispanic / Latino 28% Black 21% Two or more races 18% Asian 4%
- Hispanic origin (detail)
- Mexican 20% Puerto Rican 2%
- Common ancestry
- Lithuanian 4% Slovak 1% Italian 1%
- Foreign-born
- 10% · Canada, Vietnam, China
- Languages at home
- 78% English-only · Spanish 17% Other Indo-European 1% German/W. Germanic 1%
Political lean MEDSL · Harris
- 2024 margin
- Lean D (+5.5) · D 52.0% · R 46.4% · Other 1.6%
- 2008→2024 swing
- +3.9pp toward D · 2008: 1.6pp · 2024: 5.5pp
- All cycles
- 2024: D+5.5 2020: D+13.3 2016: D+12.4 2012: D+0.1 2008: D+1.6
Not yet ingested
- Civics
- —
Market trends
- HPI YoY
- ▼ -0.95%
- Current HPI
- 218.0478
- Rent YoY
- ▲ 0.09%
- Metro
- Houston-The Woodlands-Sugar Land, TX
- State GDP YoY
- ▲ 3.95%
- F500 in state
- 110
Industry mix (Fortune 500 HQ in TX)
| Industry | F500 HQs | Revenue |
|---|---|---|
| Energy | 16 | $1,198B |
|
||
| Technology | 5 | $198B |
|
||
| Engineering / Construction | 4 | $72B |
|
||
| Energy Services | 3 | $60B |
|
||
| Utilities | 3 | $41B |
|
||
| Healthcare | 2 | $330B |
|
||
Price history
-21.2% since first listed22 events — show timeline
- 2026-06-10 Listed $275,000 HARMLS
- 2025-01-22 Rental Removed $2,100 HARMLS
- 2025-01-22 Listing Removed — HARMLS
- 2025-01-10 Listed $279,999 HARMLS
- 2025-01-08 Listing Removed — HARMLS
- 2024-12-17 Price Changed $2,100 HARMLS
- 2024-12-17 Price Changed $279,599 HARMLS
- 2024-12-12 Price Changed $284,599 HARMLS
- 2024-11-14 Relisted — HARMLS
- 2024-11-12 Listing Removed — HARMLS
- 2024-11-07 Listed for Rent $2,200 HARMLS
- 2024-10-09 Listed $289,599 HARMLS
- 2024-09-30 Listing Removed — HARMLS
- 2024-09-22 Price Changed $289,000 HARMLS
- 2024-08-27 Price Changed $295,000 HARMLS
- 2024-08-01 Listed $315,000 HARMLS
- 2024-06-11 Listing Removed — HARMLS
- 2024-05-16 Price Changed $330,000 HARMLS
- 2024-04-25 Price Changed $342,000 HARMLS
- 2024-04-06 Listed $349,000 HARMLS
- 2024-02-15 Sold (Public Records) — Public Records
- 1988-01-02 Sold (Public Records) — Public Records
Property tax history
+7.4%/yrLatest (2025): $5,245 · -0.3% YoY. Source: county tax records.
Cash-flow waterfall
monthlySold comps — $/sqft
last 12 mo · ≤1 miLoading sold comps…