 Duplex
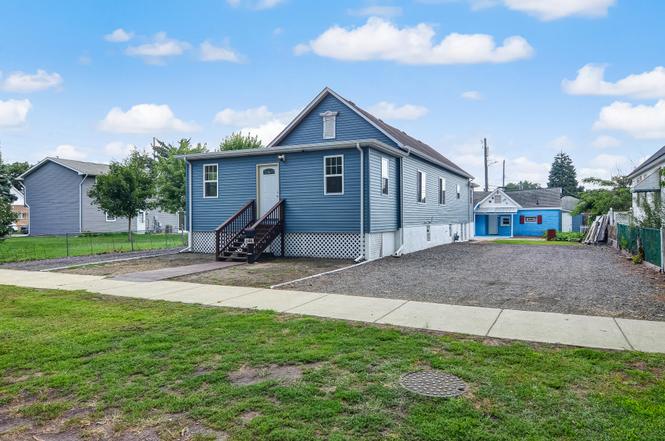
246 142nd St · Hammond, IN
Flood risk 1/10 · Minimal
- FEMA flood zone
- X (unshaded)
- Chance of flooding over 30 yrs
- 0.0%
- Est. flood insurance / yr
- $473 – $860
Fire risk 1/10 · Minimal
- Est. fire insurance / yr
- $717 – $1,331
Heat risk 3/10 · Minor
- Hot days now (above 102°F)
- 7 days/yr
- Hot days in 30 yrs
- 15 days/yr
Wind risk 2/10 · Minimal
- Chance of severe wind over 30 yrs
- 1.0%
Air-quality risk 4/10 · Minor
- Unhealthy air days now
- 5 days/yr
- Unhealthy air days in 30 yrs
- 6 days/yr
Risk factors via First Street. Map © Google.
Why this score? — see what drove the D- grade
The composite is a weighted blend of 9 inputs, each scored 0–100. Each bar is that input's sub-score; the figure is the points it added to the 100-point composite (weight × sub-score).
- Appreciation +9.5/10.0
- ARV discount +7.5/15.0
- Cash flow +7.4/30.0
- Livability +3.5/5.0
- Rent growth +2.5/5.0
- Condition / age +2.5/5.0
- 1% rule +2.1/10.0
- DSCR +1.6/10.0
- Schools +1.1/10.0
$335,000
🖨 Deal sheet (PDF) 📄 Offer letter ✓ Due diligence
Multi-family units
County records classify this as Multi-Family (2-4 Unit). Listing-text estimate: 2 units. confirmed
Listing remarks MLS
Two Homes on One Property - A Rare Find! Perfect for related living or as an investment opportunity, this unique property offers the versatility you've been looking for. The front home boasts 5 bedrooms and 3 full bathrooms, fully remodeled with brand-new windows and a new roof. The back home features 1 bedroom, 1 full bathroom, and 2 bonus rooms--ideal for a home office, guest space, or hobby area.
Key facts
- Fully remodeled
- Guest space
- Brand-new windows
Tags
Property features AI
Exterior
- Parking: Gravel parking; On-street parking
- Utilities: Public water; Public sewer
- Home design: Two-story home; Built in 1886
- Construction: House originally built in 1886
- Exterior features: Neighborhood view; No notable exterior features listed
Interior
- Kitchen: Gas range; Refrigerator; Microwave
- Bedrooms: Primary bedroom; Bedroom 2; Bedroom 3; Bedroom 4; Bedroom 5
- Bathrooms: 3 full bathrooms
- Heating & cooling: Forced air heating; Central air conditioning
- Interior features: Granite counters; Pantry; Bonus room; Living room; Family room; Dining room
- Laundry & utility: Gas water heater
Neighborhood map
What this means for you Summary
Snapshot
- This is a 2 × 3-bed/2.0-bath units multifamily listed at $335k.
Deal economics
- At list price, monthly cash flow is $-428 ($-5k/yr) — negative. Per door: $-214/mo.
- To cash-flow at today's rent, offer at most $259k (22.6% below list).
- To meet the 1% rule (rent ≥ 1% of price), the offer needs to be $239k (28.6% below list).
- Recommended offer: $239k (28.6% below list) — sets the bar for 1% rule.
Location & tenants
- Location reads 70/100 on livability (#143 in IN) — a middle-class / working-renter tenant base. Strengths: cost of living A+, housing A+, commute A; Watch: health & safety D+, employment D, crime F.
- School City Of Hammond (suburban): math 8% / reading 18% proficiency, ranked #289 of 301 in IN (top 96%) — low school quality limits family demand, transient renter base, plan for 1-2y turnover; 74% free/reduced lunch — lower-income household profile, screen leases tightly.
- Zoned schools: Abraham Lincoln Elementary School (math 8% / reading 13%, grade F, #914 of 994 statewide, top 92%, 546 students, 75% FRL) — zoned schools at 75% FRL track the district average.
- Market conditions: 29 active listings in the ZIP; 2 comparable units currently listed for rent nearby; 1,642 units permitted in Lake County in 2024 (14 in 5+ unit buildings).
Forward outlook
- In year one you build about $33k of equity ($2k loan paydown + $30k appreciation (9.1% local appreciation)).
- Lake County population projected to shrink 7% by 2050 — rents likely to lag national; underwrite the cash flow, not the appreciation.
- By year 2, paydown + projected appreciation supports a ~$53k cash-out refi (75% LTV) — recoverable capital for the next deal without selling this one.
Negotiation context
- It's been on market 129 days — a 12% lower offer ($295k) is reasonable based on typical stale-listing flexibility.
- 6 sale attempts since 19y ago with the ask held roughly flat each time — persistent listings suggest the price (not the market) is what's stuck; bring a comps-based counter.
Risks & watch-outs
- Watch-outs: built in 1886 — expect roof / HVAC / electrical / plumbing capex.
Questions for the listing agent
- What do current leases actually rent for vs. the listed asking? Can we see a recent rent roll and the last 12 months of T-12 income?
- It's been on market 129 days. Have you received any prior offers? Is the seller open to a 29% concession, seller financing, or rate buy-down credit?
- Can we see the unit-by-unit rent roll, current vacancy, and any below-market leases? What's the average tenancy length?
- What capital expenditures (roof, boiler, parking lot, exteriors) have been made in the last 5 years, and what's planned in the next 2?
- Built in 1886 — when were the roof, HVAC, electrical panel, plumbing, and water heater last replaced?
- Why hasn't it sold? Are there any deal-killer items the seller is aware of (foundation, flood, title, zoning, code violations)?
- Is there a deadline driving the sale (1031 exchange, divorce, estate, relocation)? That informs how much negotiation room exists.
- Schools are F-rated, which usually means shorter tenancies and higher turnover. Who's the typical renter profile here, and what's been the actual vacancy rate?
- Crime grade is F in this area — have there been break-ins, vandalism, or insurance claims at this property in the last 3 years? What carrier currently insures it and at what premium?
- The area grade is low — what's the realistic commute time and amenity access for the typical tenant pool here? Any planned neighborhood developments (good or bad) we should know about?
- What's the average days-on-market for RENTAL listings here right now (not sales)? A rising rental-DOM trend means longer vacancies and softer asking-rent achievability than the comps imply.
- What's the recent tenant-quality profile in this submarket — average credit score on applications, eviction rate, late-payment / NSF rate, and stable-employment percentage? A property-management company in the area should have these aggregated.
- How much new apartment / multifamily construction is in the pipeline within 1–3 miles? Heavy new supply (>2% of stock underway) typically softens rents 12–24 months out; light construction supports rent growth.
Investment metrics
- 1% rule
- 0.71% ✗
- Cap rate
- 4.76%
- Cash-on-cash
- -5.47%
- DSCR
- 0.76
- GRM
- 11.7
CMA / ARV
No comps found within radius.
Projected returns pro-forma
9.08% appreciation · 3.0% rent growth · sell at horizon
- IRR
- 18.4%
- Equity multiple
- 2.43×
- Total profit
- $134,369
- Equity at exit
- $279,600
- IRR
- 17.2%
- Equity multiple
- 5.40×
- Total profit
- $412,822
- Equity at exit
- $580,812
Cash invested: $93,800 (down + closing). Projections, not guarantees.
Landlord ↔ Tenant lean methodology
- Overall (STATE)
- 90 Strongly Landlord-Friendly
- State Indiana
- 90 Strongly Landlord-Friendly · R+11
- County
- — inherits STATE
- City
- — inherits STATE
ZIP-level market 46327
- Home prices YoY
- 2.7%
- Active inventory
- 29
- Price-to-rent
- 23.3×
Monthly cashflow live
- Estimated rent
- $2,392 medium interval (Pro) →
- Mortgage (P&I)
- −$1,757
- Tax from tax record
- −$421 /mo · $5,055/yr
- Insurance
- −$140
- HOA
- −$0
- Vacancy / Maint / Mgmt
- −$502
- Net cashflow
- $-428
Break-even live
Sensitivity live
| Price | -10% $-238 | -5% $-333 | +0% $-428 | +5% $-523 | +10% $-618 |
|---|---|---|---|---|---|
| Rent | -10% $-617 | -5% $-522 | +0% $-428 | +5% $-333 | +10% $-239 |
| Rate | -1.0pp $-259 | -0.5pp $-343 | base $-428 | +0.5pp $-515 | +1.0pp $-603 |
2-unit breakdown (identical units grouped — click to expand)
| Units | Beds | Baths | Est. rent |
|---|---|---|---|
| 2× units | 3 | 2 | $2,392 |
| #1 | 3 | 2 | $1,196 |
| #2 | 3 | 2 | $1,196 |
| Total (2 units) | $2,392 | ||
UW: 25.0% down · 7.5% · 30yr · 1.5% tax · 5.0% vac · 8.0% maint · 8.0% mgmt
Financing live
Cash to close
- Down payment
- $83,750
- Closing costs
- $10,050
- Reserves months
- —
- Total cash needed
- —
Loan-product check · same deal, 3 products live
Conventional
25% down · 7.5% · 30yr
- Down + closing
- —
- Monthly P&I
- —
- Monthly cashflow
- —
- DSCR
- —
- Eligible?
- —
Personal DTI + credit; lowest rate.
DSCR
20% down · 8.5% · 30yr
- Down + closing
- —
- Monthly P&I
- —
- Monthly cashflow
- —
- DSCR
- —
- Eligible?
- —
No personal income docs; deal must DSCR.
Hard money
10% down · 12.0% · 12mo
- Down + closing
- —
- Monthly P&I
- —
- Monthly cashflow
- —
- DSCR
- —
- Eligible?
- —
Short-term bridge; refi at stabilization.
Rent comps 2 comps
| Address | Beds | Baths | Sqft | Rent | $/sqft | DOM | Units | Dist |
|---|---|---|---|---|---|---|---|---|
| 323 Memorial Dr Unit 2 Calumet City, IL | 2.0 | 1.0 | 1000 | $1,600 | $1.60 | 26d | 1 | 1.46mi |
| 323 Memorial Dr #1 Calumet City, IL | 1.0 | 1.0 | 1000 | $1,250 | $1.25 | 26d | 1 | 1.46mi |
Listing history 22 events
-
2026-06-13statusdays on market $335,000 Pending 129 DOM
-
2026-06-09days on market $335,000 Active 126 DOM
-
2026-06-08days on market $335,000 Active 125 DOM
-
2026-06-07days on market $335,000 Active 124 DOM
-
2026-06-04days on market $335,000 Active 121 DOM
-
2026-06-03days on market $335,000 Active 120 DOM
-
2026-06-02days on market $335,000 Active 119 DOM
-
2026-06-01days on market $335,000 Active 118 DOM
-
2026-05-31days on market $335,000 Active 117 DOM
-
2026-02-02$335,000 Active 402-char remark
Show marketing remark (402 chars)
Two Homes on One Property - A Rare Find! Perfect for related living or as an investment opportunity, this unique property offers the versatility you've been looking for. The front home boasts 5 bedrooms and 3 full bathrooms, fully remodeled with brand-new windows and a new roof. The back home features 1 bedroom, 1 full bathroom, and 2 bonus rooms--ideal for a home office, guest space, or hobby area.
-
2026-02-02$335,000 Active
Show marketing remark (402 chars)
Two Homes on One Property - A Rare Find! Perfect for related living or as an investment opportunity, this unique property offers the versatility you've been looking for. The front home boasts 5 bedrooms and 3 full bathrooms, fully remodeled with brand-new windows and a new roof. The back home features 1 bedroom, 1 full bathroom, and 2 bonus rooms--ideal for a home office, guest space, or hobby area.
-
2026-02-02historical
Show marketing remark (402 chars)
Two Homes on One Property - A Rare Find! Perfect for related living or as an investment opportunity, this unique property offers the versatility you've been looking for. The front home boasts 5 bedrooms and 3 full bathrooms, fully remodeled with brand-new windows and a new roof. The back home features 1 bedroom, 1 full bathroom, and 2 bonus rooms--ideal for a home office, guest space, or hobby area.
-
2026-01-06price $340,000
-
2025-09-30price $350,000
-
2025-09-08price $355,000
-
2025-08-10$360,000 Active
-
2011-04-01historical
-
2011-04-01historical
-
2010-09-23$110,000
-
2010-09-07$110,000
-
2008-09-11historical
-
2007-09-10$120,000
ⓘ Source: listings_history table (triggers on properties + properties_extension) + one-shot
backfill from property_details.listing_events for pre-trigger history.
Tax reassessment forecast IN · Partial reset (capped growth)
- Current annual tax
- $5,055 · $421/mo
- Projected year-2 tax
- $5,055 · $421/mo
- Expected delta
- $0/yr ($0/mo · 0.0%)
ⓘ Screening estimate from a state-policy table — verify with the county assessor before closing.
Climate risk First Street
- Flood 1/10 Low FEMA zone X (unshaded) · 0% chance over 30 yrs
- Wildfire 1/10 Low
- Heat 3/10 Moderate 7 d/yr ≥102°F today · 15 d/yr by 30 yrs out
- Wind 2/10 Low 100% chance of damaging wind over 30 yrs
- Air quality 4/10 Moderate 5 unhealthy d/yr today · 6 by 30 yrs out
Nearby sold comps map
Loading sold comps map…
Walkable amenities ~0.75 mi
Loading nearby amenities…
Taxation est. · year 1
- Rental income
- $28,704
- − Mortgage interest
- −$18,765
- − Property taxes
- −$5,055
- − Insurance
- −$1,675
- − Repairs & maintenance
- −$2,296
- − Management
- −$2,296
- − Depreciation
- −$9,745
- Taxable loss
- −$11,129
- Est. tax savings @ 24.0%
- +$2,671
- After-tax cash flow
- $-2,464/yr
For passive investors: Depreciation is non-cash, so a rental often shows a tax loss while cash-flowing — sheltering income. Rental losses are passive: they offset passive income freely, and up to $25,000/yr can offset ordinary (W-2) income if you actively participate and your MAGI is under $100k (phasing out to $0 by $150k); unused losses carry forward. On sale, claimed depreciation is recaptured at up to 25%, and gains may owe capital-gains tax (a 1031 exchange can defer both). Figures are a year-1 estimate at your 24.0% rate — not tax advice; consult a CPA.
Schools (NCES district)
- District
- School City Of Hammond
- NCES district ID
- 1804320
- Math proficiency
- 8% ▼ -18.00%
- Reading proficiency
- 18% ▼ -15.00%
- Median HH income
- $39,970
- Composite
- 11.11/100
- National rank
- #9730
- State rank
- #289 of 301 in IN
Livability — Hammond
- Score
- 70/100
- State rank
- #143
- US rank
- #7343
Category grades
Schools grade is shown separately in the Schools card above.
Census & demographics
- Census place
- Hammond, IN
- City population
- 58,809
- Population (ZIP)
- 10,797
Population outlook (Lake County) Hauer SSP2
- Today (2025)
- 484,026 people
- By 2030
- 478,091 · -1.2%
- By 2040
- 462,974 · -4.3%
- By 2050
- 449,894 · -7.1%
- By 2075
- 436,169 · -9.9%
- By 2100
- 426,607 · -11.9%
Race, ethnicity, and origin ACS 2023
- Neighborhood character
- Diverse neighborhood (Simpson 0.57)
- Race & ethnicity
- Hispanic / Latino 58% White 28% Black 13% Two or more races 9%
- Hispanic origin (detail)
- Mexican 54% Puerto Rican 3%
- Common ancestry
- Romanian 7% Iranian 2% Lithuanian 1%
- Foreign-born
- 21% · Canada
- Languages at home
- 60% English-only · Spanish 38% Russian/Polish/Slavic 1% Arabic 1%
Political lean MEDSL · Lake
- 2024 margin
- Lean D (+5.6) · D 52.1% · R 46.5% · Other 1.5%
- 2008→2024 swing
- -28.6pp toward R · 2008: 34.3pp · 2024: 5.6pp
- All cycles
- 2024: D+5.6 2020: D+15.1 2016: D+20.6 2012: D+31.0 2008: D+34.3
Not yet ingested
- Civics
- —
Market trends
- HPI YoY
- ▲ 9.08%
- Current HPI
- 343.2924
- Rent YoY
- —
- Metro
- —
- State GDP YoY
- ▲ 2.90%
- F500 in state
- 18
Industry mix (Fortune 500 HQ in IN)
| Industry | F500 HQs | Revenue |
|---|---|---|
| Industrial Machinery | 2 | $37B |
|
||
| Healthcare | 1 | $177B |
|
||
| Pharmaceuticals | 1 | $45B |
|
||
| Metals / Steel | 1 | $18B |
|
||
| Agriculture | 1 | $17B |
|
||
| Packaging | 1 | $12B |
|
||
Price history
+179.2% since first listed13 events — show timeline
- 2026-02-02 Listed $335,000 NIRA MLS as Distributed by MLS Grid
- 2026-02-02 Listed $335,000 NIRA MLS as Distributed by MLS Grid
- 2026-02-02 Listing Removed — NIRA MLS as Distributed by MLS Grid
- 2026-01-06 Price Changed $340,000 NIRA MLS as Distributed by MLS Grid
- 2025-09-30 Price Changed $350,000 NIRA MLS as Distributed by MLS Grid
- 2025-09-08 Price Changed $355,000 NIRA MLS as Distributed by MLS Grid
- 2025-08-10 Listed $360,000 NIRA MLS as Distributed by MLS Grid
- 2011-04-01 Listing Removed — NIRA MLS as Distributed by MLS Grid
- 2011-04-01 Listing Removed — NIRA MLS as Distributed by MLS Grid
- 2010-09-23 Listed $110,000 NIRA MLS as Distributed by MLS Grid
- 2010-09-07 Listed $110,000 NIRA MLS as Distributed by MLS Grid
- 2008-09-11 Listing Removed — NIRA MLS as Distributed by MLS Grid
- 2007-09-10 Listed $120,000 NIRA MLS as Distributed by MLS Grid
Property tax history
+8.0%/yrLatest (2024): $5,055 · +24.5% YoY. Source: county tax records.
Cash-flow waterfall
monthlySold comps — $/sqft
last 12 mo · ≤1 miLoading sold comps…