189 Barons Rd · Ridgeville, SC
Flood risk 1/10 · Minimal
- FEMA flood zone
- X (unshaded)
- Chance of flooding over 30 yrs
- 0.0%
- Est. flood insurance / yr
- $507 – $1,088
Fire risk 5/10 · Moderate
- Est. fire insurance / yr
- $783 – $1,453
Heat risk 8/10 · Major
- Hot days now (above 106°F)
- 7 days/yr
- Hot days in 30 yrs
- 17 days/yr
Wind risk 8/10 · Major
- Chance of severe wind over 30 yrs
- 80.0%
Air-quality risk 3/10 · Minor
- Unhealthy air days now
- 3 days/yr
- Unhealthy air days in 30 yrs
- 3 days/yr
Risk factors via First Street. Map © Google.
Why this score? — see what drove the D grade
The composite is a weighted blend of 9 inputs, each scored 0–100. Each bar is that input's sub-score; the figure is the points it added to the 100-point composite (weight × sub-score).
- ARV discount +14.0/15.0
- Cash flow +11.0/30.0
- 1% rule +4.1/10.0
- Schools +4.1/10.0
- DSCR +3.2/10.0
- Livability +3.0/5.0
- Rent growth +2.9/5.0
- Condition / age +2.5/5.0
- Appreciation +0.0/10.0
$269,900
🖨 Deal sheet 📄 Offer letter ✓ Due diligence
Listing remarks MLS
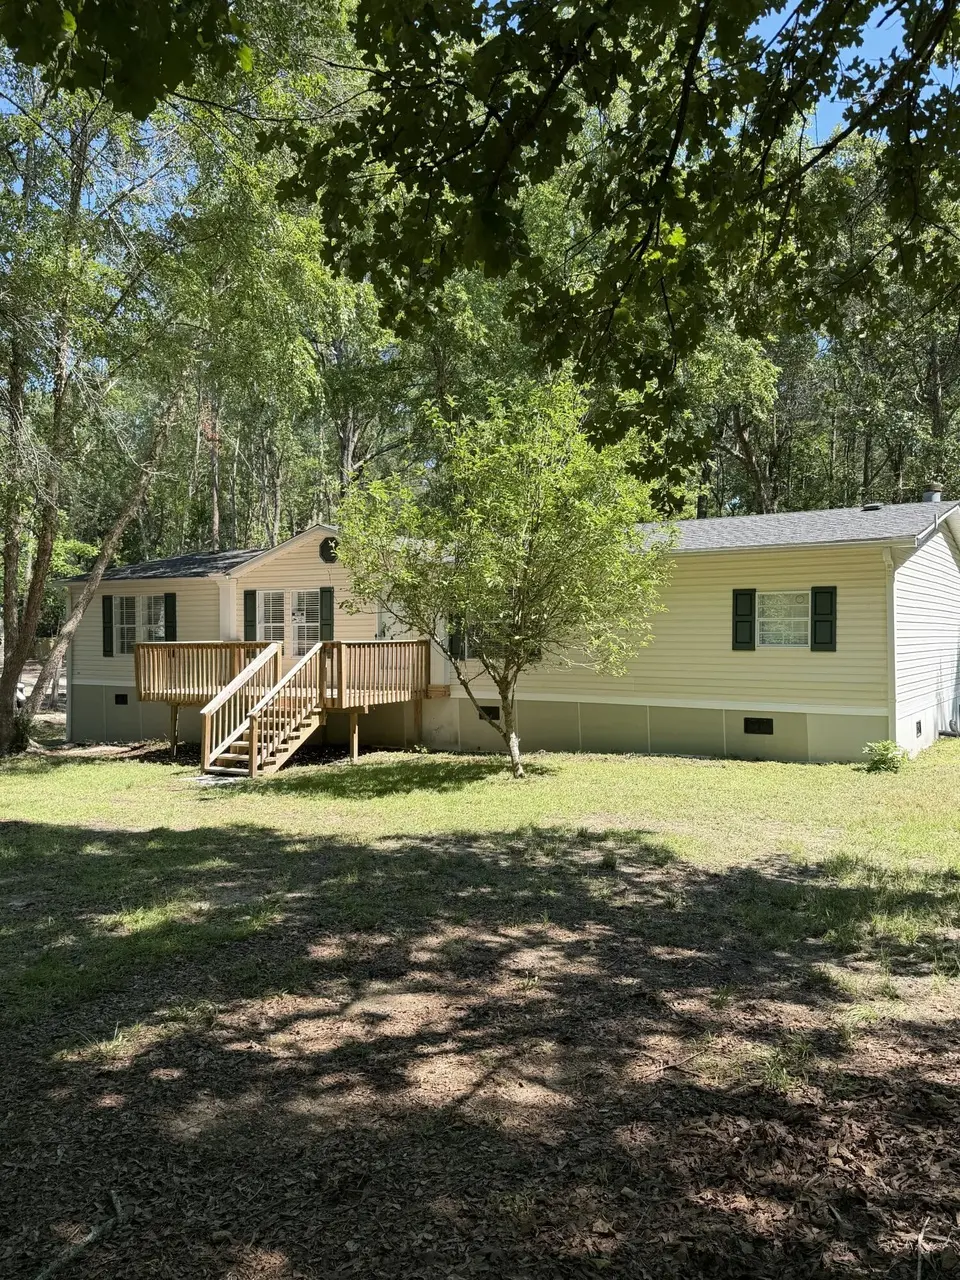
If you are looking for a large plot of land in Summerville, then this is the property for you. The border of trees around the property provides privacy yet it's just minutes from grocery stores, restaurants, and downtown Summerville. It is the perfect canvas for your landscaping dreams, providing ample space for gardening and outdoor activities. And, as an added bonus, it's in DD2 school district! The land currently has a double wide trailer on it being sold in as is condition, providing endless opportunities for customization. Property has private well and septic , but can hook up to the city if you choose. Finding land in this area is truly a rare find! Schedule your showing today!*Up to $2500 lender credit, using preferred lender, Brandon Roach. Email: [email protected]
Key facts
- 0.87 acre lot
- Built 2004
- Listed 5 days
Property features AI
Exterior
- Utilities: Septic tank
- Home design: Manufactured/mobile home (double wide); Single-level (one story); Residential property
- Construction: Double wide manufactured home
- Exterior features: Architectural roof; Lot approximately 0.5–1 acre; No other structures
Interior
- Bedrooms: 3 bedrooms (primary includes garden tub/shower and walk-in closet)
- Flooring: Luxury vinyl
- Bathrooms: 2 bathrooms
- Heating & cooling: Heat pump heating; Central air conditioning
- Interior features: Luxury vinyl flooring; Garden tub/shower in primary bedroom; Primary bedroom with walk-in closet
Neighborhood map
What this means for you Summary
Snapshot
- This is a 3-bed/2.0-bath manufactured listed at $270k.
Deal economics
- At list price, monthly cash flow is $-114 ($-1k/yr) — negative.
- To cash-flow at today's rent, offer at most $250k (7.5% below list).
- To meet the 1% rule (rent ≥ 1% of price), the offer needs to be $246k (8.7% below list).
- Recommended offer: $246k (8.7% below list) — sets the bar for 1% rule.
- Cap rate 5.8% vs local median 3.1% in Ridgeville — top-decile yield for the area; either an underpriced asset or a hidden risk that comps aren't pricing in. Stress-test before assuming the spread holds.
Location & tenants
- Location reads 59/100 on livability (#245 in SC) — a working-class tenant base; expect higher turnover. Strengths: cost of living A+, housing A+, crime A-; Watch: health & safety C-, employment D, amenities F.
- Dorchester 02 (suburban): math 40% / reading 55% proficiency, ranked #12 of 80 in SC (top 15%) — families likely to look elsewhere, expect single-tenant / working-renter base with shorter leases.
- Zoned schools: William M. Reeves Elementary (math 51% / reading 55%, grade C, #138 of 597 statewide, top 24%, 914 students, 62% FRL); Charles B. Dubose Middle (math 30% / reading 45%, grade F, #90 of 229 statewide, top 42%, 950 students, 62% FRL); Summerville High (math 60% / reading 92%, grade A-, #34 of 196 statewide, top 17%, 3,308 students, 59% FRL) — zoned schools average 61% FRL vs 36% district-wide (25 pts higher); higher-poverty schools than district average — tighter screening recommended.
- Market conditions: Rents rising (+1.4%/yr); 741 active listings in the ZIP; 2 comparable units currently listed for rent nearby; solid renter incomes; 1,199 units permitted in Dorchester County in 2024 (0 in 5+ unit buildings).
- This rent runs 34% of the median local income ($86k/yr) — at the standard rent-burdened threshold; future hikes will face affordability resistance.
Forward outlook
- Local home prices are declining (-3.0%/yr); year-one equity from $2k of loan paydown is wiped out by about $8k of value loss. Plan a longer hold.
- Dorchester County population projected at +43% by 2050 — long-run rental-demand tailwind backs the buy-and-hold thesis.
Negotiation context
- Only 5 days on market — expect competitive offers; lowballing is unlikely to land.
- 2 sale attempts since 2y ago with the ask held roughly flat each time — persistent listings suggest the price (not the market) is what's stuck; bring a comps-based counter.
Risks & watch-outs
- Climate carrying-cost: severe wind risk, 80% chance of damaging wind over 30y; moderate wildfire risk; extreme-heat days projected 7→17/yr by 2055 (HVAC capex compounding) — expect insurance premiums to compound above CPI over the hold.
Questions for the listing agent
- What do current leases actually rent for vs. the listed asking? Can we see a recent rent roll and the last 12 months of T-12 income?
- Is there a deadline driving the sale (1031 exchange, divorce, estate, relocation)? That informs how much negotiation room exists.
- Schools are F-rated, which usually means shorter tenancies and higher turnover. Who's the typical renter profile here, and what's been the actual vacancy rate?
- The area grade is low — what's the realistic commute time and amenity access for the typical tenant pool here? Any planned neighborhood developments (good or bad) we should know about?
- What's the average days-on-market for RENTAL listings here right now (not sales)? A rising rental-DOM trend means longer vacancies and softer asking-rent achievability than the comps imply.
- What's the recent tenant-quality profile in this submarket — average credit score on applications, eviction rate, late-payment / NSF rate, and stable-employment percentage? A property-management company in the area should have these aggregated.
- How much new for-sale + rental construction is in the pipeline within 1–3 miles? Heavy new supply typically softens prices + rents 12–24 months out; constrained supply supports both.
Investment metrics
- 1% rule
- 0.91% ✗
- Cap rate
- 5.79%
- Cash-on-cash
- -1.81%
- DSCR
- 0.92
- GRM
- 9.1
CMA / ARV
- ARV (on-the-fly)
- $315,840
- Comps found
- 1
Show comp detail 1 sale within ~0.75 mi
| Address | Dist | Beds/Ba | Sqft | Sold | Price | $/sf | Match |
|---|---|---|---|---|---|---|---|
| 123 Christina Ln | 0.73mi | 3/2.0 | 1,856 (+10%) | 9mo | $348,900 | $188 | 41 |
Match score weights: distance 35% · size 25% · config 20% · recency 20%. Top-matched comps best support the ARV.
Projected returns pro-forma
-3.0% appreciation · 1.45% rent growth · sell at horizon
- IRR
- -21.2%
- Equity multiple
- 0.28×
- Total profit
- $-54,621
- Equity at exit
- $40,243
- IRR
- -19.0%
- Equity multiple
- 0.06×
- Total profit
- $-71,323
- Equity at exit
- $23,336
Cash invested: $75,572 (down + closing). Projections, not guarantees.
Landlord ↔ Tenant lean methodology
- Overall (STATE)
- 90 Strongly Landlord-Friendly
- State South Carolina
- 90 Strongly Landlord-Friendly · R+6
- County
- — inherits STATE
- City
- — inherits STATE
ZIP-level market 29483
- Home prices YoY
- -34.6%
- Rents YoY
- 1.4%
- Active inventory
- 741
- Price-to-rent
- 9.1×
Monthly cashflow live
- Estimated rent
- $2,464 medium interval (Pro) →
- Mortgage (P&I)
- −$1,415
- Tax from tax record
- −$533 /mo · $6,390/yr
- Insurance
- −$112
- HOA
- −$0
- Vacancy / Maint / Mgmt
- −$517
- Net cashflow
- $-114
Break-even live
UW: 25.0% down · 7.5% · 30yr · 1.5% tax · 5.0% vac · 8.0% maint · 8.0% mgmt
Financing live
Cash to close
- Down payment
- $67,475
- Closing costs
- $8,097
- Reserves months
- —
- Total cash needed
- —
Loan-product check · same deal, 3 products live
Conventional
25% down · 7.5% · 30yr
- Down + closing
- —
- Monthly P&I
- —
- Monthly cashflow
- —
- DSCR
- —
- Eligible?
- —
Personal DTI + credit; lowest rate.
DSCR
20% down · 8.5% · 30yr
- Down + closing
- —
- Monthly P&I
- —
- Monthly cashflow
- —
- DSCR
- —
- Eligible?
- —
No personal income docs; deal must DSCR.
Hard money
10% down · 12.0% · 12mo
- Down + closing
- —
- Monthly P&I
- —
- Monthly cashflow
- —
- DSCR
- —
- Eligible?
- —
Short-term bridge; refi at stabilization.
Rent comps 2 comps
| Address | Beds | Baths | Sqft | Rent | $/sqft | DOM | Units | Dist |
|---|---|---|---|---|---|---|---|---|
| 3050 Argyll Dr Summerville, SC | 4.0 | 2.5 | 1963 | $2,350 | $1.20 | 2d | 1 | 0.74mi |
| 708 E Butternut Rd Summerville, SC | 3.0 | 2.0 | 1700 | $2,900 | $1.71 | 10d | 1 | 0.95mi |
Listing history 6 events
-
2026-06-18days on market $269,900 Active 5 DOM
-
2026-06-17days on market $269,900 Active 4 DOM
-
2026-06-16days on market $269,900 Active 3 DOM
-
2026-06-15days on market $269,900 Active 2 DOM
-
2026-06-13remarks 699-char remark
-
2026-06-13$269,900 Active 1 DOM
ⓘ Source: listings_history table (triggers on properties + properties_extension) + one-shot
backfill from property_details.listing_events for pre-trigger history.
Tax reassessment forecast SC · Resets to sale price
- Current annual tax
- $6,390 · $533/mo
- Projected year-2 tax
- $6,390 · $533/mo
- Expected delta
- $0/yr ($0/mo · 0.0%)
ⓘ Screening estimate from a state-policy table — verify with the county assessor before closing.
Climate risk First Street
- Flood 1/10 Low FEMA zone X (unshaded) · 0% chance over 30 yrs
- Wildfire 5/10 Major
- Heat 8/10 Severe 7 d/yr ≥106°F today · 17 d/yr by 30 yrs out
- Wind 8/10 Severe 80% chance of damaging wind over 30 yrs
- Air quality 3/10 Moderate 3 unhealthy d/yr today · 3 by 30 yrs out
Nearby sold comps map
Loading sold comps map…
Walkable amenities ~0.75 mi
Loading nearby amenities…
Taxation est. · year 1
- Rental income
- $29,566
- − Mortgage interest
- −$15,119
- − Property taxes
- −$6,390
- − Insurance
- −$1,350
- − Repairs & maintenance
- −$2,365
- − Management
- −$2,365
- − Depreciation
- −$7,852
- Taxable loss
- −$5,875
- Est. tax savings @ 24.0%
- +$1,410
- After-tax cash flow
- $42/yr
For passive investors: Depreciation is non-cash, so a rental often shows a tax loss while cash-flowing — sheltering income. Rental losses are passive: they offset passive income freely, and up to $25,000/yr can offset ordinary (W-2) income if you actively participate and your MAGI is under $100k (phasing out to $0 by $150k); unused losses carry forward. On sale, claimed depreciation is recaptured at up to 25%, and gains may owe capital-gains tax (a 1031 exchange can defer both). Figures are a year-1 estimate at your 24.0% rate — not tax advice; consult a CPA.
Schools (NCES district)
- District
- Dorchester 02
- NCES district ID
- 4502010
- Math proficiency
- 40% ▼ -13.00%
- Reading proficiency
- 55% ▼ -4.00%
- Median HH income
- $57,937
- Composite
- 41.41/100
- National rank
- #3475
- State rank
- #12 of 80 in SC
Livability — Ridgeville
- Score
- 59/100
- State rank
- #245
- US rank
- #20104
Category grades
Schools grade is shown separately in the Schools card above.
Census & demographics
- County
- Dorchester County · 182,866 people
- Metro
- Charleston-North Charleston, SC
- Population (ZIP)
- 59,186
- Household income
- $85,750
- Rent vs Own
- Severe rent burden
- 1309.0
Population outlook (Dorchester County) Hauer SSP2
- Today (2025)
- 186,982 people
- By 2030
- 203,967 · +9.1%
- By 2040
- 237,160 · +26.8%
- By 2050
- 267,479 · +43.1%
- By 2075
- 333,025 · +78.1%
- By 2100
- 366,560 · +96.0%
Race, ethnicity, and origin ACS 2023
- Neighborhood character
- Predominantly White (68%)
- Race & ethnicity
- White 68% Black 19% Hispanic / Latino 7% Two or more races 6% Asian 1%
- Hispanic origin (detail)
- Mexican 3% Puerto Rican 1%
- Common ancestry
- Slovak 3% Lithuanian 3% Romanian 3%
- Foreign-born
- 5% · Canada
- Languages at home
- 93% English-only · Spanish 4%
Political lean MEDSL · Dorchester
- 2024 margin
- R (+14.6) · D 41.8% · R 56.4% · Other 1.9%
- 2008→2024 swing
- +0.9pp no change · 2008: -15.5pp · 2024: -14.6pp
- All cycles
- 2024: R+14.6 2020: R+10.5 2016: R+17.5 2012: R+16.0 2008: R+15.5
Not yet ingested
- Civics
- —
Market trends
- HPI YoY
- ▼ -131.42%
- Current HPI
- 248.8406
- Rent YoY
- ▲ 1.45%
- Metro
- Charleston-North Charleston, SC
- State GDP YoY
- ▲ 4.51%
- F500 in state
- 2
Industry mix (Fortune 500 HQ in SC)
| Industry | F500 HQs | Revenue |
|---|---|---|
| Packaging | 1 | $7B |
|
||
Price history
+1024.6% since first listed7 events — show timeline
- 2026-06-13 Listed $269,900 Charleston Trident MLS
- 2024-06-13 Sold (Public Records) $290,000 Public Records
- 2024-06-12 Sold (MLS) $290,000 Charleston Trident MLS
- 2024-05-26 Contingent — Charleston Trident MLS
- 2024-05-24 Listed $290,000 Charleston Trident MLS
- 2003-05-27 Sold (Public Records) $30,000 Public Records
- 2001-02-20 Sold (Public Records) $24,000 Public Records
Property tax history
+20.8%/yrLatest (2025): $6,390 · -8.4% YoY. Source: county tax records.
Cash-flow waterfall
monthlySold comps — $/sqft
last 12 mo · ≤1 miLoading sold comps…