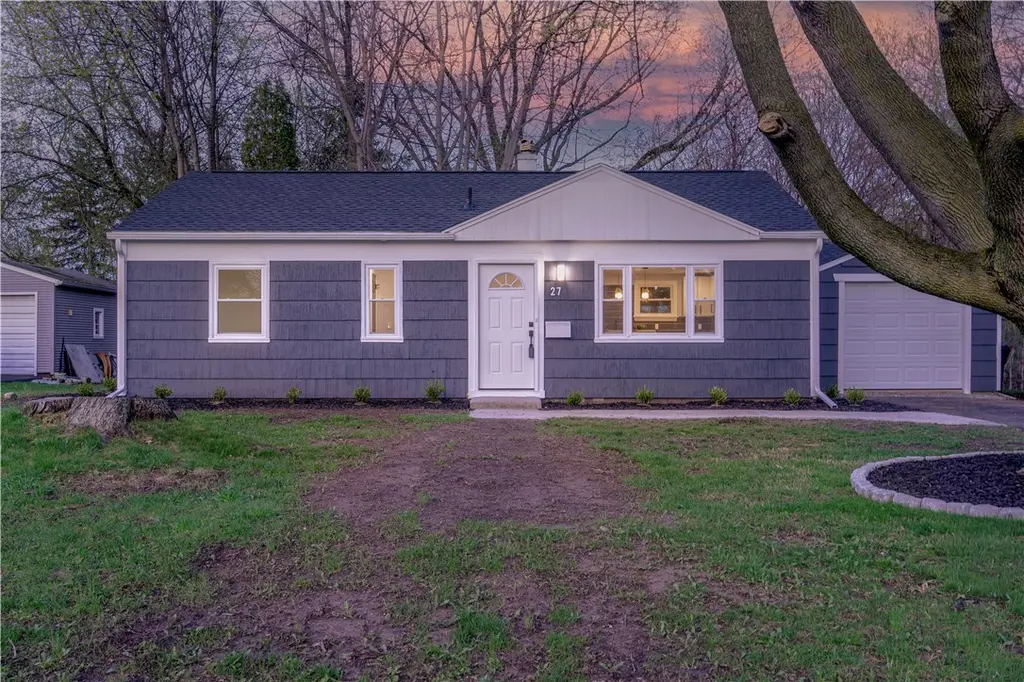
27 Pasadena Dr · Gates, NY
Flood risk 1/10 · Minimal
- FEMA flood zone
- X (unshaded)
- Chance of flooding over 30 yrs
- 0.0%
- Est. flood insurance / yr
- $507 – $1,088
Fire risk 1/10 · Minimal
- Est. fire insurance / yr
- $691 – $1,283
Heat risk 2/10 · Minimal
- Hot days now (above 95°F)
- 7 days/yr
- Hot days in 30 yrs
- 15 days/yr
Wind risk 1/10 · Minimal
- Chance of severe wind over 30 yrs
- —
Air-quality risk 2/10 · Minimal
- Unhealthy air days now
- 1 days/yr
- Unhealthy air days in 30 yrs
- 2 days/yr
Risk factors via First Street. Map © Google.
Why this score? — see what drove the D grade
The composite is a weighted blend of 9 inputs, each scored 0–100. Each bar is that input's sub-score; the figure is the points it added to the 100-point composite (weight × sub-score).
- ARV discount +15.0/15.0
- Cash flow +7.1/30.0
- 1% rule +5.6/10.0
- Rent growth +4.1/5.0
- Schools +3.6/10.0
- Livability +3.4/5.0
- Condition / age +2.5/5.0
- DSCR +1.3/10.0
- Appreciation +0.0/10.0
$169,900
🖨 Deal sheet (PDF) 📄 Offer letter ✓ Due diligence
Listing remarks
* * Charming Ranch Home on a Quiet Street * * Welcome to your dream home! Nestled on a tranquil street, this beautifully remodeled three-bedroom, one-bathroom residence offers an inviting open floor plan perfect for modern living. Step inside to discover a brand-new kitchen featuring sleek modern cabinets, luxurious quartz countertops, and a convenient breakfast bar, complete with brand-new appliances. The stylish luxury vinyl flooring flows seamlessly throughout the living spaces, enhancing the home's contemporary feel. The remodeled bathroom boasts all new fixtures and finishes, including a stunning tiled tub surround. With a new roof, furnace, windows, garage door and a freshly pav
Key facts
- Ranch home
- Remodeled bathroom
- Remodeled kitchen
Tags
Property features AI
Exterior
- Parking: Detached garage (1 car)
- Utilities: Public water connected; Sewer connected
- Home design: Single-story home; Existing/resale property
- Construction: Cedar construction
- Exterior features: Blacktop driveway; Rectangular residential lot (70 x 126)
Interior
- Kitchen: Dishwasher; Electric oven; Electric range; Microwave; Quartz counters; Breakfast bar
- Bedrooms: 3 bedrooms on the main level
- Flooring: Luxury vinyl
- Bathrooms: 1 full bathroom on the main level
- Heating & cooling: Gas forced-air heating
- Interior features: Breakfast bar; Quartz counters; Bedroom on main level
- Laundry & utility: Main level laundry; Gas water heater
Neighborhood map
What this means for you Summary
Snapshot
- This is a 3-bed/1.0-bath single-family listed at $170k.
Deal economics
- At list price, monthly cash flow is $-239 ($-3k/yr) — negative.
- To cash-flow at today's rent, offer at most $169k (0.4% below list).
- Meets the 1% rule at list price ($2k rent vs $170k).
- Recommended offer: $169k (0.4% below list) — sets the bar for cash-flow.
- Cap rate 4.6% vs local median 5.9% in Gates — below-typical yield; the buyer is paying a premium for something (appreciation thesis, condition, location) that the cap rate doesn't capture.
Location & tenants
- Location reads 67/100 on livability (#582 in NY) — a middle-class / working-renter tenant base. Strengths: housing A+, health & safety A+; Watch: amenities F, commute F.
- Gates-Chili Central School District (suburban): math 41% / reading 42% proficiency, ranked #491 of 590 in NY (top 83%) — families likely to look elsewhere, expect single-tenant / working-renter base with shorter leases.
- Zoned schools: Walt Disney School (math 17% / reading 42%, grade F, #1,729 of 2,108 statewide, top 84%, 411 students, 54% FRL); Gates-Chili Middle School (math 25% / reading 40%, grade F, #504 of 729 statewide, top 70%, 854 students, 58% FRL); Gates-Chili High School (math 92% / reading 70%, grade A, #495 of 1,100 statewide, top 46%, 1,132 students, 55% FRL) — zoned schools average 56% FRL vs 31% district-wide (25 pts higher); higher-poverty schools than district average — tighter screening recommended.
- Market conditions: Rents rising fast (+6.3%/yr); 124 active listings in the ZIP; 2 comparable units currently listed for rent nearby; 1,169 units permitted in Monroe County in 2024 (591 in 5+ unit buildings).
- This rent runs 39% of the median local income ($56k/yr) — at the standard rent-burdened threshold; future hikes will face affordability resistance.
Forward outlook
- Local home prices are declining (-3.0%/yr); year-one equity from $1k of loan paydown is wiped out by about $5k of value loss. Plan a longer hold.
- Monroe County population projected to shrink 6% by 2050 — rents likely to lag national; underwrite the cash flow, not the appreciation.
Negotiation context
- Only 11 days on market — expect competitive offers; lowballing is unlikely to land.
- 2 sale attempts with the ask held roughly flat each time — persistent listings suggest the price (not the market) is what's stuck; bring a comps-based counter.
Risks & watch-outs
- Watch-outs: property tax is 5.0% of price; built in 1951 — expect roof / HVAC / electrical / plumbing capex.
Questions for the listing agent
- What do current leases actually rent for vs. the listed asking? Can we see a recent rent roll and the last 12 months of T-12 income?
- Built in 1951 — when were the roof, HVAC, electrical panel, plumbing, and water heater last replaced?
- Property tax is high relative to price — has the assessment been appealed recently, and will the sale trigger a re-assessment?
- Is there a deadline driving the sale (1031 exchange, divorce, estate, relocation)? That informs how much negotiation room exists.
- Schools are B-rated — typically a magnet for longer-tenancy family renters. What's the average tenant stay here, and is there a school-zone premium baked into asking?
- The area grade is low — what's the realistic commute time and amenity access for the typical tenant pool here? Any planned neighborhood developments (good or bad) we should know about?
- What's the average days-on-market for RENTAL listings here right now (not sales)? A rising rental-DOM trend means longer vacancies and softer asking-rent achievability than the comps imply.
- What's the recent tenant-quality profile in this submarket — average credit score on applications, eviction rate, late-payment / NSF rate, and stable-employment percentage? A property-management company in the area should have these aggregated.
- How much new for-sale + rental construction is in the pipeline within 1–3 miles? Heavy new supply typically softens prices + rents 12–24 months out; constrained supply supports both.
Investment metrics
- 1% rule
- 1.06% ✓
- Cap rate
- 4.61%
- Cash-on-cash
- -6.03%
- DSCR
- 0.73
- GRM
- 7.8
CMA / ARV
- ARV (median comp)
- $205,649
- List price
- $169,900
- Delta
- -17.38%
- Verdict
- UNDERPRICED
- Comps
- 20 within 1.0 mi
Show comp detail 12 sales within ~0.75 mi
| Address | Dist | Beds/Ba | Sqft | Sold | Price | $/sf | Match |
|---|---|---|---|---|---|---|---|
| 20 Fairchild Rd | 0.13mi | 4/1.0 (+1) | 1,346 (-6%) | 4mo | $203,000 | $151 | 75 |
| 41 Simmons St | 0.35mi | 3/1.0 | 1,325 (-8%) | 7mo | $260,000 | $196 | 64 |
| 38 Debby Ln | 0.46mi | 3/1.0 | 1,528 (+6%) | 6mo | $200,000 | $131 | 63 |
| 11 Hedge St | 0.39mi | 3/1.0 | 1,314 (-9%) | 7mo | $150,000 | $114 | 62 |
| 87 Bru Mar Dr | 0.57mi | 3/2.0 | 1,364 (-5%) | 1mo | $305,000 | $224 | 60 |
| 87 Simmons St | 0.40mi | 4/1.5 (+1) | 1,520 (+6%) | 7mo | $175,000 | $115 | 59 |
| 178 Ardella St | 0.24mi | 4/1.0 (+1) | 1,246 (-13%) | 4mo | $240,000 | $193 | 58 |
| 41 Shadywood Dr | 0.71mi | 3/1.5 | 1,496 (+4%) | 2mo | $255,000 | $170 | 57 |
| 34 Evelyn St | 0.59mi | 3/1.5 | 1,318 (-8%) | 1mo | $220,000 | $167 | 56 |
| 81 Spencerport Rd | 0.34mi | 3/1.0 | 1,231 (-14%) | 5mo | $222,000 | $180 | 56 |
| 2525 Lyell Rd | 0.38mi | 3/2.0 | 1,634 (+14%) | 3mo | $285,000 | $174 | 53 |
| 67 Colwick Rd | 0.69mi | 4/1.0 (+1) | 1,297 (-10%) | 2mo | $200,000 | $154 | 45 |
Match score weights: distance 35% · size 25% · config 20% · recency 20%. Top-matched comps best support the ARV.
Projected returns pro-forma
-3.0% appreciation · 6.28% rent growth · sell at horizon
- IRR
- -21.1%
- Equity multiple
- 0.24×
- Total profit
- $-36,258
- Equity at exit
- $25,333
- IRR
- -6.2%
- Equity multiple
- 0.52×
- Total profit
- $-22,782
- Equity at exit
- $14,690
Cash invested: $47,572 (down + closing). Projections, not guarantees.
Landlord ↔ Tenant lean methodology
- Overall (STATE)
- 15 Strongly Tenant-Friendly
- State New York
- 15 Strongly Tenant-Friendly · D+10
- County
- — inherits STATE
- City
- — inherits STATE
ZIP-level market 14606
- Home prices YoY
- -17.9%
- Rents YoY
- 6.3%
- Active inventory
- 124
- Price-to-rent
- 7.8×
Monthly cashflow live
- Estimated rent
- $1,807 medium interval (Pro) →
- Mortgage (P&I)
- −$891
- Tax from tax record
- −$705 /mo · $8,461/yr
- Insurance
- −$71
- HOA
- −$0
- Vacancy / Maint / Mgmt
- −$380
- Net cashflow
- $-239
Break-even live
Sensitivity live
| Price | -10% $371 | -5% $312 | +0% $-239 | +5% $-287 | +10% $-335 |
|---|---|---|---|---|---|
| Rent | -10% $-382 | -5% $-310 | +0% $-239 | +5% $-168 | +10% $-96 |
| Rate | -1.0pp $-153 | -0.5pp $-196 | base $-239 | +0.5pp $-283 | +1.0pp $-328 |
UW: 25.0% down · 7.5% · 30yr · 1.5% tax · 5.0% vac · 8.0% maint · 8.0% mgmt
Financing live
Cash to close
- Down payment
- $42,475
- Closing costs
- $5,097
- Reserves months
- —
- Total cash needed
- —
Loan-product check · same deal, 3 products live
Conventional
25% down · 7.5% · 30yr
- Down + closing
- —
- Monthly P&I
- —
- Monthly cashflow
- —
- DSCR
- —
- Eligible?
- —
Personal DTI + credit; lowest rate.
DSCR
20% down · 8.5% · 30yr
- Down + closing
- —
- Monthly P&I
- —
- Monthly cashflow
- —
- DSCR
- —
- Eligible?
- —
No personal income docs; deal must DSCR.
Hard money
10% down · 12.0% · 12mo
- Down + closing
- —
- Monthly P&I
- —
- Monthly cashflow
- —
- DSCR
- —
- Eligible?
- —
Short-term bridge; refi at stabilization.
Rent comps 2 comps
| Address | Beds | Baths | Sqft | Rent | $/sqft | DOM | Units | Dist |
|---|---|---|---|---|---|---|---|---|
| 155 Canal Landing Blvd Rochester, NY | 1.0–3.0 | 1.5–2.0 | 1174 | $2,050 | $1.75 | 4d | 5 | 1.12mi |
| 19 Garland Ave Rochester, NY | 3.0 | 1.0 | 1104 | $1,850 | $1.68 | 4d | 1 | 1.43mi |
Listing history 4 events
-
2026-05-12$169,900 Active 1143-char remark
-
2026-04-29status Pending
-
2026-04-28historical
-
2026-04-19$169,900 Active
ⓘ Source: listings_history table (triggers on properties + properties_extension) + one-shot
backfill from property_details.listing_events for pre-trigger history.
Tax reassessment forecast NY · Partial reset (capped growth)
- Current annual tax
- $8,461 · $705/mo
- Projected year-2 tax
- $8,461 · $705/mo
- Expected delta
- $0/yr ($0/mo · 0.0%)
ⓘ Screening estimate from a state-policy table — verify with the county assessor before closing.
Climate risk First Street
- Flood 1/10 Low FEMA zone X (unshaded) · 0% chance over 30 yrs
- Wildfire 1/10 Low
- Heat 2/10 Low 7 d/yr ≥95°F today · 15 d/yr by 30 yrs out
- Wind 1/10 Low
- Air quality 2/10 Low 1 unhealthy d/yr today · 2 by 30 yrs out
Nearby sold comps map
Loading sold comps map…
Walkable amenities ~0.75 mi
Loading nearby amenities…
Taxation est. · year 1
- Rental income
- $21,689
- − Mortgage interest
- −$9,517
- − Property taxes
- −$8,461
- − Insurance
- −$850
- − Repairs & maintenance
- −$1,735
- − Management
- −$1,735
- − Depreciation
- −$4,943
- Taxable loss
- −$5,551
- Est. tax savings @ 24.0%
- +$1,332
- After-tax cash flow
- $-1,535/yr
For passive investors: Depreciation is non-cash, so a rental often shows a tax loss while cash-flowing — sheltering income. Rental losses are passive: they offset passive income freely, and up to $25,000/yr can offset ordinary (W-2) income if you actively participate and your MAGI is under $100k (phasing out to $0 by $150k); unused losses carry forward. On sale, claimed depreciation is recaptured at up to 25%, and gains may owe capital-gains tax (a 1031 exchange can defer both). Figures are a year-1 estimate at your 24.0% rate — not tax advice; consult a CPA.
Schools (NCES district)
- District
- Gates-Chili Central School District
- NCES district ID
- 3611880
- Math proficiency
- 41% ▼ -12.00%
- Reading proficiency
- 42% ▼ -6.00%
- Median HH income
- $55,045
- Composite
- 36.23/100
- National rank
- #4719
- State rank
- #491 of 590 in NY
Livability — Gates
- Score
- 67/100
- State rank
- #582
- US rank
- #10531
Category grades
Schools grade is shown separately in the Schools card above.
Census & demographics
- Census place
- Gates, NY
- County
- Monroe County · 674,131 people
- City population
- 432,803
- Metro
- Rochester, NY
- Population (ZIP)
- 25,538
- Household income
- $55,807
- Rent vs Own
- Severe rent burden
- 986.0
Population outlook (Monroe County) Hauer SSP2
- Today (2025)
- 759,460 people
- By 2030
- 757,154 · -0.3%
- By 2040
- 740,644 · -2.5%
- By 2050
- 714,443 · -5.9%
- By 2075
- 645,883 · -15.0%
- By 2100
- 547,084 · -28.0%
Race, ethnicity, and origin ACS 2023
- Neighborhood character
- Diverse neighborhood (Simpson 0.64)
- Race & ethnicity
- White 51% Black 26% Hispanic / Latino 17% Two or more races 8% Asian 3%
- Hispanic origin (detail)
- Puerto Rican 12% Cuban 2%
- Common ancestry
- Romanian 3% Lithuanian 1% Iranian 1%
- Foreign-born
- 10% · Canada, Vietnam, Philippines
- Languages at home
- 79% English-only · Spanish 12% Other Indo-European 3% Other Asian/Pacific 2%
Political lean MEDSL · Monroe
- 2024 margin
- D (+19.1) · D 59.5% · R 40.5%
- 2008→2024 swing
- +1.4pp toward D · 2008: 17.7pp · 2024: 19.1pp
- All cycles
- 2024: D+19.1 2020: D+21.0 2016: D+14.1 2012: D+17.4 2008: D+17.7
Not yet ingested
- Civics
- —
Market trends
- HPI YoY
- ▼ -62.59%
- Current HPI
- 287.6868
- Rent YoY
- ▲ 6.28%
- Metro
- Rochester, NY
- State GDP YoY
- ▲ 2.60%
- F500 in state
- 92
Industry mix (Fortune 500 HQ in NY)
| Industry | F500 HQs | Revenue |
|---|---|---|
| Financial Services | 10 | $950B |
|
||
| Consumer Goods | 9 | $162B |
|
||
| Insurance | 4 | $225B |
|
||
| Telecommunications | 2 | $144B |
|
||
| Pharmaceuticals | 2 | $112B |
|
||
| Media / Entertainment | 2 | $69B |
|
||
Price history
+0.0% since first listed5 events — show timeline
- 2026-05-23 Pending — UNYREIS
- 2026-05-12 Listed $169,900 UNYREIS
- 2026-04-29 Pending — UNYREIS
- 2026-04-28 Listing Removed — UNYREIS
- 2026-04-19 Listed $169,900 UNYREIS
Property tax history
+7.3%/yrLatest (2025): $8,461 · +18.0% YoY. Source: county tax records.
Cash-flow waterfall
monthlySold comps — $/sqft
last 12 mo · ≤1 miLoading sold comps…