412 Newton Dr · Midfield, AL
Flood risk 1/10 · Minimal
- FEMA flood zone
- X (unshaded)
- Chance of flooding over 30 yrs
- 0.0%
- Est. flood insurance / yr
- $507 – $1,088
Fire risk 1/10 · Minimal
- Est. fire insurance / yr
- $916 – $1,700
Heat risk 6/10 · Moderate
- Hot days now (above 108°F)
- 6 days/yr
- Hot days in 30 yrs
- 16 days/yr
Wind risk 6/10 · Moderate
- Chance of severe wind over 30 yrs
- 27.0%
Air-quality risk 4/10 · Minor
- Unhealthy air days now
- 5 days/yr
- Unhealthy air days in 30 yrs
- 5 days/yr
Risk factors via First Street. Map © Google.
Why this score? — see what drove the D+ grade
The composite is a weighted blend of 9 inputs, each scored 0–100. Each bar is that input's sub-score; the figure is the points it added to the 100-point composite (weight × sub-score).
- Cash flow +21.1/30.0
- DSCR +6.7/10.0
- ARV discount +5.8/15.0
- 1% rule +5.1/10.0
- Livability +3.2/5.0
- Appreciation +2.6/10.0
- Condition / age +2.5/5.0
- Rent growth +2.1/5.0
- Schools +0.7/10.0
$120,000
🖨 Deal sheet 📄 Offer letter ✓ Due diligence
Listing remarks MLS
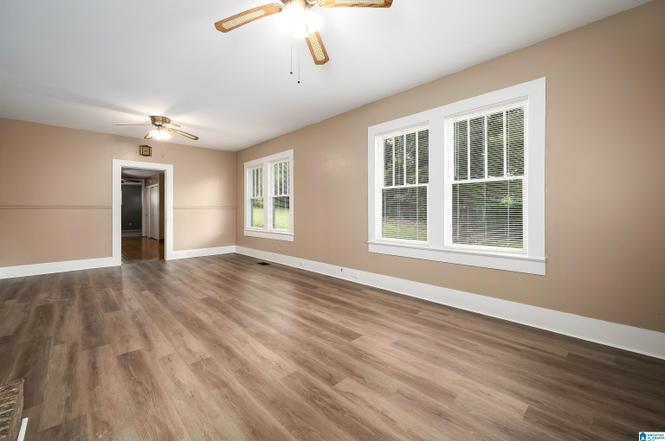
Check out this great opportunity in Midfield. This is a three bed two bath one level home that is waiting on you to make it your own. Enjoy a large living room and an additional den as well as a glassed in front porch. Off street parking in your private driveway and a storage building in the back yard.
Key facts
- Covered front porch
- Natural light
- 6,969 sq ft lot
Tags
Property features AI
Exterior
- Parking: Assigned parking
- Security: No security features listed
- Utilities: Public water; Connected sewer; Electric water heater; Internet service availability unknown
- Home design: Existing single-family construction (wood siding); Crawl space foundation
- Construction: Wood siding exterior
- Exterior features: Screened porch; Open porch; Storage building; No pool, patio, decks, or garden/patio listed; Not waterfront
Interior
- Kitchen: Laminate countertops; Refrigerator; Electric stove
- Bedrooms: Bedroom on main level
- Flooring: Hardwood and laminate floors
- Bathrooms: Two full bathrooms; One bathroom includes a jetted tub
- Heating & cooling: Electric heating; Electric cooling
- Interior features: 9+ foot ceilings; One wood-burning fireplace with brick surround in the family room; Attic with pull-down access; No additional interior amenities listed
- Laundry & utility: Main-level laundry room; Washer hookup; Electric dryer hookup
Neighborhood map
What this means for you Summary
Snapshot
- This is a 3-bed/2.5-bath single-family listed at $120k.
Deal economics
- At list price, monthly cash flow is $171 ($2k/yr) — positive.
- The deal already cash-flows at list — no discount required.
- Meets the 1% rule at list price ($1k rent vs $120k).
Location & tenants
- Location reads 64/100 on livability (#164 in AL) — a middle-class / working-renter tenant base. Strengths: commute A+, cost of living A+, housing A+; Watch: amenities F, employment F, health & safety F.
- Midfield City (suburban): math 2% / reading 14% proficiency, ranked #126 of 129 in AL (top 98%) — low school quality limits family demand, transient renter base, plan for 1-2y turnover; 83% free/reduced lunch — lower-income household profile, screen leases tightly.
- Zoned schools: Midfield Elementary School (math 2% / reading 17%, grade F, #568 of 627 statewide, top 94%, 390 students, 84% FRL); Midfield High School (math 2% / reading 2%, grade F, #291 of 305 statewide, top 100%, 340 students, 87% FRL) — zoned schools at 86% FRL track the district average.
- Market conditions: Rents soft (-1.5%/yr); 87 active listings in the ZIP; 34 comparable units currently listed for rent nearby; rentals at typical pace (median 22d on market — plan ~3-4 weeks tenant-placement turnaround); 2,114 units permitted in Jefferson County in 2024 (556 in 5+ unit buildings).
Forward outlook
- Local home prices are declining (-3.0%/yr); year-one equity from $830 of loan paydown is wiped out by about $4k of value loss. Plan a longer hold.
- Jefferson County population projected to shrink 4% by 2050 — rents likely to lag national; underwrite the cash flow, not the appreciation.
Negotiation context
- Only 2 days on market — expect competitive offers; lowballing is unlikely to land.
- 3 sale attempts since 2y ago with the ask held roughly flat each time — persistent listings suggest the price (not the market) is what's stuck; bring a comps-based counter.
- Current owner paid $62k; list at $120k implies a 94% gain — meaningful room to come down on a strong offer.
Risks & watch-outs
- Watch-outs: built in 1941 — expect roof / HVAC / electrical / plumbing capex.
- Climate carrying-cost: major wind risk, 27% chance of damaging wind over 30y; extreme-heat days projected 6→16/yr by 2055 (HVAC capex compounding) — expect insurance premiums to compound above CPI over the hold.
Questions for the listing agent
- Built in 1941 — when were the roof, HVAC, electrical panel, plumbing, and water heater last replaced?
- Is there a deadline driving the sale (1031 exchange, divorce, estate, relocation)? That informs how much negotiation room exists.
- Schools are F-rated, which usually means shorter tenancies and higher turnover. Who's the typical renter profile here, and what's been the actual vacancy rate?
- The area grade is low — what's the realistic commute time and amenity access for the typical tenant pool here? Any planned neighborhood developments (good or bad) we should know about?
- What's the average days-on-market for RENTAL listings here right now (not sales)? A rising rental-DOM trend means longer vacancies and softer asking-rent achievability than the comps imply.
- What's the recent tenant-quality profile in this submarket — average credit score on applications, eviction rate, late-payment / NSF rate, and stable-employment percentage? A property-management company in the area should have these aggregated.
- How much new for-sale + rental construction is in the pipeline within 1–3 miles? Heavy new supply typically softens prices + rents 12–24 months out; constrained supply supports both.
Investment metrics
- 1% rule
- 1.01% ✓
- Cap rate
- 8.00%
- Cash-on-cash
- 6.11%
- DSCR
- 1.27
- GRM
- 8.3
CMA / ARV
- ARV (on-the-fly)
- $115,752
- Comps found
- 12
Show comp detail 12 sales within ~0.75 mi
| Address | Dist | Beds/Ba | Sqft | Sold | Price | $/sf | Match |
|---|---|---|---|---|---|---|---|
| 506 Westfield Dr | 0.18mi | 3/2.0 | 1,548 (+4%) | 8mo | $120,000 | $78 | 75 |
| 716 Westfield Dr | 0.26mi | 3/1.5 | 1,541 (+4%) | 10mo | $155,000 | $101 | 69 |
| 617 8th Ave | 0.36mi | 4/2.0 (+1) | 1,436 (-3%) | 3mo | $85,000 | $59 | 68 |
| 801 Rutledge Dr | 0.22mi | 2/1.0 (-1) | 1,613 (+9%) | 3mo | $41,000 | $25 | 61 |
| 817 Oakland Dr | 0.28mi | 3/2.0 | 1,654 (+12%) | 7mo | $164,000 | $99 | 60 |
| 1120 9th Ave | 0.64mi | 3/1.0 | 1,437 (-3%) | 1mo | $72,900 | $51 | 58 |
| 812 7th Ave | 0.36mi | 3/2.0 | 1,319 (-11%) | 7mo | $179,000 | $136 | 57 |
| 204 Nolia St | 0.68mi | 3/2.0 | 1,607 (+8%) | 1mo | $60,000 | $37 | 52 |
| 821 Westfield Dr | 0.39mi | 4/2.0 (+1) | 1,642 (+11%) | 7mo | $181,000 | $110 | 51 |
| 1040 Glen Oak Dr | 0.37mi | 3/2.0 | 1,684 (+14%) | 9mo | $164,000 | $97 | 51 |
| 1117 Carol Cir | 0.71mi | 4/1.5 (+1) | 1,504 (+1%) | 8mo | $45,000 | $30 | 49 |
| 703 11th Ave | 0.56mi | 4/1.0 (+1) | 1,302 (-12%) | 1mo | $80,000 | $61 | 42 |
Match score weights: distance 35% · size 25% · config 20% · recency 20%. Top-matched comps best support the ARV.
Projected returns pro-forma
-3.0% appreciation · 0.0% rent growth · sell at horizon
- IRR
- -10.2%
- Equity multiple
- 0.64×
- Total profit
- $-12,100
- Equity at exit
- $17,892
- IRR
- -5.4%
- Equity multiple
- 0.70×
- Total profit
- $-10,225
- Equity at exit
- $10,375
Cash invested: $33,600 (down + closing). Projections, not guarantees.
Landlord ↔ Tenant lean methodology
- Overall (STATE)
- 90 Strongly Landlord-Friendly
- State Alabama
- 90 Strongly Landlord-Friendly · R+15
- County
- — inherits STATE
- City
- — inherits STATE
ZIP-level market 35228
- Home prices YoY
- -3.5%
- Rents YoY
- -1.5%
- Active inventory
- 87
- Price-to-rent
- 8.3×
Monthly cashflow live
- Estimated rent
- $1,207 high interval (Pro) →
- Mortgage (P&I)
- −$629
- Tax from tax record
- −$103 /mo · $1,241/yr
- Insurance
- −$50
- HOA
- −$0
- Vacancy / Maint / Mgmt
- −$254
- Net cashflow
- $171
Break-even live
UW: 25.0% down · 7.5% · 30yr · 1.5% tax · 5.0% vac · 8.0% maint · 8.0% mgmt
Financing live
Cash to close
- Down payment
- $30,000
- Closing costs
- $3,600
- Reserves months
- —
- Total cash needed
- —
Loan-product check · same deal, 3 products live
Conventional
25% down · 7.5% · 30yr
- Down + closing
- —
- Monthly P&I
- —
- Monthly cashflow
- —
- DSCR
- —
- Eligible?
- —
Personal DTI + credit; lowest rate.
DSCR
20% down · 8.5% · 30yr
- Down + closing
- —
- Monthly P&I
- —
- Monthly cashflow
- —
- DSCR
- —
- Eligible?
- —
No personal income docs; deal must DSCR.
Hard money
10% down · 12.0% · 12mo
- Down + closing
- —
- Monthly P&I
- —
- Monthly cashflow
- —
- DSCR
- —
- Eligible?
- —
Short-term bridge; refi at stabilization.
Rent comps 34 comps
| Address | Beds | Baths | Sqft | Rent | $/sqft | DOM | Units | Dist |
|---|---|---|---|---|---|---|---|---|
| 608 5th Ave Midfield, AL | 3.0 | 1.0 | 1241 | $795 | $0.64 | 21d | 1 | 0.13mi |
| 801 Rutledge Dr Birmingham, AL | 4.0 | 2.0 | 1808 | $1,600 | $0.88 | 2d | 1 | 0.20mi |
| 616 Rutledge Dr Birmingham, AL | 3.0 | 1.0 | 1416 | $1,095 | $0.77 | 21d | 1 | 0.25mi |
| 617 8th Ave Birmingham, AL | 4.0 | 2.0 | 1436 | $1,350 | $0.94 | 2d | 1 | 0.36mi |
| 733 Glen Ridge Dr Fairfield, AL | 3.0 | 1.0 | 1225 | $1,378 | $1.12 | 2d | 1 | 0.40mi |
| 605 10th Ave Birmingham, AL | 3.0 | 1.0 | 1060 | $850 | $0.80 | 44d | 1 | 0.48mi |
| 800 Fairfax Dr Fairfield, AL | 4.0 | 2.0 | 1200 | $1,650 | $1.38 | 2d | 1 | 0.51mi |
| 603 11th Ave Birmingham, AL | 3.0 | 1.0 | 1289 | $1,100 | $0.85 | 44d | 1 | 0.54mi |
| 412 Fairfax Dr Unit 436-10 Fairfield, AL | 2.0 | 1.0 | 888 | $890 | $1.00 | 10d | 1 | 0.54mi |
| 412 Fairfax Dr Unit 444-12 Fairfield, AL | 2.0 | 1.0 | 888 | $910 | $1.02 | 10d | 1 | 0.54mi |
| 412 Fairfax Dr Unit 400-1 Fairfield, AL | 2.0 | 1.5 | 935 | $1,175 | $1.26 | 3d | 1 | 0.54mi |
| 412 Fairfax Dr Unit 424-10 Fairfield, AL | 3.0 | 1.5 | 1035 | $1,275 | $1.23 | 12d | 1 | 0.54mi |
| 412 Fairfax Dr Unit 400-12 Fairfield, AL | 2.0 | 1.0 | 888 | $915 | $1.03 | 10d | 1 | 0.54mi |
| 412 Fairfax Dr Unit 416-11 Fairfield, AL | 2.0 | 1.5 | 935 | $975 | $1.04 | 3d | 1 | 0.54mi |
| 412 Fairfax Dr Unit 424-3 Fairfield, AL | 3.0 | 1.5 | 1035 | $1,200 | $1.16 | 10d | 1 | 0.54mi |
| 412 Fairfax Dr Unit 436-11 Fairfield, AL | 2.0 | 1.5 | 935 | $910 | $0.97 | 10d | 1 | 0.54mi |
| 806 12th Ave Birmingham, AL | 3.0 | 1.0 | 1262 | $1,075 | $0.85 | 44d | 1 | 0.60mi |
| 222 4th Ave Birmingham, AL | 3.0 | 1.0 | 1300 | $1,050 | $0.81 | 44d | 1 | 0.62mi |
| 226 3rd Ave Birmingham, AL | 4.0 | 2.0 | 1248 | $1,300 | $1.04 | 44d | 1 | 0.66mi |
| 1109 12th Ave Birmingham, AL | 4.0 | 2.0 | 1217 | $1,475 | $1.21 | 3d | 1 | 0.70mi |
| 1401 9th Ave Birmingham, AL | 3.0 | 2.0 | 1222 | $1,200 | $0.98 | 44d | 1 | 0.71mi |
| 925 Woodward Rd Birmingham, AL | 2.0 | 2.0 | 1104 | $950 | $0.86 | 44d | 1 | 0.79mi |
| 923 Woodward Rd Birmingham, AL | 3.0 | 1.0 | 1273 | $1,200 | $0.94 | 24d | 1 | 0.79mi |
| 1206 15th St Birmingham, AL | 3.0 | 1.0 | 1600 | $950 | $0.59 | 44d | 1 | 0.88mi |
| 832 Alden Ave Birmingham, AL | 4.0 | 2.0 | 1231 | $1,150 | $0.93 | 24d | 1 | 0.88mi |
| 80 Wilkes Cir Birmingham, AL | 4.0 | 2.0 | 1078 | $1,200 | $1.11 | 15d | 1 | 0.89mi |
| 63 Wilkes Cir Unit 1 Birmingham, AL | 4.0 | 1.0 | 1164 | $1,250 | $1.07 | 44d | 1 | 0.90mi |
| 63 Wilkes Cir Birmingham, AL | 4.0 | 1.0 | 1164 | $1,200 | $1.03 | 44d | 1 | 0.90mi |
| 6629 Grasselli Rd Fairfield, AL | 4.0 | 1.0 | 1114 | $1,295 | $1.16 | 44d | 1 | 1.12mi |
| 1565 Miles St Dolomite, AL | 3.0 | 2.0 | 1120 | $1,175 | $1.05 | 16d | 1 | 1.14mi |
| 6516 Millard Fuller Rd Fairfield, AL | 3.0 | 1.5 | 1120 | $950 | $0.85 | 3d | 1 | 1.17mi |
| 200 Woodward Dr Bessemer, AL | 3.0 | 1.0 | 900 | $1,123 | $1.25 | 2d | 1 | 1.28mi |
| 216 Pine St Bessemer, AL | 3.0 | 2.0 | 1000 | $1,200 | $1.20 | 44d | 1 | 1.40mi |
| 5624 Cairo Ave Birmingham, AL | 4.0 | 2.0 | 1386 | $1,200 | $0.87 | 44d | 1 | 1.47mi |
Listing history 3 events
-
2026-06-18days on market $120,000 Active 2 DOM
-
2026-06-16remarks 638-char remark
-
2026-06-16$120,000 Active 1 DOM
ⓘ Source: listings_history table (triggers on properties + properties_extension) + one-shot
backfill from property_details.listing_events for pre-trigger history.
Tax reassessment forecast AL · Resets to sale price
- Current annual tax
- $1,241 · $103/mo
- Projected year-2 tax
- $1,241 · $103/mo
- Expected delta
- $0/yr ($0/mo · 0.0%)
ⓘ Screening estimate from a state-policy table — verify with the county assessor before closing.
Climate risk First Street
- Flood 1/10 Low FEMA zone X (unshaded) · 0% chance over 30 yrs
- Wildfire 1/10 Low
- Heat 6/10 Major 6 d/yr ≥108°F today · 16 d/yr by 30 yrs out
- Wind 6/10 Major 27% chance of damaging wind over 30 yrs
- Air quality 4/10 Moderate 5 unhealthy d/yr today · 5 by 30 yrs out
Nearby sold comps map
Loading sold comps map…
Walkable amenities ~0.75 mi
Loading nearby amenities…
Taxation est. · year 1
- Rental income
- $14,487
- − Mortgage interest
- −$6,722
- − Property taxes
- −$1,241
- − Insurance
- −$600
- − Repairs & maintenance
- −$1,159
- − Management
- −$1,159
- − Depreciation
- −$3,491
- Taxable income
- $116
- Est. tax owed @ 24.0%
- −$28
- After-tax cash flow
- $2,025/yr
For passive investors: Depreciation is non-cash, so a rental often shows a tax loss while cash-flowing — sheltering income. Rental losses are passive: they offset passive income freely, and up to $25,000/yr can offset ordinary (W-2) income if you actively participate and your MAGI is under $100k (phasing out to $0 by $150k); unused losses carry forward. On sale, claimed depreciation is recaptured at up to 25%, and gains may owe capital-gains tax (a 1031 exchange can defer both). Figures are a year-1 estimate at your 24.0% rate — not tax advice; consult a CPA.
Schools (NCES district)
- District
- Midfield City
- NCES district ID
- 0102350
- Math proficiency
- 2% ▼ -18.00%
- Reading proficiency
- 14% ▼ -5.00%
- Median HH income
- $39,267
- Composite
- 6.89/100
- National rank
- #9978
- State rank
- #126 of 129 in AL
Livability — Midfield
- Score
- 64/100
- State rank
- #164
- US rank
- #14536
Category grades
Schools grade is shown separately in the Schools card above.
Census & demographics
- Census place
- Midfield, AL
- County
- Jefferson County · 527,445 people
- City population
- 10,216
- Metro
- Birmingham-Hoover, AL
- Population (ZIP)
- 10,216
- Household income
- $50,815
- Rent vs Own
- Severe rent burden
- 456.0
Population outlook (Jefferson County) Hauer SSP2
- Today (2025)
- 669,185 people
- By 2030
- 669,694 · +0.1%
- By 2040
- 661,388 · -1.2%
- By 2050
- 643,086 · -3.9%
- By 2075
- 577,267 · -13.7%
- By 2100
- 474,758 · -29.1%
Race, ethnicity, and origin ACS 2023
- Neighborhood character
- Predominantly Black (89%)
- Race & ethnicity
- Black 89% Hispanic / Latino 5% Two or more races 5% White 5%
- Foreign-born
- 2% · Canada
- Languages at home
- 95% English-only · Spanish 5%
Political lean MEDSL · Jefferson
- 2024 margin
- D (+10.4) · D 54.6% · R 44.2% · Other 1.2%
- 2008→2024 swing
- +5.4pp toward D · 2008: 5.1pp · 2024: 10.4pp
- All cycles
- 2024: D+10.4 2020: D+13.2 2016: D+7.2 2012: D+6.0 2008: D+5.1
Not yet ingested
- Civics
- —
Market trends
- HPI YoY
- ▼ -4.84%
- Current HPI
- 134.8633
- Rent YoY
- ▼ -1.47%
- Metro
- Birmingham-Hoover, AL
- State GDP YoY
- ▲ 2.94%
- F500 in state
- 4
Industry mix (Fortune 500 HQ in AL)
| Industry | F500 HQs | Revenue |
|---|---|---|
| Financial Services | 1 | $8B |
|
||
| Healthcare | 1 | $5B |
|
||
Price history
+84.9% since first listed7 events — show timeline
- 2026-06-16 Listed $120,000 Greater Alabama MLS
- 2025-01-28 Sold (Public Records) $62,000 Public Records
- 2025-01-24 Sold (MLS) $62,000 Greater Alabama MLS
- 2025-01-16 Contingent — Greater Alabama MLS
- 2025-01-13 Relisted — Greater Alabama MLS
- 2025-01-02 Contingent — Greater Alabama MLS
- 2024-12-20 Listed $64,900 Greater Alabama MLS
Property tax history
+9.3%/yrLatest (2025): $1,241 · -13.6% YoY. Source: county tax records.
Cash-flow waterfall
monthlySold comps — $/sqft
last 12 mo · ≤1 miLoading sold comps…