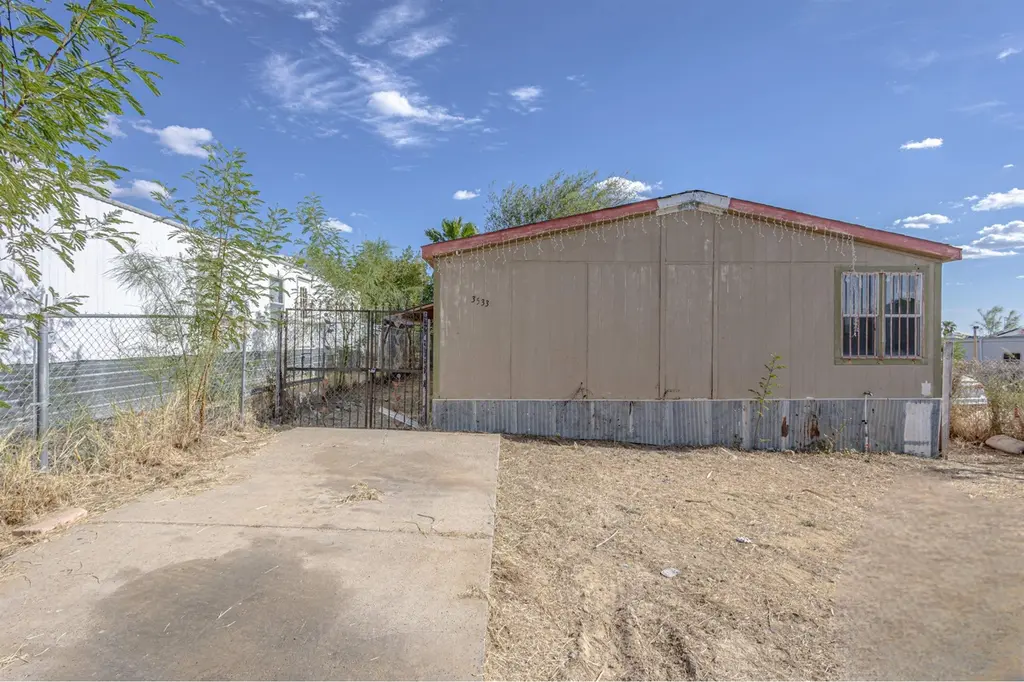
3533 Pericles Ln · Laredo, TX
Flood risk 1/10 · Minimal
- FEMA flood zone
- X (unshaded)
- Chance of flooding over 30 yrs
- 0.0%
- Est. flood insurance / yr
- $507 – $1,088
Fire risk 6/10 · Moderate
- Est. fire insurance / yr
- $1,222 – $2,270
Heat risk 8/10 · Major
- Hot days now (above 110°F)
- 7 days/yr
- Hot days in 30 yrs
- 22 days/yr
Wind risk 8/10 · Major
- Chance of severe wind over 30 yrs
- 80.0%
Air-quality risk 1/10 · Minimal
- Unhealthy air days now
- 0 days/yr
- Unhealthy air days in 30 yrs
- 0 days/yr
Risk factors via First Street. Map © Google.
Why this score? — see what drove the B- grade
The composite is a weighted blend of 9 inputs, each scored 0–100. Each bar is that input's sub-score; the figure is the points it added to the 100-point composite (weight × sub-score).
- Cash flow +30.0/30.0
- DSCR +10.0/10.0
- 1% rule +8.6/10.0
- ARV discount +7.5/15.0
- Livability +3.7/5.0
- Schools +2.8/10.0
- Rent growth +2.5/5.0
- Condition / age +2.5/5.0
- Appreciation +0.0/10.0
$105,000
🖨 Deal sheet (PDF) 📄 Offer letter ✓ Due diligence
Listing remarks
Mobile home for sale in Laredo, TX with owner financing available! This property features three bedrooms in 1,456 sq ft of living area with plenty of natural light. The primary suite includes a walk-in closet, along with a bathroom that has both a tub and a separate shower for added comfort. Offering great potential and convenience, it’s ideally located near schools, shopping, and dining, with quick access to major roads for an easy commute. Contact us today to schedule a showing!
Key facts
- Near schools
- Near dining
- Near shopping
Tags
Property features AI
Exterior
- Parking: Concrete parking
- Security: Smoke detectors
- Utilities: Public water; Underground utilities
- Home design: Single-story; Mobile home; Residential property; Zoned R-1MH
- Construction: Wood siding construction
- Exterior features: Chain link fencing; Level lot
Interior
- Kitchen: Electric water heater
- Flooring: Wood flooring
- Bathrooms: 2 full bathrooms
- Heating & cooling: Central heating (electric); Central air; Ceiling fans
- Interior features: Walk-in closets; Kitchen island
Neighborhood map
What this means for you Summary
Snapshot
- This is a 3-bed/2.0-bath manufactured listed at $105k.
Deal economics
- At list price, monthly cash flow is $511 ($6k/yr) — positive.
- The deal already cash-flows at list — no discount required.
- Meets the 1% rule at list price ($1k rent vs $105k).
- Recommended offer: $99k (6.0% below list) — sets the bar for market timing.
- Cap rate 12.1% vs local median 4.1% in Laredo — top-decile yield for the area; either an underpriced asset or a hidden risk that comps aren't pricing in. Stress-test before assuming the spread holds.
Location & tenants
- Location reads 73/100 on livability (#227 in TX) — a middle-class / working-renter tenant base. Strengths: cost of living A+, housing A+, health & safety A+; Watch: crime C-, employment D+, amenities F.
- United ISD (urban): math 27% / reading 38% proficiency, ranked #568 of 826 in TX (top 69%) — families likely to look elsewhere, expect single-tenant / working-renter base with shorter leases; 72% free/reduced lunch — lower-income household profile, screen leases tightly.
- Zoned schools: Franklin D Roosevelt El (math 22% / reading 27%, grade F, #3,052 of 4,322 statewide, top 74%, 653 students, 95% FRL); Los Obispos Middle (math 32% / reading 30%, grade F, #1,015 of 1,662 statewide, top 62%, 716 students, 94% FRL); Lyndon B Johnson (math 25% / reading 36%, grade F, #1,085 of 1,632 statewide, top 67%, 3,252 students, 91% FRL) — zoned schools average 93% FRL vs 72% district-wide (22 pts higher); higher-poverty schools than district average — tighter screening recommended.
- Market conditions: 489 active listings in the ZIP; 1 comparable units currently listed for rent nearby; 1,448 units permitted in Webb County in 2024 (245 in 5+ unit buildings).
Forward outlook
- Local home prices are declining (-3.0%/yr); year-one equity from $726 of loan paydown is wiped out by about $3k of value loss. Plan a longer hold.
- Webb County population projected at +23% by 2050 — long-run rental-demand tailwind backs the buy-and-hold thesis.
- At projected returns (-3.0% appreciation + 3.0% rent growth), your $29k cash investment doubles in ~6 years — after that, you're playing with house money.
Negotiation context
- It's been on market 63 days — a 6% lower offer ($99k) is reasonable based on typical stale-listing flexibility.
- 3 sale attempts since 2y ago with the ask held roughly flat each time — persistent listings suggest the price (not the market) is what's stuck; bring a comps-based counter.
Risks & watch-outs
- Climate carrying-cost: severe wind risk, 80% chance of damaging wind over 30y; major wildfire risk; extreme-heat days projected 7→22/yr by 2055 (HVAC capex compounding) — expect insurance premiums to compound above CPI over the hold.
Questions for the listing agent
- It's been on market 63 days. Have you received any prior offers? Is the seller open to a 6% concession, seller financing, or rate buy-down credit?
- Why hasn't it sold? Are there any deal-killer items the seller is aware of (foundation, flood, title, zoning, code violations)?
- Is there a deadline driving the sale (1031 exchange, divorce, estate, relocation)? That informs how much negotiation room exists.
- What's the average days-on-market for RENTAL listings here right now (not sales)? A rising rental-DOM trend means longer vacancies and softer asking-rent achievability than the comps imply.
- What's the recent tenant-quality profile in this submarket — average credit score on applications, eviction rate, late-payment / NSF rate, and stable-employment percentage? A property-management company in the area should have these aggregated.
- How much new for-sale + rental construction is in the pipeline within 1–3 miles? Heavy new supply typically softens prices + rents 12–24 months out; constrained supply supports both.
Investment metrics
- 1% rule
- 1.36% ✓
- Cap rate
- 12.13%
- Cash-on-cash
- 20.84%
- DSCR
- 1.93
- GRM
- 6.1
CMA / ARV
No comps found within radius.
Projected returns pro-forma
-3.0% appreciation · 3.0% rent growth · sell at horizon
- IRR
- 13.2%
- Equity multiple
- 1.53×
- Total profit
- $15,460
- Equity at exit
- $15,656
- IRR
- 22.0%
- Equity multiple
- 2.88×
- Total profit
- $55,149
- Equity at exit
- $9,078
Cash invested: $29,400 (down + closing). Projections, not guarantees.
Landlord ↔ Tenant lean methodology
- Overall (STATE)
- 87 Strongly Landlord-Friendly
- State Texas
- 87 Strongly Landlord-Friendly · R+5
- County
- — inherits STATE
- City
- — inherits STATE
ZIP-level market 78046
- Home prices YoY
- -13.0%
- Active inventory
- 489
- Price-to-rent
- 6.1×
Monthly cashflow live
- Estimated rent
- $1,424 medium interval (Pro) →
- Mortgage (P&I)
- −$551
- Tax from tax record
- −$20 /mo · $244/yr
- Insurance
- −$44
- HOA
- −$0
- Lot rent leased land?
- −$0
- Vacancy / Maint / Mgmt
- −$299
- Net cashflow
- $511
Break-even live
Sensitivity live
| Price | -10% $570 | -5% $540 | +0% $511 | +5% $481 | +10% $451 |
|---|---|---|---|---|---|
| Rent | -10% $398 | -5% $454 | +0% $511 | +5% $567 | +10% $623 |
| Rate | -1.0pp $563 | -0.5pp $537 | base $511 | +0.5pp $483 | +1.0pp $456 |
UW: 25.0% down · 7.5% · 30yr · 1.5% tax · 5.0% vac · 8.0% maint · 8.0% mgmt
Financing live
Cash to close
- Down payment
- $26,250
- Closing costs
- $3,150
- Reserves months
- —
- Total cash needed
- —
Loan-product check · same deal, 3 products live
Conventional
25% down · 7.5% · 30yr
- Down + closing
- —
- Monthly P&I
- —
- Monthly cashflow
- —
- DSCR
- —
- Eligible?
- —
Personal DTI + credit; lowest rate.
DSCR
20% down · 8.5% · 30yr
- Down + closing
- —
- Monthly P&I
- —
- Monthly cashflow
- —
- DSCR
- —
- Eligible?
- —
No personal income docs; deal must DSCR.
Hard money
10% down · 12.0% · 12mo
- Down + closing
- —
- Monthly P&I
- —
- Monthly cashflow
- —
- DSCR
- —
- Eligible?
- —
Short-term bridge; refi at stabilization.
Rent comps 1 comps
| Address | Beds | Baths | Sqft | Rent | $/sqft | DOM | Units | Dist |
|---|---|---|---|---|---|---|---|---|
| 4305 Alina Dr Laredo, TX | 3.0 | 2.5 | 1736 | $1,850 | $1.07 | 46d | 1 | 1.09mi |
Listing history 23 events
-
2026-06-22days on market $105,000 Active 63 DOM
-
2026-06-21days on market $105,000 Active 62 DOM
-
2026-06-19days on market $105,000 Active 60 DOM
-
2026-06-18days on market $105,000 Active 59 DOM
-
2026-06-17days on market $105,000 Active 58 DOM
-
2026-06-16days on market $105,000 Active 57 DOM
-
2026-06-15days on market $105,000 Active 56 DOM
-
2026-06-14days on market $105,000 Active 54 DOM
-
2026-06-13days on market $105,000 Active 53 DOM
-
2026-06-10days on market $105,000 Active 51 DOM
-
2026-06-09days on market $105,000 Active 50 DOM
-
2026-06-08days on market $105,000 Active 49 DOM
-
2026-06-07days on market $105,000 Active 48 DOM
-
2026-06-03days on market $105,000 Active 44 DOM
-
2026-06-02days on market $105,000 Active 43 DOM
-
2026-06-01days on market $105,000 Active 42 DOM
-
2026-05-31days on market $105,000 Active 41 DOM
-
2026-05-30days on market $105,000 Active 40 DOM
-
2026-04-20$105,000 Active 491-char remark
-
2025-08-20$115,000 Active
-
2024-04-23historical $1,200
-
2024-04-13$1,200
-
2022-03-10soldstatus
ⓘ Source: listings_history table (triggers on properties + properties_extension) + one-shot
backfill from property_details.listing_events for pre-trigger history.
Tax reassessment forecast TX · Resets to sale price
- Current annual tax
- $244 · $20/mo
- Projected year-2 tax
- $1,922 · $160/mo
- Expected delta
- +$1,677/yr (+$140/mo · 686.5%)
ⓘ Screening estimate from a state-policy table — verify with the county assessor before closing.
Climate risk First Street
- Flood 1/10 Low FEMA zone X (unshaded) · 0% chance over 30 yrs
- Wildfire 6/10 Major
- Heat 8/10 Severe 7 d/yr ≥110°F today · 22 d/yr by 30 yrs out
- Wind 8/10 Severe 80% chance of damaging wind over 30 yrs
- Air quality 1/10 Low 0 unhealthy d/yr today · 0 by 30 yrs out
Nearby sold comps map
Loading sold comps map…
Walkable amenities ~0.75 mi
Loading nearby amenities…
Taxation est. · year 1
- Rental income
- $17,094
- − Mortgage interest
- −$5,882
- − Property taxes
- −$244
- − Insurance
- −$525
- − Repairs & maintenance
- −$1,368
- − Management
- −$1,368
- − Depreciation
- −$3,055
- Taxable income
- $4,653
- Est. tax owed @ 24.0%
- −$1,117
- After-tax cash flow
- $5,011/yr
For passive investors: Depreciation is non-cash, so a rental often shows a tax loss while cash-flowing — sheltering income. Rental losses are passive: they offset passive income freely, and up to $25,000/yr can offset ordinary (W-2) income if you actively participate and your MAGI is under $100k (phasing out to $0 by $150k); unused losses carry forward. On sale, claimed depreciation is recaptured at up to 25%, and gains may owe capital-gains tax (a 1031 exchange can defer both). Figures are a year-1 estimate at your 24.0% rate — not tax advice; consult a CPA.
Schools (NCES district)
- District
- United ISD
- NCES district ID
- 4843650
- Math proficiency
- 27% ▼ -36.00%
- Reading proficiency
- 38% ▼ -11.00%
- Median HH income
- $47,780
- Composite
- 28.02/100
- National rank
- #6848
- State rank
- #568 of 826 in TX
Livability — Laredo
- Score
- 73/100
- State rank
- #227
- US rank
- #5399
Category grades
Schools grade is shown separately in the Schools card above.
Census & demographics
- Census place
- Laredo, TX
- City population
- 67,333
- Population (ZIP)
- 71,965
Population outlook (Webb County) Hauer SSP2
- Today (2025)
- 301,387 people
- By 2030
- 316,307 · +5.0%
- By 2040
- 345,636 · +14.7%
- By 2050
- 370,647 · +23.0%
- By 2075
- 413,907 · +37.3%
- By 2100
- 416,458 · +38.2%
Race, ethnicity, and origin ACS 2023
- Neighborhood character
- Predominantly Hispanic (97%)
- Race & ethnicity
- Hispanic / Latino 97% Two or more races 53% White 2%
- Hispanic origin (detail)
- Mexican 92%
- Foreign-born
- 22% · Canada
- Languages at home
- 9% English-only · Spanish 91%
Political lean MEDSL · Webb
- 2024 margin
- Toss-up / Even · D 48.5% · R 50.7%
- 2008→2024 swing
- -45.6pp toward R · 2008: 43.4pp · 2024: -2.2pp
- All cycles
- 2024: R+2.2 2020: D+23.3 2016: D+51.6 2012: D+54.0 2008: D+43.4
Not yet ingested
- Civics
- —
Market trends
- HPI YoY
- ▼ -29.36%
- Current HPI
- 196.8153
- Rent YoY
- —
- Metro
- —
- State GDP YoY
- ▲ 3.95%
- F500 in state
- 110
Industry mix (Fortune 500 HQ in TX)
| Industry | F500 HQs | Revenue |
|---|---|---|
| Energy | 16 | $1,198B |
|
||
| Technology | 5 | $198B |
|
||
| Engineering / Construction | 4 | $72B |
|
||
| Energy Services | 3 | $60B |
|
||
| Utilities | 3 | $41B |
|
||
| Healthcare | 2 | $330B |
|
||
Price history
+8650.0% since first listed5 events — show timeline
- 2026-04-20 Listed $105,000 LAOR
- 2025-08-20 Listed $115,000 LAOR
- 2024-04-23 Rental Removed $1,200 LAOR
- 2024-04-13 Listed for Rent $1,200 LAOR
- 2022-03-10 Sold (Public Records) — Public Records
Property tax history
-8.6%/yrLatest (2025): $244 · -4.2% YoY. Source: county tax records.
Cash-flow waterfall
monthlySold comps — $/sqft
last 12 mo · ≤1 miLoading sold comps…