 Duplex
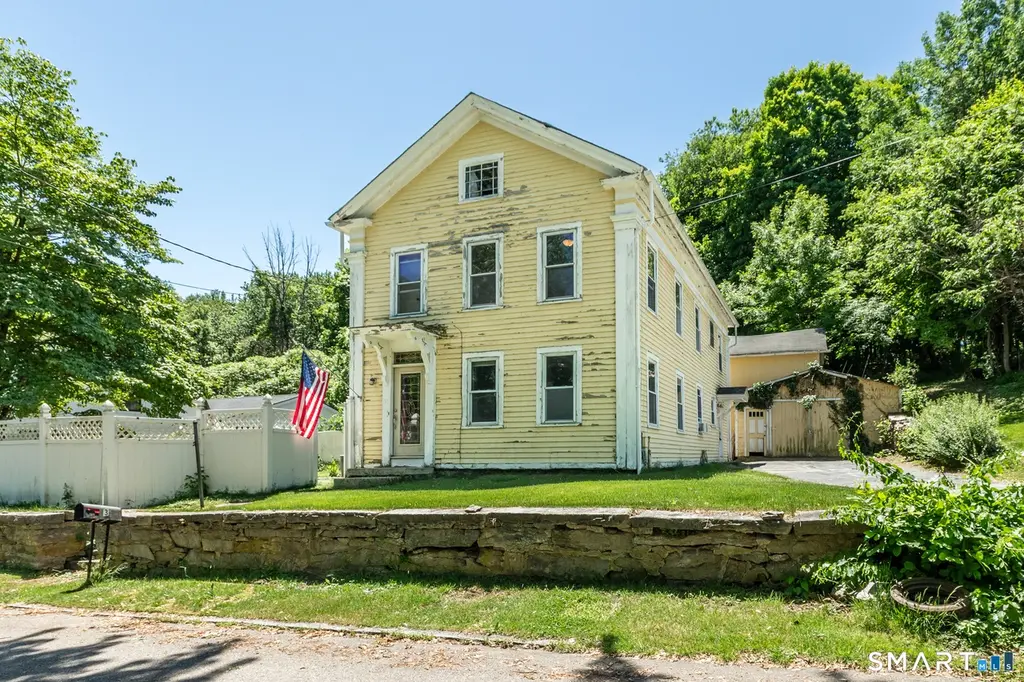
None · South Coventry, CT
Flood risk 1/10 · Minimal
- FEMA flood zone
- X
- Chance of flooding over 30 yrs
- 0.0%
- Est. flood insurance / yr
- $473 – $860
Fire risk 3/10 · Minor
- Est. fire insurance / yr
- $829 – $1,539
Heat risk 4/10 · Minor
- Hot days now (above 95°F)
- 7 days/yr
- Hot days in 30 yrs
- 16 days/yr
Wind risk 6/10 · Moderate
- Chance of severe wind over 30 yrs
- 48.0%
Air-quality risk 3/10 · Minor
- Unhealthy air days now
- 3 days/yr
- Unhealthy air days in 30 yrs
- 4 days/yr
Risk factors via First Street. Map © Google.
Why this score? — see what drove the B grade
The composite is a weighted blend of 9 inputs, each scored 0–100. Each bar is that input's sub-score; the figure is the points it added to the 100-point composite (weight × sub-score).
- Cash flow +26.7/30.0
- ARV discount +15.0/15.0
- DSCR +9.1/10.0
- 1% rule +7.1/10.0
- Schools +5.8/10.0
- Livability +3.5/5.0
- Rent growth +2.5/5.0
- Condition / age +2.5/5.0
- Appreciation +0.0/10.0
$275,000
🖨 Deal sheet 📄 Offer letter ✓ Due diligence
Multi-family units
County records classify this as Multi-Family (2-4 Unit). Listing-text estimate: 2 units. confirmed
Listing remarks
Opportunity awaits in this spacious two-family property set on a picturesque lot surrounded by mature trees and just moments from the Coventry lake. Offering a unique blend of character, outdoor space, and income potential, this property is ideal for owner-occupants, investors, or multi-generational living. The home features separate living spaces with generous room sizes, abundant natural light, and classic New England charm throughout. A detached outbuilding/garage provides additional storage or workshop potential, while the expansive yard offers room for gardening, recreation, and outdoor entertaining. Stone walls, terraced landscaping, and a fenced yard add to the property's appeal and
Key facts
- Income potential
- Picturesque lot
- Outdoor space
Tags
Property features AI
Exterior
- Parking: Detached garage; 2-car garage
- Utilities: Private well water; Public sewer connected; Electric service (standard)
- Home design: Multi-family property (2-family)
- Construction: Frame construction; Concrete foundation; Asphalt shingle roof; Living area approximately 1936 sq ft (public record)
- Exterior features: Stone wall; Patio; Located in a historic district; Clapboard siding
Interior
- Bedrooms: 5 bedrooms total
- Bathrooms: 2 full bathrooms
- Heating & cooling: Hot air heat; Oil and propane fuel; fuel tank located in basement; Hot water: other
- Interior features: Partial basement; Attic with hatch access; 11 total rooms; Two-unit layout (2-family)
Neighborhood map
What this means for you Summary
Snapshot
- This is a 2 × 2-bed/?-bath units multifamily listed at $275k.
Deal economics
- At list price, monthly cash flow is $740 ($9k/yr) — positive. Per door: $370/mo.
- The deal already cash-flows at list — no discount required.
- Meets the 1% rule at list price ($3k rent vs $275k).
Location & tenants
- Location reads 70/100 on livability (#97 in CT) — a middle-class / working-renter tenant base. Strengths: crime A+, employment A+, housing A+; Watch: health & safety D+, amenities F, commute F.
- Coventry School District (rural): math 57% / reading 71% proficiency, ranked #30 of 153 in CT (top 20%) — acceptable for families but not a draw, mixed tenant base, ~2y average lease; only 16% free/reduced lunch — higher-income household profile.
- Zoned schools: Coventry Grammar School (375 students, 24% FRL); Coventry Academy (18 students, 0% FRL) — zoned schools at 12% FRL track the district average.
- Market conditions: 59 active listings in the ZIP; 1 comparable units currently listed for rent nearby; 1,867 units permitted in Capitol Planning Region in 2024 (1,399 in 5+ unit buildings).
Forward outlook
- Local home prices are declining (-3.0%/yr); year-one equity from $2k of loan paydown is wiped out by about $8k of value loss. Plan a longer hold.
- At projected returns (-3.0% appreciation + 3.0% rent growth), your $77k cash investment doubles in ~10 years — after that, you're playing with house money.
Negotiation context
- Only 2 days on market — expect competitive offers; lowballing is unlikely to land.
- 4 sale attempts since 2y ago with the ask held roughly flat each time — persistent listings suggest the price (not the market) is what's stuck; bring a comps-based counter.
- Current owner paid $118k; list at $275k implies a 133% gain — meaningful room to come down on a strong offer.
Risks & watch-outs
- Watch-outs: built in 1840 — expect roof / HVAC / electrical / plumbing capex.
- Climate carrying-cost: major wind risk, 48% chance of damaging wind over 30y — expect insurance premiums to compound above CPI over the hold.
Questions for the listing agent
- Can we see the unit-by-unit rent roll, current vacancy, and any below-market leases? What's the average tenancy length?
- What capital expenditures (roof, boiler, parking lot, exteriors) have been made in the last 5 years, and what's planned in the next 2?
- Built in 1840 — when were the roof, HVAC, electrical panel, plumbing, and water heater last replaced?
- Is there a deadline driving the sale (1031 exchange, divorce, estate, relocation)? That informs how much negotiation room exists.
- Schools are A-rated — typically a magnet for longer-tenancy family renters. What's the average tenant stay here, and is there a school-zone premium baked into asking?
- What's the average days-on-market for RENTAL listings here right now (not sales)? A rising rental-DOM trend means longer vacancies and softer asking-rent achievability than the comps imply.
- What's the recent tenant-quality profile in this submarket — average credit score on applications, eviction rate, late-payment / NSF rate, and stable-employment percentage? A property-management company in the area should have these aggregated.
- How much new apartment / multifamily construction is in the pipeline within 1–3 miles? Heavy new supply (>2% of stock underway) typically softens rents 12–24 months out; light construction supports rent growth.
Investment metrics
- 1% rule
- 1.21% ✓
- Cap rate
- 9.52%
- Cash-on-cash
- 11.54%
- DSCR
- 1.51
- GRM
- 6.9
CMA / ARV
- ARV (median comp)
- $419,643
- List price
- $275,000
- Delta
- -10.64%
- Verdict
- UNDERPRICED
- Comps
- 2 within 1.0 mi
Projected returns pro-forma
-3.0% appreciation · 3.0% rent growth · sell at horizon
- IRR
- 0.9%
- Equity multiple
- 1.03×
- Total profit
- $2,624
- Equity at exit
- $41,003
- IRR
- 10.5%
- Equity multiple
- 1.82×
- Total profit
- $63,154
- Equity at exit
- $23,777
Cash invested: $77,000 (down + closing). Projections, not guarantees.
Landlord ↔ Tenant lean methodology
- Overall (STATE)
- 27 Tenant-Leaning
- State Connecticut
- 27 Tenant-Leaning · D+7
- County
- — inherits STATE
- City
- — inherits STATE
ZIP-level market 06238
- Home prices YoY
- -31.6%
- Active inventory
- 59
- Price-to-rent
- 13.8×
Monthly cashflow live
- Estimated rent
- $3,320 medium interval (Pro) →
- Mortgage (P&I)
- −$1,442
- Tax from tax record
- −$326 /mo · $3,910/yr
- Insurance
- −$115
- HOA
- −$0
- Vacancy / Maint / Mgmt
- −$697
- Net cashflow
- $740
Break-even live
2-unit breakdown (identical units grouped — click to expand)
| Units | Beds | Baths | Est. rent |
|---|---|---|---|
| 2× units | 2 | — | $3,320 |
| #1 | 2 | — | $1,660 |
| #2 | 2 | — | $1,660 |
| Total (2 units) | $3,320 | ||
UW: 25.0% down · 7.5% · 30yr · 1.5% tax · 5.0% vac · 8.0% maint · 8.0% mgmt
Financing live
Cash to close
- Down payment
- $68,750
- Closing costs
- $8,250
- Reserves months
- —
- Total cash needed
- —
Loan-product check · same deal, 3 products live
Conventional
25% down · 7.5% · 30yr
- Down + closing
- —
- Monthly P&I
- —
- Monthly cashflow
- —
- DSCR
- —
- Eligible?
- —
Personal DTI + credit; lowest rate.
DSCR
20% down · 8.5% · 30yr
- Down + closing
- —
- Monthly P&I
- —
- Monthly cashflow
- —
- DSCR
- —
- Eligible?
- —
No personal income docs; deal must DSCR.
Hard money
10% down · 12.0% · 12mo
- Down + closing
- —
- Monthly P&I
- —
- Monthly cashflow
- —
- DSCR
- —
- Eligible?
- —
Short-term bridge; refi at stabilization.
Rent comps 1 comps
| Address | Beds | Baths | Sqft | Rent | $/sqft | DOM | Units | Dist |
|---|---|---|---|---|---|---|---|---|
| 955 Main St Coventry, CT | 4.0 | 2.0 | 1750 | $2,650 | $1.51 | 3d | 1 | 0.61mi |
Listing history 11 events
-
2026-06-15status $275,000 Under Contract 2 DOM
-
2026-06-13statusdays on market $275,000 Active 2 DOM
-
2026-06-10pricestatus $275,000 Coming Soon 1 DOM
-
2026-05-15historical
-
2026-05-07$375,000 Active
-
2026-05-05historical
-
2024-07-29historical $1,495
-
2024-07-29historical $1,495
-
2024-07-25$1,495
-
2024-07-25$2,195
-
2001-07-13soldstatus $118,000
ⓘ Source: listings_history table (triggers on properties + properties_extension) + one-shot
backfill from property_details.listing_events for pre-trigger history.
Tax reassessment forecast CT · Partial reset (capped growth)
- Current annual tax
- $3,910 · $326/mo
- Projected year-2 tax
- $4,898 · $408/mo
- Expected delta
- +$988/yr (+$82/mo · 25.3%)
ⓘ Screening estimate from a state-policy table — verify with the county assessor before closing.
Climate risk First Street
- Flood 1/10 Low FEMA zone X · 0% chance over 30 yrs
- Wildfire 3/10 Moderate
- Heat 4/10 Moderate 7 d/yr ≥95°F today · 16 d/yr by 30 yrs out
- Wind 6/10 Major 48% chance of damaging wind over 30 yrs
- Air quality 3/10 Moderate 3 unhealthy d/yr today · 4 by 30 yrs out
Nearby sold comps map
Loading sold comps map…
Walkable amenities ~0.75 mi
Loading nearby amenities…
Taxation est. · year 1
- Rental income
- $39,840
- − Mortgage interest
- −$15,404
- − Property taxes
- −$3,910
- − Insurance
- −$1,375
- − Repairs & maintenance
- −$3,187
- − Management
- −$3,187
- − Depreciation
- −$8,000
- Taxable income
- $4,776
- Est. tax owed @ 24.0%
- −$1,146
- After-tax cash flow
- $7,737/yr
For passive investors: Depreciation is non-cash, so a rental often shows a tax loss while cash-flowing — sheltering income. Rental losses are passive: they offset passive income freely, and up to $25,000/yr can offset ordinary (W-2) income if you actively participate and your MAGI is under $100k (phasing out to $0 by $150k); unused losses carry forward. On sale, claimed depreciation is recaptured at up to 25%, and gains may owe capital-gains tax (a 1031 exchange can defer both). Figures are a year-1 estimate at your 24.0% rate — not tax advice; consult a CPA.
Schools (NCES district)
- District
- Coventry School District
- NCES district ID
- 0900960
- Math proficiency
- 57% ▼ -11.00%
- Reading proficiency
- 71% ▼ -6.00%
- Median HH income
- $88,074
- Composite
- 57.98/100
- National rank
- #1037
- State rank
- #30 of 153 in CT
Livability — South Coventry
- Score
- 70/100
- State rank
- #97
- US rank
- #7545
Category grades
Schools grade is shown separately in the Schools card above.
Census & demographics
- Census place
- South Coventry, CT
- Population (ZIP)
- 12,267
Population outlook (Capitol County) Hauer SSP2
- By 2040
- 1,063,519
Race, ethnicity, and origin ACS 2023
- Neighborhood character
- Predominantly White (92%)
- Race & ethnicity
- White 92% Hispanic / Latino 5% Two or more races 4% Asian 2%
- Common ancestry
- Romanian 9% Lithuanian 7% Slovak 2%
- Foreign-born
- 6% · Canada, China
- Languages at home
- 93% English-only · Spanish 3% French/Haitian/Cajun 1% Russian/Polish/Slavic 1%
Political lean MEDSL · Capitol
- 2024 margin
- Strong D (+21.9) · D 60.1% · R 38.2% · Other 1.7%
- All cycles
- 2024: D+21.9
Not yet ingested
- Civics
- —
Market trends
- HPI YoY
- ▼ -119.22%
- Current HPI
- 258.0578
- Rent YoY
- —
- Metro
- —
- State GDP YoY
- ▲ 1.06%
- F500 in state
- 38
Industry mix (Fortune 500 HQ in CT)
| Industry | F500 HQs | Revenue |
|---|---|---|
| Industrial Machinery | 4 | $38B |
|
||
| Insurance | 3 | $71B |
|
||
| Financial Services | 2 | $25B |
|
||
| Transportation / Logistics | 2 | $18B |
|
||
| Healthcare | 1 | $247B |
|
||
| Telecommunications | 1 | $55B |
|
||
Price history
+133.1% since first listed11 events — show timeline
- 2026-06-13 Pending — Smart MLS
- 2026-06-12 Listed $275,000 Smart MLS
- 2026-06-10 Coming Soon $275,000 Smart MLS
- 2026-05-15 Listing Removed — Smart MLS
- 2026-05-07 Listed $375,000 Smart MLS
- 2026-05-05 Coming Soon — Smart MLS
- 2024-07-29 Rental Removed $1,495 TURBOTENANT
- 2024-07-29 Rental Removed $1,495 TURBOTENANT
- 2024-07-25 Listed for Rent $1,495 TURBOTENANT
- 2024-07-25 Listed for Rent $2,195 TURBOTENANT
- 2001-07-13 Sold (Public Records) $118,000 Public Records
Property tax history
+0.5%/yrLatest (2023): $3,910 · +1.9% YoY. Source: county tax records.
Cash-flow waterfall
monthlySold comps — $/sqft
last 12 mo · ≤1 miLoading sold comps…