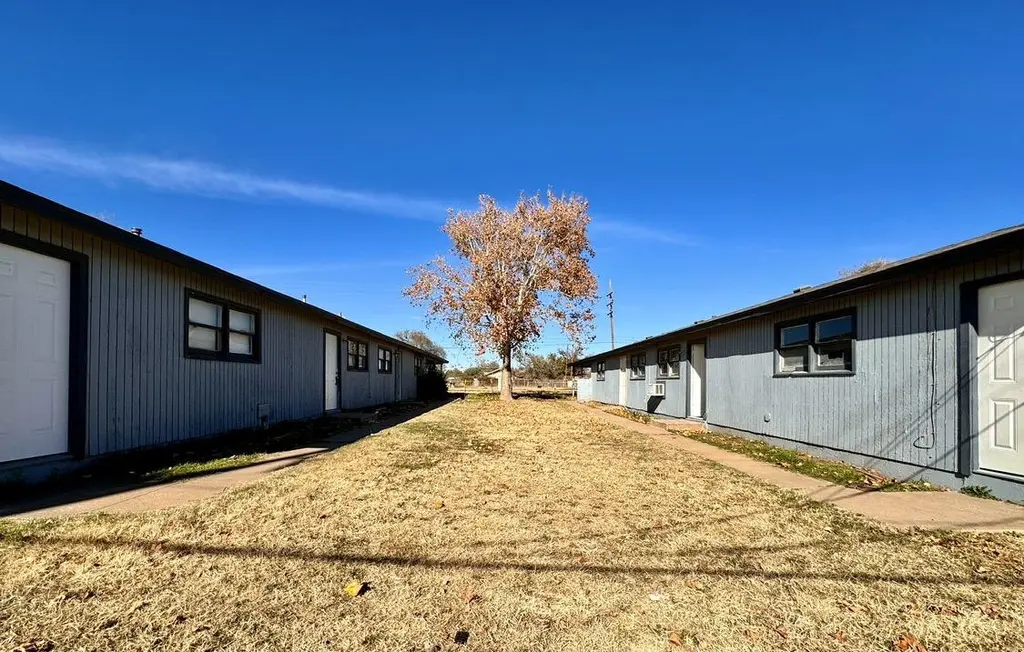
 Duplex
531 42nd St · Lubbock, TX
Flood risk 1/10 · Minimal
- FEMA flood zone
- X (unshaded)
- Chance of flooding over 30 yrs
- 0.0%
- Est. flood insurance / yr
- $507 – $1,088
Fire risk 1/10 · Minimal
- Est. fire insurance / yr
- $1,222 – $2,270
Heat risk 5/10 · Moderate
- Hot days now (above 100°F)
- 7 days/yr
- Hot days in 30 yrs
- 21 days/yr
Wind risk 2/10 · Minimal
- Chance of severe wind over 30 yrs
- —
Air-quality risk 2/10 · Minimal
- Unhealthy air days now
- 1 days/yr
- Unhealthy air days in 30 yrs
- 1 days/yr
Risk factors via First Street. Map © Google.
Why this score? — see what drove the B+ grade
The composite is a weighted blend of 9 inputs, each scored 0–100. Each bar is that input's sub-score; the figure is the points it added to the 100-point composite (weight × sub-score).
- Cash flow +30.0/30.0
- 1% rule +10.0/10.0
- DSCR +10.0/10.0
- ARV discount +7.5/15.0
- Appreciation +6.6/10.0
- Livability +4.0/5.0
- Schools +3.1/10.0
- Rent growth +2.5/5.0
- Condition / age +2.5/5.0
$99,900
🖨 Deal sheet 📄 Offer letter ✓ Due diligence
Multi-family units
County records classify this as Multi-Family (2-4 Unit). Listing-text estimate: 2 units. confirmed
Listing remarks MLS
Duplex for sale! Beats the 1% rule! Previously leased for $1150 a month, and Recently remodeled and ready for a new owner. This duplex has had interior and exterior touch ups, and tons of interior work to get these ready for rent or home owner. Each unit was previously rented at $600 and $550 a month. Located close to highway for easy access!
Key facts
- Recently remodeled
- Close to highway
- 6,625 sq ft lot
Tags
Neighborhood map
What this means for you Summary
Snapshot
- This is a 2 × 2-bed/1.0-bath units multifamily listed at $100k.
Deal economics
- At list price, monthly cash flow is $566 ($7k/yr) — positive. Per door: $283/mo.
- The deal already cash-flows at list — no discount required.
- Meets the 1% rule at list price ($2k rent vs $100k).
- Recommended offer: $88k (12.0% below list) — sets the bar for market timing.
Location & tenants
- Location reads 80/100 on livability (#37 in TX, #1,749 nationally) — a professional / high-income tenant draw. Strengths: commute A+, cost of living A+, housing A+; Watch: employment C-, schools D+, crime F.
- Lubbock ISD (urban): math 36% / reading 39% proficiency, ranked #481 of 826 in TX (top 58%) — families likely to look elsewhere, expect single-tenant / working-renter base with shorter leases; 60% free/reduced lunch — lower-income household profile, screen leases tightly.
- Market conditions: 91 active listings in the ZIP; 38 comparable units currently listed for rent nearby; rentals at typical pace (median 22d on market — plan ~3-4 weeks tenant-placement turnaround); 2,219 units permitted in Lubbock County in 2024 (252 in 5+ unit buildings).
- This rent runs 38% of the median local income ($52k/yr) — at the standard rent-burdened threshold; future hikes will face affordability resistance.
Forward outlook
- In year one you build about $4k of equity ($691 loan paydown + $3k appreciation (3.2% local appreciation)).
- Lubbock County population projected at +39% by 2050 — long-run rental-demand tailwind backs the buy-and-hold thesis.
- At projected returns (3.2% appreciation + 3.0% rent growth), your $28k cash investment doubles in ~3 years — after that, you're playing with house money.
- By year 9, paydown + projected appreciation supports a ~$33k cash-out refi (75% LTV) — recoverable capital for the next deal without selling this one.
Negotiation context
- It's been on market 147 days — a 12% lower offer ($88k) is reasonable based on typical stale-listing flexibility.
- 3 sale attempts since 3y ago with the ask held roughly flat each time — persistent listings suggest the price (not the market) is what's stuck; bring a comps-based counter.
Risks & watch-outs
- Watch-outs: built in 1954 — expect roof / HVAC / electrical / plumbing capex.
- Climate carrying-cost: extreme-heat days projected 7→21/yr by 2055 (HVAC capex compounding) — expect insurance premiums to compound above CPI over the hold.
Questions for the listing agent
- It's been on market 147 days. Have you received any prior offers? Is the seller open to a 12% concession, seller financing, or rate buy-down credit?
- Can we see the unit-by-unit rent roll, current vacancy, and any below-market leases? What's the average tenancy length?
- What capital expenditures (roof, boiler, parking lot, exteriors) have been made in the last 5 years, and what's planned in the next 2?
- Built in 1954 — when were the roof, HVAC, electrical panel, plumbing, and water heater last replaced?
- Why hasn't it sold? Are there any deal-killer items the seller is aware of (foundation, flood, title, zoning, code violations)?
- Is there a deadline driving the sale (1031 exchange, divorce, estate, relocation)? That informs how much negotiation room exists.
- Schools are D-rated, which usually means shorter tenancies and higher turnover. Who's the typical renter profile here, and what's been the actual vacancy rate?
- Crime grade is F in this area — have there been break-ins, vandalism, or insurance claims at this property in the last 3 years? What carrier currently insures it and at what premium?
- What's the average days-on-market for RENTAL listings here right now (not sales)? A rising rental-DOM trend means longer vacancies and softer asking-rent achievability than the comps imply.
- What's the recent tenant-quality profile in this submarket — average credit score on applications, eviction rate, late-payment / NSF rate, and stable-employment percentage? A property-management company in the area should have these aggregated.
- How much new apartment / multifamily construction is in the pipeline within 1–3 miles? Heavy new supply (>2% of stock underway) typically softens rents 12–24 months out; light construction supports rent growth.
Investment metrics
- 1% rule
- 1.63% ✓
- Cap rate
- 13.09%
- Cash-on-cash
- 24.29%
- DSCR
- 2.08
- GRM
- 5.1
CMA / ARV
No comps found within radius.
Projected returns pro-forma
3.22% appreciation · 3.0% rent growth · sell at horizon
- IRR
- 30.8%
- Equity multiple
- 2.76×
- Total profit
- $49,325
- Equity at exit
- $46,181
- IRR
- 31.0%
- Equity multiple
- 5.42×
- Total profit
- $123,664
- Equity at exit
- $72,168
Cash invested: $27,972 (down + closing). Projections, not guarantees.
Landlord ↔ Tenant lean methodology
- Overall (STATE)
- 87 Strongly Landlord-Friendly
- State Texas
- 87 Strongly Landlord-Friendly · R+5
- County
- — inherits STATE
- City
- — inherits STATE
ZIP-level market 79404
- Home prices YoY
- 2.0%
- Active inventory
- 91
- Price-to-rent
- 10.3×
Monthly cashflow live
- Estimated rent
- $1,624 high interval (Pro) →
- Mortgage (P&I)
- −$524
- Tax from tax record
- −$151 /mo · $1,815/yr
- Insurance
- −$42
- HOA
- −$0
- Vacancy / Maint / Mgmt
- −$341
- Net cashflow
- $566
Break-even live
2-unit breakdown (identical units grouped — click to expand)
| Units | Beds | Baths | Est. rent |
|---|---|---|---|
| 2× units | 2 | 1 | $1,624 |
| #1 | 2 | 1 | $812 |
| #2 | 2 | 1 | $812 |
| Total (2 units) | $1,624 | ||
UW: 25.0% down · 7.5% · 30yr · 1.5% tax · 5.0% vac · 8.0% maint · 8.0% mgmt
Financing live
Cash to close
- Down payment
- $24,975
- Closing costs
- $2,997
- Reserves months
- —
- Total cash needed
- —
Loan-product check · same deal, 3 products live
Conventional
25% down · 7.5% · 30yr
- Down + closing
- —
- Monthly P&I
- —
- Monthly cashflow
- —
- DSCR
- —
- Eligible?
- —
Personal DTI + credit; lowest rate.
DSCR
20% down · 8.5% · 30yr
- Down + closing
- —
- Monthly P&I
- —
- Monthly cashflow
- —
- DSCR
- —
- Eligible?
- —
No personal income docs; deal must DSCR.
Hard money
10% down · 12.0% · 12mo
- Down + closing
- —
- Monthly P&I
- —
- Monthly cashflow
- —
- DSCR
- —
- Eligible?
- —
Short-term bridge; refi at stabilization.
Rent comps 38 comps
| Address | Beds | Baths | Sqft | Rent | $/sqft | DOM | Units | Dist |
|---|---|---|---|---|---|---|---|---|
| 519 42nd St Apt A Lubbock, TX | 3.0 | 1.0 | 1092 | $895 | $0.82 | 13d | 1 | 0.06mi |
| 531 44th St Lubbock, TX | 3.0 | 2.0 | 1300 | $1,090 | $0.84 | 13d | 1 | 0.14mi |
| 529 45th St Unit A Lubbock, TX | 3.0 | 1.0 | 1100 | $875 | $0.80 | 13d | 1 | 0.21mi |
| 519 45th St Unit A Lubbock, TX | 3.0 | 1.0 | 1100 | $850 | $0.77 | 13d | 1 | 0.22mi |
| 520 46th St Unit A Lubbock, TX | 3.0 | 1.0 | 1200 | $850 | $0.71 | 13d | 1 | 0.25mi |
| 419 38th St Lubbock, TX | 3.0 | 1.0 | 1206 | $950 | $0.79 | 44d | 1 | 0.30mi |
| 220 44th St Unit A Lubbock, TX | 3.0 | 2.0 | 980 | $910 | $0.93 | 13d | 1 | 0.32mi |
| 4606 Avenue C Unit C Lubbock, TX | 3.0 | 2.0 | 1142 | $999 | $0.87 | 13d | 1 | 0.35mi |
| 812 48th St Lubbock, TX | 3.0 | 1.0 | 1282 | $1,250 | $0.98 | 21d | 1 | 0.36mi |
| 1312 40th St Lubbock, TX | 3.0 | 1.0 | 940 | $795 | $0.85 | 21d | 1 | 0.44mi |
| 313 52nd St Lubbock, TX | 4.0 | 1.0 | 1044 | $975 | $0.93 | 21d | 1 | 0.69mi |
| 505 E 37th St Lubbock, TX | 3.0 | 1.0 | 960 | $1,125 | $1.17 | 13d | 1 | 0.77mi |
| 1712 42nd St Unit B Lubbock, TX | 3.0 | 1.0 | 899 | $695 | $0.77 | 21d | 1 | 0.81mi |
| 1718 43rd St Lubbock, TX | 4.0 | 2.0 | 1870 | $1,075 | $0.57 | 21d | 1 | 0.82mi |
| 5512 Avenue G Unit G Lubbock, TX | 3.0 | 1.0 | 1117 | $1,000 | $0.90 | 44d | 1 | 0.87mi |
| 1920 44th St Lubbock, TX | 4.0 | 2.0 | 1391 | $795 | $0.57 | 21d | 1 | 0.95mi |
| 1920 45th St Lubbock, TX | 3.0 | 1.0 | 1200 | $1,200 | $1.00 | 21d | 1 | 0.96mi |
| 5614 Avenue A Unit A Lubbock, TX | 3.0 | 1.0 | 1129 | $695 | $0.62 | 21d | 1 | 1.01mi |
| 2108 38th St Lubbock, TX | 3.0 | 2.0 | 1124 | $900 | $0.80 | 44d | 1 | 1.16mi |
| 1517 25th St Lubbock, TX | 3.0 | 2.0 | 1514 | $1,095 | $0.72 | 21d | 1 | 1.19mi |
| 2603 Elm Ave Lubbock, TX | 3.0 | 2.0 | 1214 | $1,175 | $0.97 | 44d | 1 | 1.23mi |
| 2106 32nd St Lubbock, TX | 3.0 | 1.0 | 1398 | $925 | $0.66 | 44d | 1 | 1.24mi |
| 2106 32nd St Lubbock, TX | 3.0 | 1.0 | 1398 | $695 | $0.50 | 21d | 1 | 1.24mi |
| 1307 61st St Lubbock, TX | 3.0 | 1.0 | 1073 | $1,150 | $1.07 | 13d | 1 | 1.30mi |
| 2211 33rd St Unit A Lubbock, TX | 3.0 | 1.5 | 1293 | $1,200 | $0.93 | 44d | 1 | 1.34mi |
| 2215 36th St Lubbock, TX | 3.0 | 2.0 | 1578 | $1,450 | $0.92 | 44d | 1 | 1.35mi |
| 1920 27th St Unit 1 Lubbock, TX | 3.0 | 3.0 | 1366 | $1,500 | $1.10 | 44d | 1 | 1.35mi |
| 2217 36th St Lubbock, TX | 3.0 | 1.0 | 1284 | $1,109 | $0.86 | 13d | 1 | 1.36mi |
| 1915 26th St Lubbock, TX | 3.0 | 1.0 | 1221 | $1,100 | $0.90 | 44d | 1 | 1.36mi |
| 2015 Avenue L Unit B Lubbock, TX | 3.0 | 2.0 | 980 | $960 | $0.98 | 13d | 1 | 1.40mi |
| 1716 24th St Lubbock, TX | 4.0 | 2.0 | 1742 | $1,850 | $1.06 | 44d | 1 | 1.42mi |
| 2316 47th St Lubbock, TX | 3.0 | 2.0 | 1285 | $1,400 | $1.09 | 21d | 1 | 1.45mi |
| 1904 24th St Lubbock, TX | 3.0 | 1.0 | 1172 | $1,100 | $0.94 | 44d | 1 | 1.46mi |
| 2201 28th St Lubbock, TX | 3.0 | 1.0 | 1246 | $995 | $0.80 | 21d | 1 | 1.47mi |
| 2315 48th St Lubbock, TX | 3.0 | 1.0 | 1014 | $1,350 | $1.33 | 21d | 1 | 1.48mi |
| 1601 21st St Unit a Lubbock, TX | 3.0 | 2.0 | 980 | $925 | $0.94 | 13d | 1 | 1.48mi |
| 2403 38th St Lubbock, TX | 3.0 | 1.5 | 1786 | $1,700 | $0.95 | 44d | 1 | 1.50mi |
| 6130 Avenue P Lubbock, TX | 4.0 | 2.0 | 1387 | $1,100 | $0.79 | 44d | 1 | 1.50mi |
Listing history 24 events
-
2026-06-18days on market $99,900 Active 147 DOM
-
2026-06-17days on market $99,900 Active 146 DOM
-
2026-06-16days on market $99,900 Active 145 DOM
-
2026-06-15days on market $99,900 Active 144 DOM
-
2026-06-14days on market $99,900 Active 142 DOM
-
2026-06-13days on market $99,900 Active 141 DOM
-
2026-06-10days on market $99,900 Active 139 DOM
-
2026-06-09days on market $99,900 Active 138 DOM
-
2026-06-08days on market $99,900 Active 137 DOM
-
2026-06-07days on market $99,900 Active 136 DOM
-
2026-06-05days on market $99,900 Active 133 DOM
-
2026-06-03days on market $99,900 Active 132 DOM
-
2026-06-02days on market $99,900 Active 131 DOM
-
2026-06-01days on market $99,900 Active 130 DOM
-
2026-05-31days on market $99,900 Active 129 DOM
-
2026-05-30days on market $99,900 Active 128 DOM
-
2026-05-15status Pending 344-char remark
Show marketing remark (344 chars)
Duplex for sale! Beats the 1% rule! Previously leased for $1150 a month, and Recently remodeled and ready for a new owner. This duplex has had interior and exterior touch ups, and tons of interior work to get these ready for rent or home owner. Each unit was previously rented at $600 and $550 a month. Located close to highway for easy access!
-
2026-01-14$99,900 Active 344-char remark
Show marketing remark (344 chars)
Duplex for sale! Beats the 1% rule! Previously leased for $1150 a month, and Recently remodeled and ready for a new owner. This duplex has had interior and exterior touch ups, and tons of interior work to get these ready for rent or home owner. Each unit was previously rented at $600 and $550 a month. Located close to highway for easy access!
-
2024-08-13price $109,900
-
2023-12-07historical $750
-
2023-12-07$750
-
2023-10-11soldstatus Closed
-
2023-08-24status Pending
-
2023-07-05$95,000 Active
ⓘ Source: listings_history table (triggers on properties + properties_extension) + one-shot
backfill from property_details.listing_events for pre-trigger history.
Tax reassessment forecast TX · Resets to sale price
- Current annual tax
- $1,815 · $151/mo
- Projected year-2 tax
- $1,828 · $152/mo
- Expected delta
- +$14/yr (+$1/mo · 0.7%)
ⓘ Screening estimate from a state-policy table — verify with the county assessor before closing.
Climate risk First Street
- Flood 1/10 Low FEMA zone X (unshaded) · 0% chance over 30 yrs
- Wildfire 1/10 Low
- Heat 5/10 Major 7 d/yr ≥100°F today · 21 d/yr by 30 yrs out
- Wind 2/10 Low
- Air quality 2/10 Low 1 unhealthy d/yr today · 1 by 30 yrs out
Nearby sold comps map
Loading sold comps map…
Walkable amenities ~0.75 mi
Loading nearby amenities…
Taxation est. · year 1
- Rental income
- $19,488
- − Mortgage interest
- −$5,596
- − Property taxes
- −$1,815
- − Insurance
- −$500
- − Repairs & maintenance
- −$1,559
- − Management
- −$1,559
- − Depreciation
- −$2,906
- Taxable income
- $5,554
- Est. tax owed @ 24.0%
- −$1,333
- After-tax cash flow
- $5,462/yr
For passive investors: Depreciation is non-cash, so a rental often shows a tax loss while cash-flowing — sheltering income. Rental losses are passive: they offset passive income freely, and up to $25,000/yr can offset ordinary (W-2) income if you actively participate and your MAGI is under $100k (phasing out to $0 by $150k); unused losses carry forward. On sale, claimed depreciation is recaptured at up to 25%, and gains may owe capital-gains tax (a 1031 exchange can defer both). Figures are a year-1 estimate at your 24.0% rate — not tax advice; consult a CPA.
Schools (NCES district)
- District
- Lubbock ISD
- NCES district ID
- 4828500
- Math proficiency
- 36% ▼ -8.00%
- Reading proficiency
- 39% ▼ -1.00%
- Median HH income
- $39,820
- Composite
- 31.44/100
- National rank
- #5984
- State rank
- #481 of 826 in TX
Livability — Lubbock
- Score
- 80/100
- State rank
- #37
- US rank
- #1749
Category grades
Schools grade is shown separately in the Schools card above.
Census & demographics
- Census place
- Lubbock, TX
- County
- Lubbock County · 293,542 people
- City population
- 283,030
- Metro
- Lubbock, TX
- Population (ZIP)
- 8,529
- Household income
- $51,630
- Rent vs Own
- Severe rent burden
- 366.0
Population outlook (Lubbock County) Hauer SSP2
- Today (2025)
- 345,960 people
- By 2030
- 371,449 · +7.4%
- By 2040
- 424,539 · +22.7%
- By 2050
- 481,150 · +39.1%
- By 2075
- 633,467 · +83.1%
- By 2100
- 746,853 · +115.9%
Race, ethnicity, and origin ACS 2023
- Neighborhood character
- Diverse neighborhood (Simpson 0.60)
- Race & ethnicity
- Hispanic / Latino 55% Black 22% White 20% Two or more races 17% Native American 2%
- Hispanic origin (detail)
- Mexican 46%
- Common ancestry
- Romanian 1% Lithuanian 0%
- Foreign-born
- 5% · Canada
- Languages at home
- 64% English-only · Spanish 36%
Political lean MEDSL · Lubbock
- 2024 margin
- Solid R (+39.5) · D 29.7% · R 69.2% · Other 1.0%
- 2008→2024 swing
- -2.8pp toward R · 2008: -36.7pp · 2024: -39.5pp
- All cycles
- 2024: R+39.5 2020: R+32.2 2016: R+38.4 2012: R+40.9 2008: R+36.7
Not yet ingested
- Civics
- —
Market trends
- HPI YoY
- ▲ 3.22%
- Current HPI
- 163.854
- Rent YoY
- —
- Metro
- Lubbock, TX
- State GDP YoY
- ▲ 3.95%
- F500 in state
- 110
Industry mix (Fortune 500 HQ in TX)
| Industry | F500 HQs | Revenue |
|---|---|---|
| Energy | 16 | $1,198B |
|
||
| Technology | 5 | $198B |
|
||
| Engineering / Construction | 4 | $72B |
|
||
| Energy Services | 3 | $60B |
|
||
| Utilities | 3 | $41B |
|
||
| Healthcare | 2 | $330B |
|
||
Price history
+5.2% since first listed8 events — show timeline
- 2026-05-15 Pending — LARMLS
- 2026-01-14 Listed $99,900 LARMLS
- 2024-08-13 Price Changed $109,900 LARMLS
- 2023-12-07 Rental Removed $750 APPFOLIO
- 2023-12-07 Listed for Rent $750 APPFOLIO
- 2023-10-11 Sold (MLS) — LARMLS
- 2023-08-24 Pending — LARMLS
- 2023-07-05 Listed $95,000 LARMLS
Property tax history
+8.1%/yrLatest (2025): $1,815 · +2.7% YoY. Source: county tax records.
Cash-flow waterfall
monthlySold comps — $/sqft
last 12 mo · ≤1 miLoading sold comps…