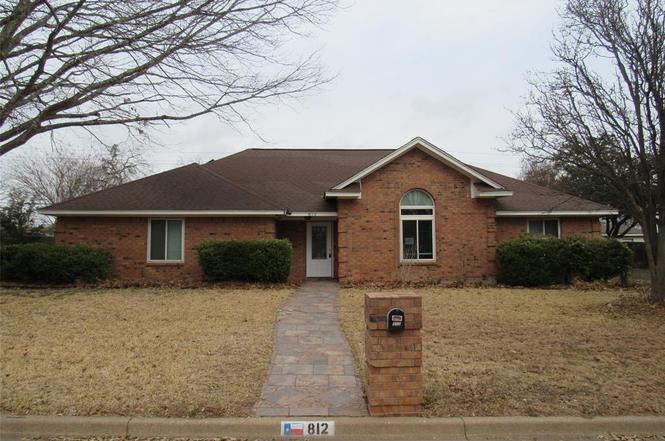
812 Regina Dr · Hewitt, TX
Flood risk 1/10 · Minimal
- FEMA flood zone
- X (unshaded)
- Chance of flooding over 30 yrs
- 0.0%
- Est. flood insurance / yr
- $507 – $1,088
Fire risk 5/10 · Moderate
- Est. fire insurance / yr
- $1,222 – $2,270
Heat risk 7/10 · Major
- Hot days now (above 109°F)
- 7 days/yr
- Hot days in 30 yrs
- 24 days/yr
Wind risk 6/10 · Moderate
- Chance of severe wind over 30 yrs
- 66.0%
Air-quality risk 1/10 · Minimal
- Unhealthy air days now
- 0 days/yr
- Unhealthy air days in 30 yrs
- 0 days/yr
Risk factors via First Street. Map © Google.
Why this score? — see what drove the D+ grade
The composite is a weighted blend of 9 inputs, each scored 0–100. Each bar is that input's sub-score; the figure is the points it added to the 100-point composite (weight × sub-score).
- ARV discount +15.0/15.0
- Cash flow +12.4/30.0
- Schools +5.2/10.0
- 1% rule +4.2/10.0
- DSCR +3.7/10.0
- Livability +3.6/5.0
- Rent growth +2.9/5.0
- Condition / age +2.5/5.0
- Appreciation +0.0/10.0
$249,000
🖨 Deal sheet (PDF) 📄 Offer letter ✓ Due diligence
Listing remarks
Have you been looking for a spacious 3 bedroom, 2 bath home in Midway ISD? Well, you have found it! Welcome to this lovely brick ranch in the Gross Yowell subdivision with room for for everyone!! This home features a huge, open living room with adjacent dining area and kitchen. The open kitchen with breakfast area is the perfect layout for entertaining. The primary suite with attached primary bath features a fully updated shower and is an amazing retreat at the end of a long day. The two secondary bedrooms feature tile floors and lots of space. This home has all solid surface flooring. Outside you'll find a lovely covered patio and a newer storage building for your stuff. This home also fea
Key facts
- Open living room
- Covered patio
- Fully updated shower
Tags
Property features AI
Finance
- Financial info: Special listing condition: Real Estate Owned
- HOA & community: No homeowners association
Exterior
- Parking: 2 covered parking spaces; Attached 2-car garage with garage facing side
- Utilities: City sewer; City water; Solar energy generation
- Home design: Single-family residence; Residential property; Built in 1987; One story
- Construction: Brick construction
- Exterior features: Lot under 0.5 acre (approximately 0.297 acres); Subdivision: Gross-Yowell Sub; Directions: Spring Valley Rd, turn on Tillamook, then onto Regina
Interior
- Kitchen: Dishwasher; Electric range; Refrigerator
- Bedrooms: 3 bedrooms; Primary bedroom on main level (14 x 14)
- Bathrooms: 2 full bathrooms
- Interior features: One-level home; Wood-burning fireplace; Other interior features
- Laundry & utility: Washer/dryer hookups (appliance list does not specify separate laundry appliances)
Neighborhood map
What this means for you Summary
Snapshot
- This is a 3-bed/2.0-bath single-family listed at $249k.
Deal economics
- At list price, monthly cash flow is $-41 ($-490/yr) — negative.
- To cash-flow at today's rent, offer at most $242k (2.9% below list).
- To meet the 1% rule (rent ≥ 1% of price), the offer needs to be $230k (7.7% below list).
- Recommended offer: $219k (12.0% below list) — sets the bar for market timing.
- Cap rate 6.1% vs local median 3.4% in Hewitt — top-decile yield for the area; either an underpriced asset or a hidden risk that comps aren't pricing in. Stress-test before assuming the spread holds.
Location & tenants
- Location reads 71/100 on livability (#301 in TX) — a middle-class / working-renter tenant base. Strengths: cost of living A+, housing A+, crime A; Watch: amenities F, commute F, health & safety F.
- Midway ISD (other): math 61% / reading 58% proficiency, ranked #56 of 826 in TX (top 7%) — acceptable for families but not a draw, mixed tenant base, ~2y average lease.
- Zoned schools: Spring Valley El (math 47% / reading 47%, grade D-, #1,006 of 4,322 statewide, top 25%, 488 students, 40% FRL); Midway Middle (math 58% / reading 58%, grade B, #197 of 1,662 statewide, top 12%, 1,075 students, 47% FRL); Midway H S (math 66% / reading 67%, grade B, #186 of 1,632 statewide, top 11%, 2,648 students, 32% FRL).
- Market conditions: Rents rising (+1.6%/yr); 102 active listings in the ZIP; 2 comparable units currently listed for rent nearby; solid renter incomes; 1,014 units permitted in McLennan County in 2024 (200 in 5+ unit buildings).
- This rent runs 33% of the median local income ($84k/yr) — at the standard rent-burdened threshold; future hikes will face affordability resistance.
Forward outlook
- Local home prices are declining (-3.0%/yr); year-one equity from $2k of loan paydown is wiped out by about $7k of value loss. Plan a longer hold.
- McLennan County population projected at +17% by 2050 — long-run rental-demand tailwind backs the buy-and-hold thesis.
Negotiation context
- It's been on market 132 days — a 12% lower offer ($219k) is reasonable based on typical stale-listing flexibility.
Risks & watch-outs
- Climate carrying-cost: major wind risk, 66% chance of damaging wind over 30y; moderate wildfire risk; extreme-heat days projected 7→24/yr by 2055 (HVAC capex compounding) — expect insurance premiums to compound above CPI over the hold.
Questions for the listing agent
- What do current leases actually rent for vs. the listed asking? Can we see a recent rent roll and the last 12 months of T-12 income?
- It's been on market 132 days. Have you received any prior offers? Is the seller open to a 12% concession, seller financing, or rate buy-down credit?
- Why hasn't it sold? Are there any deal-killer items the seller is aware of (foundation, flood, title, zoning, code violations)?
- Is there a deadline driving the sale (1031 exchange, divorce, estate, relocation)? That informs how much negotiation room exists.
- Schools are B-rated — typically a magnet for longer-tenancy family renters. What's the average tenant stay here, and is there a school-zone premium baked into asking?
- The area grade is low — what's the realistic commute time and amenity access for the typical tenant pool here? Any planned neighborhood developments (good or bad) we should know about?
- What's the average days-on-market for RENTAL listings here right now (not sales)? A rising rental-DOM trend means longer vacancies and softer asking-rent achievability than the comps imply.
- What's the recent tenant-quality profile in this submarket — average credit score on applications, eviction rate, late-payment / NSF rate, and stable-employment percentage? A property-management company in the area should have these aggregated.
- How much new for-sale + rental construction is in the pipeline within 1–3 miles? Heavy new supply typically softens prices + rents 12–24 months out; constrained supply supports both.
Investment metrics
- 1% rule
- 0.92% ✗
- Cap rate
- 6.10%
- Cash-on-cash
- -0.70%
- DSCR
- 0.97
- GRM
- 9.0
CMA / ARV
- ARV (on-the-fly)
- $367,562
- Comps found
- 2
Show comp detail 2 sales within ~0.75 mi
| Address | Dist | Beds/Ba | Sqft | Sold | Price | $/sf | Match |
|---|---|---|---|---|---|---|---|
| 825 Day Star Dr | 0.65mi | 3/2.0 | 1,857 (+7%) | 5mo | $374,500 | $202 | 54 |
| 812 Gallant Fox Rd | 0.72mi | 3/2.0 | 1,920 (+10%) | 22mo | $405,000 | $211 | 31 |
Match score weights: distance 35% · size 25% · config 20% · recency 20%. Top-matched comps best support the ARV.
Projected returns pro-forma
-3.0% appreciation · 1.57% rent growth · sell at horizon
- IRR
- -19.1%
- Equity multiple
- 0.34×
- Total profit
- $-46,090
- Equity at exit
- $37,127
- IRR
- -15.2%
- Equity multiple
- 0.20×
- Total profit
- $-55,999
- Equity at exit
- $21,529
Cash invested: $69,720 (down + closing). Projections, not guarantees.
Landlord ↔ Tenant lean methodology
- Overall (STATE)
- 87 Strongly Landlord-Friendly
- State Texas
- 87 Strongly Landlord-Friendly · R+5
- County
- — inherits STATE
- City
- — inherits STATE
ZIP-level market 76643
- Rents YoY
- 1.6%
- Active inventory
- 102
- Price-to-rent
- 9.0×
Monthly cashflow live
- Estimated rent
- $2,297 medium interval (Pro) →
- Mortgage (P&I)
- −$1,306
- Tax from tax record
- −$446 /mo · $5,355/yr
- Insurance
- −$104
- HOA
- −$0
- Vacancy / Maint / Mgmt
- −$482
- Net cashflow
- $-41
Break-even live
Sensitivity live
| Price | -10% $100 | -5% $30 | +0% $-41 | +5% $-111 | +10% $-182 |
|---|---|---|---|---|---|
| Rent | -10% $-222 | -5% $-132 | +0% $-41 | +5% $50 | +10% $141 |
| Rate | -1.0pp $85 | -0.5pp $23 | base $-41 | +0.5pp $-105 | +1.0pp $-171 |
UW: 25.0% down · 7.5% · 30yr · 1.5% tax · 5.0% vac · 8.0% maint · 8.0% mgmt
Financing live
Cash to close
- Down payment
- $62,250
- Closing costs
- $7,470
- Reserves months
- —
- Total cash needed
- —
Loan-product check · same deal, 3 products live
Conventional
25% down · 7.5% · 30yr
- Down + closing
- —
- Monthly P&I
- —
- Monthly cashflow
- —
- DSCR
- —
- Eligible?
- —
Personal DTI + credit; lowest rate.
DSCR
20% down · 8.5% · 30yr
- Down + closing
- —
- Monthly P&I
- —
- Monthly cashflow
- —
- DSCR
- —
- Eligible?
- —
No personal income docs; deal must DSCR.
Hard money
10% down · 12.0% · 12mo
- Down + closing
- —
- Monthly P&I
- —
- Monthly cashflow
- —
- DSCR
- —
- Eligible?
- —
Short-term bridge; refi at stabilization.
Rent comps 2 comps
| Address | Beds | Baths | Sqft | Rent | $/sqft | DOM | Units | Dist |
|---|---|---|---|---|---|---|---|---|
| 853 Day Star Dr Hewitt, TX | 4.0 | 2.0 | 1897 | $2,500 | $1.32 | 15d | 1 | 0.67mi |
| 525 E Spring Valley Rd Unit N/A Hewitt, TX | 3.0 | 2.0 | 1406 | $2,100 | $1.49 | 23d | 1 | 1.39mi |
Listing history 19 events
-
2026-06-22days on market $249,000 Active 132 DOM
-
2026-06-21days on market $249,000 Active 131 DOM
-
2026-06-21days on market $249,000 Active 130 DOM
-
2026-06-18days on market $249,000 Active 128 DOM
-
2026-06-17days on market $249,000 Active 127 DOM
-
2026-06-16days on market $249,000 Active 126 DOM
-
2026-06-15days on market $249,000 Active 125 DOM
-
2026-06-15days on market $249,000 Active 124 DOM
-
2026-06-13days on market $249,000 Active 123 DOM
-
2026-06-12pricedays on market $249,000 Active 122 DOM
-
2026-06-10days on market $265,000 Active 119 DOM
-
2026-06-08days on market $265,000 Active 118 DOM
-
2026-06-08days on market $265,000 Active 117 DOM
-
2026-06-07days on market $265,000 Active 116 DOM
-
2026-06-03days on market $265,000 Active 113 DOM
-
2026-06-02days on market $265,000 Active 112 DOM
-
2026-06-01days on market $265,000 Active 111 DOM
-
2026-05-31remarks 699-char remark
-
2026-05-31$265,000 Active 110 DOM
ⓘ Source: listings_history table (triggers on properties + properties_extension) + one-shot
backfill from property_details.listing_events for pre-trigger history.
Tax reassessment forecast TX · Resets to sale price
- Current annual tax
- $5,355 · $446/mo
- Projected year-2 tax
- $5,355 · $446/mo
- Expected delta
- $0/yr ($0/mo · 0.0%)
ⓘ Screening estimate from a state-policy table — verify with the county assessor before closing.
Climate risk First Street
- Flood 1/10 Low FEMA zone X (unshaded) · 0% chance over 30 yrs
- Wildfire 5/10 Major
- Heat 7/10 Severe 7 d/yr ≥109°F today · 24 d/yr by 30 yrs out
- Wind 6/10 Major 66% chance of damaging wind over 30 yrs
- Air quality 1/10 Low 0 unhealthy d/yr today · 0 by 30 yrs out
Nearby sold comps map
Loading sold comps map…
Walkable amenities ~0.75 mi
Loading nearby amenities…
Taxation est. · year 1
- Rental income
- $27,569
- − Mortgage interest
- −$13,948
- − Property taxes
- −$5,355
- − Insurance
- −$1,245
- − Repairs & maintenance
- −$2,206
- − Management
- −$2,206
- − Depreciation
- −$7,244
- Taxable loss
- −$4,633
- Est. tax savings @ 24.0%
- +$1,112
- After-tax cash flow
- $622/yr
For passive investors: Depreciation is non-cash, so a rental often shows a tax loss while cash-flowing — sheltering income. Rental losses are passive: they offset passive income freely, and up to $25,000/yr can offset ordinary (W-2) income if you actively participate and your MAGI is under $100k (phasing out to $0 by $150k); unused losses carry forward. On sale, claimed depreciation is recaptured at up to 25%, and gains may owe capital-gains tax (a 1031 exchange can defer both). Figures are a year-1 estimate at your 24.0% rate — not tax advice; consult a CPA.
Schools (NCES district)
- District
- Midway ISD
- NCES district ID
- 4830640
- Math proficiency
- 61% ▼ -8.00%
- Reading proficiency
- 58% ▼ -7.00%
- Median HH income
- $67,076
- Composite
- 52.32/100
- National rank
- #1593
- State rank
- #56 of 826 in TX
Livability — Hewitt
- Score
- 71/100
- State rank
- #301
- US rank
- #6841
Category grades
Schools grade is shown separately in the Schools card above.
Census & demographics
- Census place
- Hewitt, TX
- County
- McLennan County · 213,088 people
- City population
- 16,432
- Metro
- Waco, TX
- Population (ZIP)
- 16,432
- Household income
- $83,511
- Rent vs Own
- Severe rent burden
- 433.0
Population outlook (McLennan County) Hauer SSP2
- Today (2025)
- 264,191 people
- By 2030
- 273,578 · +3.6%
- By 2040
- 291,506 · +10.3%
- By 2050
- 308,044 · +16.6%
- By 2075
- 349,648 · +32.3%
- By 2100
- 364,779 · +38.1%
Race, ethnicity, and origin ACS 2023
- Neighborhood character
- Predominantly White (67%)
- Race & ethnicity
- White 67% Hispanic / Latino 21% Two or more races 8% Black 6% Asian 3%
- Hispanic origin (detail)
- Mexican 13% Puerto Rican 1%
- Common ancestry
- Slovak 2% Lithuanian 2% Italian 1%
- Foreign-born
- 4% · Canada, Vietnam
- Languages at home
- 89% English-only · Spanish 8% Vietnamese 1%
Political lean MEDSL · McLennan
- 2024 margin
- Solid R (+30.9) · D 34.0% · R 64.9% · Other 1.0%
- 2008→2024 swing
- -7.0pp toward R · 2008: -23.9pp · 2024: -30.9pp
- All cycles
- 2024: R+30.9 2020: R+23.4 2016: R+27.1 2012: R+29.8 2008: R+23.9
Not yet ingested
- Civics
- —
Market trends
- HPI YoY
- ▼ -125.02%
- Current HPI
- 210.9229
- Rent YoY
- ▲ 1.57%
- Metro
- Waco, TX
- State GDP YoY
- ▲ 3.95%
- F500 in state
- 110
Industry mix (Fortune 500 HQ in TX)
| Industry | F500 HQs | Revenue |
|---|---|---|
| Energy | 16 | $1,198B |
|
||
| Technology | 5 | $198B |
|
||
| Engineering / Construction | 4 | $72B |
|
||
| Energy Services | 3 | $60B |
|
||
| Utilities | 3 | $41B |
|
||
| Healthcare | 2 | $330B |
|
||
Price history
-10.2% since first listed6 events — show timeline
- 2026-05-14 Price Changed $265,000 NTREIS
- 2026-04-15 Price Changed $275,000 NTREIS
- 2026-03-17 Price Changed $285,000 NTREIS
- 2026-02-09 Listed $295,000 NTREIS
- 2018-04-24 Sold (Public Records) — Public Records
- 1999-11-29 Sold (Public Records) — Public Records
Property tax history
+4.4%/yrLatest (2025): $5,355 · -15.6% YoY. Source: county tax records.
Cash-flow waterfall
monthlySold comps — $/sqft
last 12 mo · ≤1 miLoading sold comps…