None · Punta Gorda, FL
Flood risk 5/10 · Moderate
- FEMA flood zone
- X (unshaded)
- Chance of flooding over 30 yrs
- 0.23%
- Est. flood insurance / yr
- $507 – $1,088
Fire risk 3/10 · Minor
- Est. fire insurance / yr
- $947 – $1,759
Heat risk 10/10 · Severe
- Hot days now (above 108°F)
- 7 days/yr
- Hot days in 30 yrs
- 29 days/yr
Wind risk 10/10 · Severe
- Chance of severe wind over 30 yrs
- 99.0%
Air-quality risk 3/10 · Minor
- Unhealthy air days now
- 2 days/yr
- Unhealthy air days in 30 yrs
- 2 days/yr
Risk factors via First Street. Map © Google.
Why this score? — see what drove the F grade
The composite is a weighted blend of 9 inputs, each scored 0–100. Each bar is that input's sub-score; the figure is the points it added to the 100-point composite (weight × sub-score).
- ARV discount +7.5/15.0
- Cash flow +6.4/30.0
- Schools +4.6/10.0
- Livability +3.8/5.0
- Rent growth +2.5/5.0
- Condition / age +2.5/5.0
- 1% rule +1.8/10.0
- DSCR +0.7/10.0
- Appreciation +0.0/10.0
$390,000
🖨 Deal sheet (PDF) 📄 Offer letter ✓ Due diligence
Listing remarks
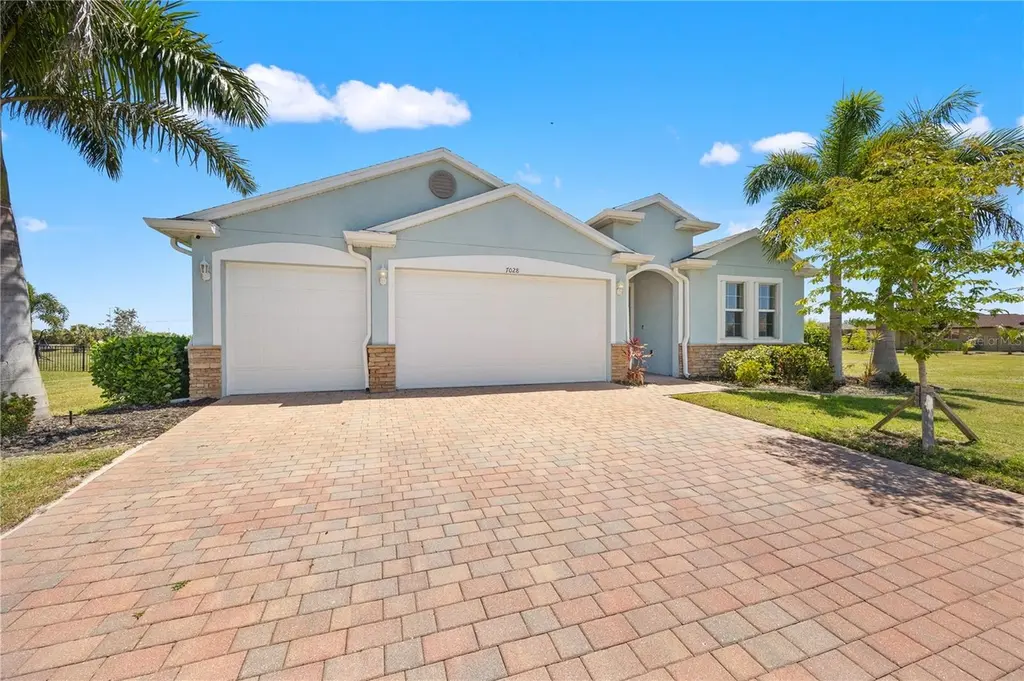
Under contract-accepting backup offers. Experience the perfect blend of modern security and Florida elegance in this meticulously upgraded * 2022-built DR Horton "Destin" model. Situated on a rare, over-sized, .46-acre cul-de-sac lot in the sought-after deed-restricted community of Burnt Store Meadows, this home offers peace of mind and luxury finishes far beyond the standard builder grade. #Key Property Highlights: * Ultimate Storm Readiness: Equipped with a whole-house Generac generator (with a 500-gallon underground propane tank), accordion hurricane shutters on all windows, and a motorized metal shutter for the lanai. * Premium Lot & Location: Located in Flood Zone
Key facts
- Gourmet kitchen
- 0.46 acre lot
- 3 garage spots
Tags
Property features AI
Finance
- Other: Total living area and building area recorded in public records
- Financial info: Lease restrictions apply
- HOA & community: Has HOA (annual fee $295 / $24.58 monthly equivalent); Association name listed; Pets allowed
Exterior
- Parking: Attached garage; 3-car garage (19x26)
- Security: Security system (leased)
- Utilities: Public water; Public sewer; Cable connected; Electricity connected
- Home design: Single family residence; One story; Faces west; Homestead exemption
- Construction: Block construction; Shingle roof; Slab foundation; Built as single-story (one level)
- Exterior features: Covered patio; Patio; Hurricane shutters; Rain gutters; Sliding doors; Irrigation equipment; Mature landscaping; Landscaped yard; Oversized lot; Asphalt road access; Publicly maintained road
Interior
- Kitchen: Dishwasher; Disposal; Microwave; Range; Refrigerator; Stone counters
- Bedrooms: 4 bedrooms
- Flooring: Carpet; Ceramic tile
- Bathrooms: 3 full bathrooms
- Heating & cooling: Central heating; Central air
- Interior features: Ceiling fans; High ceilings; Kitchen/family room combo; Living room/dining room combo; Open floorplan; Stone counters; Thermostat; Tray ceilings; Window treatments; Shades; Shutters
- Laundry & utility: Inside laundry; Washer; Dryer; Electric water heater; Inside utility room
Neighborhood map
What this means for you Summary
Snapshot
- This is a 4-bed/3.0-bath land listed at $390k.
Deal economics
- At list price, monthly cash flow is $-680 ($-8k/yr) — negative.
- To cash-flow at today's rent, offer at most $270k (30.8% below list).
- To meet the 1% rule (rent ≥ 1% of price), the offer needs to be $264k (32.3% below list).
- Recommended offer: $264k (32.3% below list) — sets the bar for 1% rule.
- Cap rate 4.2% vs local median 2.8% in Punta Gorda — top-decile yield for the area; either an underpriced asset or a hidden risk that comps aren't pricing in. Stress-test before assuming the spread holds.
Location & tenants
- Location reads 76/100 on livability (#225 in FL, #3,567 nationally) — a middle-class / working-renter tenant base. Strengths: crime A+, health & safety A+, housing B; Watch: cost of living D+, amenities D-, commute F.
- Charlotte (suburban): math 54% / reading 54% proficiency, ranked #22 of 73 in FL (top 30%) — acceptable for families but not a draw, mixed tenant base, ~2y average lease.
- Zoned schools: East Elementary School (math 67% / reading 68%, grade B+, #435 of 2,144 statewide, top 21%, 761 students, 52% FRL); Punta Gorda Middle School (math 54% / reading 52%, grade C+, #209 of 571 statewide, top 37%, 1,120 students, 41% FRL); Charlotte High School (math 44% / reading 46%, grade D-, #228 of 667 statewide, top 35%, 1,994 students, 41% FRL).
- Market conditions: 1490 active listings in the ZIP; 3 comparable units currently listed for rent nearby; rentals at typical pace (median 23d on market — plan ~3-4 weeks tenant-placement turnaround); solid renter incomes; 4,585 units permitted in Charlotte County in 2024 (703 in 5+ unit buildings).
- This rent runs 41% of the median local income ($77k/yr) — at the standard rent-burdened threshold; future hikes will face affordability resistance.
Forward outlook
- Local home prices are declining (-3.0%/yr); year-one equity from $3k of loan paydown is wiped out by about $12k of value loss. Plan a longer hold.
- Charlotte County population projected at +24% by 2050 — long-run rental-demand tailwind backs the buy-and-hold thesis.
Negotiation context
- It's been on market 35 days — a 3% lower offer ($378k) is reasonable based on typical stale-listing flexibility.
- 9 sale attempts since 11y ago with the ask held roughly flat each time — persistent listings suggest the price (not the market) is what's stuck; bring a comps-based counter.
- Current owner paid $90k; list at $390k implies a 333% gain — meaningful room to come down on a strong offer.
Risks & watch-outs
- Climate carrying-cost: moderate flood risk; severe wind risk, 99% chance of damaging wind over 30y; extreme-heat days projected 7→29/yr by 2055 (HVAC capex compounding) — expect insurance premiums to compound above CPI over the hold.
Questions for the listing agent
- What do current leases actually rent for vs. the listed asking? Can we see a recent rent roll and the last 12 months of T-12 income?
- It's been on market 35 days. Have you received any prior offers? Is the seller open to a 32% concession, seller financing, or rate buy-down credit?
- What does the HOA fee cover, when was the last increase, and are there any pending special assessments or reserve-fund shortfalls?
- Is there a deadline driving the sale (1031 exchange, divorce, estate, relocation)? That informs how much negotiation room exists.
- Schools are A-rated — typically a magnet for longer-tenancy family renters. What's the average tenant stay here, and is there a school-zone premium baked into asking?
- The area grade is low — what's the realistic commute time and amenity access for the typical tenant pool here? Any planned neighborhood developments (good or bad) we should know about?
- What's the average days-on-market for RENTAL listings here right now (not sales)? A rising rental-DOM trend means longer vacancies and softer asking-rent achievability than the comps imply.
- What's the recent tenant-quality profile in this submarket — average credit score on applications, eviction rate, late-payment / NSF rate, and stable-employment percentage? A property-management company in the area should have these aggregated.
- How much new for-sale + rental construction is in the pipeline within 1–3 miles? Heavy new supply typically softens prices + rents 12–24 months out; constrained supply supports both.
Investment metrics
- 1% rule
- 0.68% ✗
- Cap rate
- 4.20%
- Cash-on-cash
- -7.47%
- DSCR
- 0.67
- GRM
- 12.3
CMA / ARV
No comps found within radius.
Projected returns pro-forma
-3.0% appreciation · 3.0% rent growth · sell at horizon
- IRR
- -29.3%
- Equity multiple
- 0.03×
- Total profit
- $-106,418
- Equity at exit
- $58,150
- IRR
- -29.6%
- Equity multiple
- -0.36×
- Total profit
- $-148,088
- Equity at exit
- $33,720
Cash invested: $109,200 (down + closing). Projections, not guarantees.
Landlord ↔ Tenant lean methodology
- Overall (STATE)
- 87 Strongly Landlord-Friendly
- State Florida
- 87 Strongly Landlord-Friendly · R+3
- County
- — inherits STATE
- City
- — inherits STATE
ZIP-level market 33955
- Home prices YoY
- -24.5%
- Active inventory
- 1490
- Price-to-rent
- 12.3×
Monthly cashflow live
- Estimated rent
- $2,641 medium interval (Pro) →
- Mortgage (P&I)
- −$2,045
- Tax from tax record
- −$535 /mo · $6,418/yr
- Insurance
- −$162
- HOA
- −$24
- Vacancy / Maint / Mgmt
- −$555
- Net cashflow
- $-680
Break-even live
Sensitivity live
| Price | -10% $-459 | -5% $-570 | +0% $-680 | +5% $-790 | +10% $-901 |
|---|---|---|---|---|---|
| Rent | -10% $-889 | -5% $-784 | +0% $-680 | +5% $-576 | +10% $-471 |
| Rate | -1.0pp $-484 | -0.5pp $-581 | base $-680 | +0.5pp $-781 | +1.0pp $-884 |
UW: 25.0% down · 7.5% · 30yr · 1.5% tax · 5.0% vac · 8.0% maint · 8.0% mgmt
Financing live
Cash to close
- Down payment
- $97,500
- Closing costs
- $11,700
- Reserves months
- —
- Total cash needed
- —
Loan-product check · same deal, 3 products live
Conventional
25% down · 7.5% · 30yr
- Down + closing
- —
- Monthly P&I
- —
- Monthly cashflow
- —
- DSCR
- —
- Eligible?
- —
Personal DTI + credit; lowest rate.
DSCR
20% down · 8.5% · 30yr
- Down + closing
- —
- Monthly P&I
- —
- Monthly cashflow
- —
- DSCR
- —
- Eligible?
- —
No personal income docs; deal must DSCR.
Hard money
10% down · 12.0% · 12mo
- Down + closing
- —
- Monthly P&I
- —
- Monthly cashflow
- —
- DSCR
- —
- Eligible?
- —
Short-term bridge; refi at stabilization.
Rent comps 3 comps
| Address | Beds | Baths | Sqft | Rent | $/sqft | DOM | Units | Dist |
|---|---|---|---|---|---|---|---|---|
| 9489 Turtle Grass Cir Punta Gorda, FL | 4.0 | 2.0 | 1828 | $2,500 | $1.37 | 15d | 1 | 0.80mi |
| 9996 Spring Gulch Ln Punta Gorda, FL | 4.0 | 2.0 | 1950 | $1,895 | $0.97 | 23d | 1 | 0.92mi |
| 9975 Bishop Creek Way Punta Gorda, FL | 3.0 | 2.0 | 1899 | $2,300 | $1.21 | 23d | 1 | 0.93mi |
HOA detail
- Monthly dues
- $24 · $288/yr
- Likely covers
- security
Listing history 28 events
-
2026-05-31status $390,000 Pending 35 DOM
-
2026-05-30days on market $390,000 Active 35 DOM
-
2026-04-25$400,000 Active
-
2026-04-09historical
-
2026-04-09historical
-
2026-04-02price $465,000
-
2026-04-02price $465,000
-
2026-03-12price $485,000
-
2026-03-12price $485,000
-
2026-02-25price $525,000
-
2026-02-25price $525,000
-
2026-02-02price $540,000
-
2026-02-02price $540,000
-
2025-10-30status Active
-
2025-10-30$545,000 Active
-
2025-08-07historical
-
2025-08-07historical
-
2025-04-10$545,000 Active
-
2025-04-10$545,000 Active
-
2022-06-30$415,200
-
2021-03-08soldstatus $90,000
-
2018-05-22historical
-
2016-12-20$45,000 Active
-
2016-09-08historical
-
2016-01-14status Active
-
2016-01-13historical
-
2015-09-10$49,900 Active
-
1988-12-01soldstatus $567,900
ⓘ Source: listings_history table (triggers on properties + properties_extension) + one-shot
backfill from property_details.listing_events for pre-trigger history.
Tax reassessment forecast FL · Resets to sale price
- Current annual tax
- $6,418 · $535/mo
- Projected year-2 tax
- $6,418 · $535/mo
- Expected delta
- $0/yr ($0/mo · 0.0%)
ⓘ Screening estimate from a state-policy table — verify with the county assessor before closing.
Climate risk First Street
- Flood 5/10 Major FEMA zone X (unshaded) · 23% chance over 30 yrs
- Wildfire 3/10 Moderate
- Heat 10/10 Extreme 7 d/yr ≥108°F today · 29 d/yr by 30 yrs out
- Wind 10/10 Extreme 99% chance of damaging wind over 30 yrs
- Air quality 3/10 Moderate 2 unhealthy d/yr today · 2 by 30 yrs out
Nearby sold comps map
Loading sold comps map…
Walkable amenities ~0.75 mi
Loading nearby amenities…
Taxation est. · year 1
- Rental income
- $31,696
- − Mortgage interest
- −$21,846
- − Property taxes
- −$6,418
- − Insurance
- −$1,950
- − Repairs & maintenance
- −$2,536
- − Management
- −$2,536
- − HOA
- −$288
- − Depreciation
- −$11,345
- Taxable loss
- −$15,223
- Est. tax savings @ 24.0%
- +$3,654
- After-tax cash flow
- $-4,505/yr
For passive investors: Depreciation is non-cash, so a rental often shows a tax loss while cash-flowing — sheltering income. Rental losses are passive: they offset passive income freely, and up to $25,000/yr can offset ordinary (W-2) income if you actively participate and your MAGI is under $100k (phasing out to $0 by $150k); unused losses carry forward. On sale, claimed depreciation is recaptured at up to 25%, and gains may owe capital-gains tax (a 1031 exchange can defer both). Figures are a year-1 estimate at your 24.0% rate — not tax advice; consult a CPA.
Schools (NCES district)
- District
- Charlotte
- NCES district ID
- 1200240
- Math proficiency
- 54% ▼ -6.00%
- Reading proficiency
- 54% ▼ -1.00%
- Median HH income
- $44,864
- Composite
- 45.62/100
- National rank
- #2586
- State rank
- #22 of 73 in FL
Livability — Punta Gorda
- Score
- 76/100
- State rank
- #225
- US rank
- #3567
Category grades
Schools grade is shown separately in the Schools card above.
Census & demographics
- Census place
- Punta Gorda, FL
- County
- Charlotte County · 196,994 people
- City population
- 68,831
- Metro
- Punta Gorda, FL
- Population (ZIP)
- 12,399
- Household income
- $76,943
- Rent vs Own
- Severe rent burden
- 226.0
Population outlook (Charlotte County) Hauer SSP2
- Today (2025)
- 198,646 people
- By 2030
- 210,507 · +6.0%
- By 2040
- 230,857 · +16.2%
- By 2050
- 247,148 · +24.4%
- By 2075
- 281,777 · +41.8%
- By 2100
- 293,609 · +47.8%
Race, ethnicity, and origin ACS 2023
- Neighborhood character
- Predominantly White (84%)
- Race & ethnicity
- White 84% Hispanic / Latino 10% Two or more races 9% Black 2%
- Hispanic origin (detail)
- Mexican 4% Puerto Rican 2% Cuban 4%
- Common ancestry
- Romanian 5% Italian 3% Serbian 3%
- Foreign-born
- 8% · Canada
- Languages at home
- 91% English-only · Spanish 5% Other Indo-European 1%
Political lean MEDSL · Charlotte
- 2024 margin
- Solid R (+34.0) · D 32.7% · R 66.7%
- 2008→2024 swing
- -26.7pp toward R · 2008: -7.2pp · 2024: -34.0pp
- All cycles
- 2024: R+34.0 2020: R+26.6 2016: R+27.8 2012: R+14.3 2008: R+7.2
Not yet ingested
- Civics
- —
Market trends
- HPI YoY
- ▼ -78.71%
- Current HPI
- 242.9043
- Rent YoY
- —
- Metro
- Punta Gorda, FL
- State GDP YoY
- ▲ 3.28%
- F500 in state
- 36
Industry mix (Fortune 500 HQ in FL)
| Industry | F500 HQs | Revenue |
|---|---|---|
| Industrial Technology | 2 | $29B |
|
||
| Insurance | 2 | $17B |
|
||
| Retail | 1 | $60B |
|
||
| Technology Distribution | 1 | $58B |
|
||
| Homebuilding | 1 | $35B |
|
||
| Technology Manufacturing | 1 | $35B |
|
||
Price history
-29.6% since first listed26 events — show timeline
- 2026-04-25 Listed $400,000 Stellar MLS as Distributed by MLS Grid
- 2026-04-09 Listing Removed — FORTMLS
- 2026-04-09 Listing Removed — Stellar MLS as Distributed by MLS Grid
- 2026-04-02 Price Changed $465,000 FORTMLS
- 2026-04-02 Price Changed $465,000 Stellar MLS as Distributed by MLS Grid
- 2026-03-12 Price Changed $485,000 Stellar MLS as Distributed by MLS Grid
- 2026-03-12 Price Changed $485,000 FORTMLS
- 2026-02-25 Price Changed $525,000 Stellar MLS as Distributed by MLS Grid
- 2026-02-25 Price Changed $525,000 FORTMLS
- 2026-02-02 Price Changed $540,000 Stellar MLS as Distributed by MLS Grid
- 2026-02-02 Price Changed $540,000 FORTMLS
- 2025-10-30 Relisted — FORTMLS
- 2025-10-30 Listed $545,000 Stellar MLS as Distributed by MLS Grid
- 2025-08-07 Listing Removed — Stellar MLS as Distributed by MLS Grid
- 2025-08-07 Listing Removed — FORTMLS
- 2025-04-10 Listed $545,000 Stellar MLS as Distributed by MLS Grid
- 2025-04-10 Listed $545,000 FORTMLS
- 2022-06-30 Listed $415,200 Stellar MLS as Distributed by MLS Grid
- 2021-03-08 Sold (Public Records) $90,000 Public Records
- 2018-05-22 Listing Removed — Stellar MLS as Distributed by MLS Grid
- 2016-12-20 Listed $45,000 Stellar MLS as Distributed by MLS Grid
- 2016-09-08 Listing Removed — Stellar MLS as Distributed by MLS Grid
- 2016-01-14 Relisted — Stellar MLS as Distributed by MLS Grid
- 2016-01-13 Listing Removed — Stellar MLS as Distributed by MLS Grid
- 2015-09-10 Listed $49,900 Stellar MLS as Distributed by MLS Grid
- 1988-12-01 Sold (Public Records) $567,900 Public Records
Property tax history
+23.9%/yrLatest (2025): $6,418 · +1.5% YoY. Source: county tax records.
Cash-flow waterfall
monthlySold comps — $/sqft
last 12 mo · ≤1 miLoading sold comps…