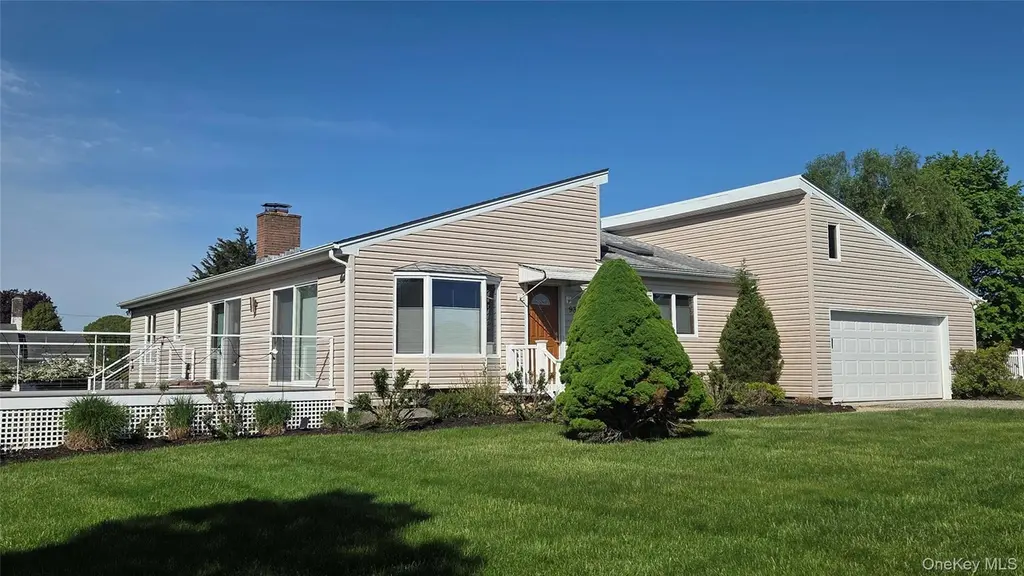
930 Cedar Ln · East Marion, NY
Flood risk 1/10 · Minimal
- FEMA flood zone
- X (unshaded)
- Chance of flooding over 30 yrs
- 0.0%
- Est. flood insurance / yr
- $473 – $860
Fire risk 1/10 · Minimal
- Est. fire insurance / yr
- $691 – $1,283
Heat risk 5/10 · Moderate
- Hot days now (above 90°F)
- 7 days/yr
- Hot days in 30 yrs
- 20 days/yr
Wind risk 8/10 · Major
- Chance of severe wind over 30 yrs
- 80.0%
Air-quality risk 2/10 · Minimal
- Unhealthy air days now
- 2 days/yr
- Unhealthy air days in 30 yrs
- 2 days/yr
Risk factors via First Street. Map © Google.
Why this score? — see what drove the B+ grade
The composite is a weighted blend of 9 inputs, each scored 0–100. Each bar is that input's sub-score; the figure is the points it added to the 100-point composite (weight × sub-score).
- Cash flow +30.0/30.0
- ARV discount +11.1/15.0
- DSCR +10.0/10.0
- 1% rule +8.5/10.0
- Appreciation +6.7/10.0
- Schools +4.3/10.0
- Livability +2.9/5.0
- Rent growth +2.5/5.0
- Condition / age +2.5/5.0
$999,000
🖨 Deal sheet 📄 Offer letter ✓ Due diligence
Listing remarks
Overlooking acres of Lavender fields, this sleek, Scandinavian post-modern ranch home is a study in minimalist warmth, highlighted by striking beamed cedar ceilings and an inviting, wood-burning fireplace. The bright, open layout in the living area allows access from 4 sets of sliding doors to both a deck with lavender views, and also a sheltered patio for those windier North Fork fall days. The recently renovated kitchen, open to the living-dining area, is designed keeping both style and function in mind. There are two large bedrooms: an en-suite primary with a recently renovated bath, and a second bedroom big enough to convert to 2! There is also an additional recently renovated full bath
Key facts
- 0.66 acre lot
- 2 garage spots
- Built 1988
Property features AI
Finance
- HOA & community: Annual road maintenance fee of $650
Exterior
- Parking: Attached garage; 2-car garage; No carport
- Security: Building security
- Utilities: Electric service by PSEG; Cesspool septic; Cable connected; Electricity connected; Private trash collection
- Home design: Single family residence; Actual property condition
- Construction: Frame construction; Full basement; Attic access via scuttle
- Exterior features: Deck; Patio; Building security
Interior
- Kitchen: Dishwasher; Range; Refrigerator; Stainless steel appliances; Exhaust fan; Open kitchen
- Bedrooms: 4 rooms total (includes bedrooms and living spaces)
- Bathrooms: 2 full bathrooms
- Heating & cooling: Central air; Ducted heating
- Interior features: First-floor bedroom; First-floor full bathroom; Beamed ceilings; Natural woodwork; Open floor plan; Open kitchen; Primary bathroom
- Laundry & utility: Washer; Dryer
Neighborhood map
What this means for you Summary
Snapshot
- This is a 2-bed/2.0-bath single-family listed at $999k.
Deal economics
- At list price, monthly cash flow is $5k ($55k/yr) — positive.
- The deal already cash-flows at list — no discount required.
- Meets the 1% rule at list price ($13k rent vs $999k).
- Recommended offer: $984k (1.5% below list) — sets the bar for market timing.
Location & tenants
- Location reads 58/100 on livability (#1,051 in NY) — a working-class tenant base; expect higher turnover. Strengths: crime A+, employment A+, health & safety A; Watch: housing C-, amenities F, commute F.
- Oysterponds Union Free School District (rural): math 30% / reading 60% proficiency, ranked #506 of 755 in NY (top 67%) — families likely to look elsewhere, expect single-tenant / working-renter base with shorter leases; only 4% free/reduced lunch — higher-income household profile.
- Zoned schools: Oysterponds Elementary School (math 54% / reading 64%, grade B-, #745 of 2,108 statewide, top 39%, 80 students, 0% FRL) — zoned schools at 0% FRL track the district average.
- Zoned-school proficiency averages 60% at this address vs 45% district-wide (+14 pts) — the actual schools serving this property are materially stronger than the Oysterponds Union Free School District average implies; a family-tenant draw the district grade alone would hide.
- Market conditions: 19 active listings in the ZIP; 9 comparable units currently listed for rent nearby; rentals lingering (median 44d on market — plan ~5-8 weeks vacancy on turnover, expect pricing pressure); 67% of comp listings sitting > 30 days — soft ceiling on asking rent; 1,366 units permitted in Suffolk County in 2024 (216 in 5+ unit buildings).
Forward outlook
- In year one you build about $42k of equity ($7k loan paydown + $35k appreciation (3.5% local appreciation)).
- Suffolk County population projected to shrink 5% by 2050 — rents likely to lag national; underwrite the cash flow, not the appreciation.
- At projected returns (3.5% appreciation + 3.0% rent growth), your $280k cash investment doubles in ~3 years — after that, you're playing with house money.
- By year 2, paydown + projected appreciation supports a ~$67k cash-out refi (75% LTV) — recoverable capital for the next deal without selling this one.
Negotiation context
- It's been on market 30 days — a 2% lower offer ($984k) is reasonable based on typical stale-listing flexibility.
Risks & watch-outs
- Climate carrying-cost: severe wind risk, 80% chance of damaging wind over 30y; extreme-heat days projected 7→20/yr by 2055 (HVAC capex compounding) — expect insurance premiums to compound above CPI over the hold.
Questions for the listing agent
- Is there a deadline driving the sale (1031 exchange, divorce, estate, relocation)? That informs how much negotiation room exists.
- Schools are D-rated, which usually means shorter tenancies and higher turnover. Who's the typical renter profile here, and what's been the actual vacancy rate?
- What's the average days-on-market for RENTAL listings here right now (not sales)? A rising rental-DOM trend means longer vacancies and softer asking-rent achievability than the comps imply.
- What's the recent tenant-quality profile in this submarket — average credit score on applications, eviction rate, late-payment / NSF rate, and stable-employment percentage? A property-management company in the area should have these aggregated.
- How much new for-sale + rental construction is in the pipeline within 1–3 miles? Heavy new supply typically softens prices + rents 12–24 months out; constrained supply supports both.
Investment metrics
- 1% rule
- 1.35% ✓
- Cap rate
- 11.79%
- Cash-on-cash
- 19.64%
- DSCR
- 1.87
- GRM
- 6.2
CMA / ARV
- ARV (on-the-fly)
- $1,085,408
- Comps found
- 3
Show comp detail 3 sales within ~0.75 mi
| Address | Dist | Beds/Ba | Sqft | Sold | Price | $/sf | Match |
|---|---|---|---|---|---|---|---|
| 600 Shipyard Ln | 0.26mi | 3/2.5 (+1) | 1,800 (+5%) | 9mo | $1,100,000 | $611 | 65 |
| 75 Gull Pond Ln | 0.70mi | 3/2.0 (+1) | 1,655 (-3%) | 10mo | $1,050,000 | $634 | 48 |
| 240 Knoll Cir | 0.40mi | 3/1.5 (+1) | 1,476 (-14%) | 19mo | $1,300,000 | $881 | 35 |
Match score weights: distance 35% · size 25% · config 20% · recency 20%. Top-matched comps best support the ARV.
Projected returns pro-forma
3.47% appreciation · 3.0% rent growth · sell at horizon
- IRR
- 26.9%
- Equity multiple
- 2.56×
- Total profit
- $436,600
- Equity at exit
- $475,859
- IRR
- 27.1%
- Equity multiple
- 4.99×
- Total profit
- $1,114,981
- Equity at exit
- $754,797
Cash invested: $279,720 (down + closing). Projections, not guarantees.
Landlord ↔ Tenant lean methodology
- Overall (STATE)
- 15 Strongly Tenant-Friendly
- State New York
- 15 Strongly Tenant-Friendly · D+10
- County
- — inherits STATE
- City
- — inherits STATE
ZIP-level market 11939
- Home prices YoY
- 1.2%
- Active inventory
- 19
- Price-to-rent
- 6.2×
Monthly cashflow live
- Estimated rent
- $13,454 high interval (Pro) →
- Mortgage (P&I)
- −$5,239
- Tax from tax record
- −$396 /mo · $4,757/yr
- Insurance
- −$416
- HOA
- −$0
- Vacancy / Maint / Mgmt
- −$2,825
- Net cashflow
- $4,577
Break-even live
UW: 25.0% down · 7.5% · 30yr · 1.5% tax · 5.0% vac · 8.0% maint · 8.0% mgmt
Financing live
Cash to close
- Down payment
- $249,750
- Closing costs
- $29,970
- Reserves months
- —
- Total cash needed
- —
Loan-product check · same deal, 3 products live
Conventional
25% down · 7.5% · 30yr
- Down + closing
- —
- Monthly P&I
- —
- Monthly cashflow
- —
- DSCR
- —
- Eligible?
- —
Personal DTI + credit; lowest rate.
DSCR
20% down · 8.5% · 30yr
- Down + closing
- —
- Monthly P&I
- —
- Monthly cashflow
- —
- DSCR
- —
- Eligible?
- —
No personal income docs; deal must DSCR.
Hard money
10% down · 12.0% · 12mo
- Down + closing
- —
- Monthly P&I
- —
- Monthly cashflow
- —
- DSCR
- —
- Eligible?
- —
Short-term bridge; refi at stabilization.
Rent comps 9 comps
| Address | Beds | Baths | Sqft | Rent | $/sqft | DOM | Units | Dist |
|---|---|---|---|---|---|---|---|---|
| 300 Marion Pl East Marion, NY | 3.0 | 2.0 | 1750 | $19,000 | $10.86 | 24d | 1 | 0.39mi |
| 460 Bay Ave East Marion, NY | 3.0 | 1.5 | 1500 | $8,000 | $5.33 | 43d | 1 | 0.41mi |
| 580 South Ln East Marion, NY | 3.0 | 2.5 | 2000 | $20,000 | $10.00 | 19d | 1 | 0.46mi |
| 1850 Rocky Point Rd East Marion, NY | 3.0 | 2.0 | 1140 | $10,000 | $8.77 | 43d | 1 | 0.52mi |
| 870 Stars Rd East Marion, NY | 3.0 | 3.0 | 1500 | $10,000 | $6.67 | 43d | 1 | 0.65mi |
| 3045 Rocky Point Rd East Marion, NY | 3.0 | 2.0 | 2025 | $12,000 | $5.93 | 43d | 1 | 0.74mi |
| 123 Sterling Ave #2 Greenport, NY | 3.0 | 3.0 | 1528 | $45,000 | $29.45 | 43d | 1 | 1.30mi |
| 123 Sterling Ave #1 Greenport, NY | 1.0 | 1.5 | 1521 | $8,000 | $5.26 | 17d | 1 | 1.30mi |
| 744 Main St Unit 2 Greenport, NY | 2.0 | 2.0 | 1200 | $3,400 | $2.83 | 43d | 1 | 1.32mi |
Listing history 16 events
-
2026-06-18days on market $999,000 Active 30 DOM
-
2026-06-17days on market $999,000 Active 29 DOM
-
2026-06-16days on market $999,000 Active 28 DOM
-
2026-06-15days on market $999,000 Active 27 DOM
-
2026-06-13days on market $999,000 Active 25 DOM
-
2026-06-12days on market $999,000 Active 24 DOM
-
2026-06-09days on market $999,000 Active 21 DOM
-
2026-06-08days on market $999,000 Active 20 DOM
-
2026-06-07days on market $999,000 Active 19 DOM
-
2026-06-07days on market $999,000 Active 18 DOM
-
2026-06-04days on market $999,000 Active 15 DOM
-
2026-06-02days on market $999,000 Active 14 DOM
-
2026-06-01days on market $999,000 Active 13 DOM
-
2026-05-31days on market $999,000 Active 12 DOM
-
2026-05-20$999,000 Active
-
2026-05-16historical $999,000
ⓘ Source: listings_history table (triggers on properties + properties_extension) + one-shot
backfill from property_details.listing_events for pre-trigger history.
Tax reassessment forecast NY · Partial reset (capped growth)
- Current annual tax
- $4,757 · $396/mo
- Projected year-2 tax
- $10,820 · $902/mo
- Expected delta
- +$6,063/yr (+$505/mo · 127.5%)
ⓘ Screening estimate from a state-policy table — verify with the county assessor before closing.
Climate risk First Street
- Flood 1/10 Low FEMA zone X (unshaded) · 0% chance over 30 yrs
- Wildfire 1/10 Low
- Heat 5/10 Major 7 d/yr ≥90°F today · 20 d/yr by 30 yrs out
- Wind 8/10 Severe 80% chance of damaging wind over 30 yrs
- Air quality 2/10 Low 2 unhealthy d/yr today · 2 by 30 yrs out
Nearby sold comps map
Loading sold comps map…
Walkable amenities ~0.75 mi
Loading nearby amenities…
Taxation est. · year 1
- Rental income
- $161,446
- − Mortgage interest
- −$55,960
- − Property taxes
- −$4,757
- − Insurance
- −$4,995
- − Repairs & maintenance
- −$12,916
- − Management
- −$12,916
- − Depreciation
- −$29,062
- Taxable income
- $40,841
- Est. tax owed @ 24.0%
- −$9,802
- After-tax cash flow
- $45,122/yr
For passive investors: Depreciation is non-cash, so a rental often shows a tax loss while cash-flowing — sheltering income. Rental losses are passive: they offset passive income freely, and up to $25,000/yr can offset ordinary (W-2) income if you actively participate and your MAGI is under $100k (phasing out to $0 by $150k); unused losses carry forward. On sale, claimed depreciation is recaptured at up to 25%, and gains may owe capital-gains tax (a 1031 exchange can defer both). Figures are a year-1 estimate at your 24.0% rate — not tax advice; consult a CPA.
Schools (NCES district)
- District
- Oysterponds Union Free School District
- NCES district ID
- 3621930
- Math proficiency
- 30% ▼ -10.00%
- Reading proficiency
- 60% ▲ 20.00%
- Median HH income
- $71,948
- Composite
- 42.9/100
- National rank
- #6712
- State rank
- #506 of 755 in NY
Livability — East Marion
- Score
- 58/100
- State rank
- #1051
- US rank
- #20822
Category grades
Schools grade is shown separately in the Schools card above.
Census & demographics
- Census place
- East Marion, NY
- Population (ZIP)
- 1,741
Population outlook (Suffolk County) Hauer SSP2
- Today (2025)
- 1,505,262 people
- By 2030
- 1,498,318 · -0.5%
- By 2040
- 1,471,101 · -2.3%
- By 2050
- 1,424,848 · -5.3%
- By 2075
- 1,337,157 · -11.2%
- By 2100
- 1,217,720 · -19.1%
Race, ethnicity, and origin ACS 2023
- Neighborhood character
- Predominantly White (93%)
- Race & ethnicity
- White 93% Hispanic / Latino 4% Two or more races 2%
- Common ancestry
- Romanian 4% Scottish 1% Scotch-Irish 1%
- Foreign-born
- 9% · China
- Languages at home
- 89% English-only · Other Indo-European 7% Other Asian/Pacific 3% German/W. Germanic 1%
Political lean MEDSL · Suffolk
- 2024 margin
- Lean R (+10.0) · D 45.0% · R 55.0%
- 2008→2024 swing
- -16.0pp toward R · 2008: 6.0pp · 2024: -10.0pp
- All cycles
- 2024: R+10.0 2020: R+0.0 2016: R+8.2 2012: D+2.9 2008: D+6.0
Not yet ingested
- Civics
- —
Market trends
- HPI YoY
- ▲ 3.47%
- Current HPI
- 281.05
- Rent YoY
- —
- Metro
- —
- State GDP YoY
- ▲ 2.60%
- F500 in state
- 92
Industry mix (Fortune 500 HQ in NY)
| Industry | F500 HQs | Revenue |
|---|---|---|
| Financial Services | 10 | $950B |
|
||
| Consumer Goods | 9 | $162B |
|
||
| Insurance | 4 | $225B |
|
||
| Telecommunications | 2 | $144B |
|
||
| Pharmaceuticals | 2 | $112B |
|
||
| Media / Entertainment | 2 | $69B |
|
||
Price history
+0.0% since first listed2 events — show timeline
- 2026-05-20 Listed $999,000 OneKey® MLS as Distributed by MLS Grid
- 2026-05-16 Coming Soon $999,000 OneKey® MLS as Distributed by MLS Grid
Property tax history
+1.1%/yrLatest (2025): $4,757 · +0.0% YoY. Source: county tax records.
Cash-flow waterfall
monthlySold comps — $/sqft
last 12 mo · ≤1 miLoading sold comps…