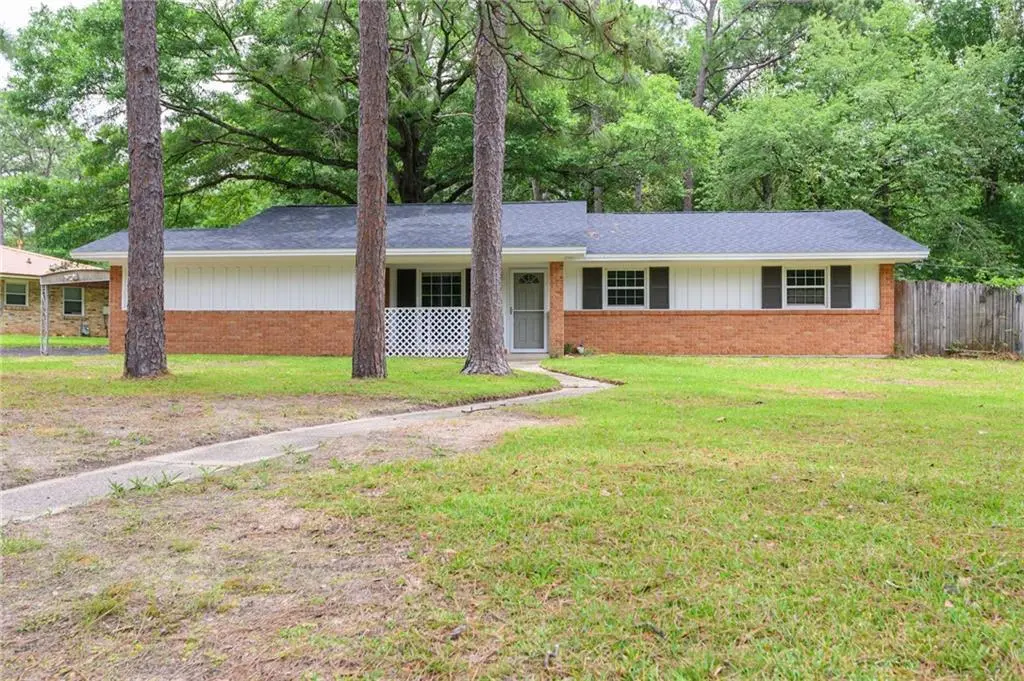
800 Graymont Dr · Mobile, AL
Flood risk 1/10 · Minimal
- FEMA flood zone
- X (unshaded)
- Chance of flooding over 30 yrs
- 0.0%
- Est. flood insurance / yr
- $507 – $1,088
Fire risk 3/10 · Minor
- Est. fire insurance / yr
- $916 – $1,700
Heat risk 9/10 · Severe
- Hot days now (above 104°F)
- 7 days/yr
- Hot days in 30 yrs
- 21 days/yr
Wind risk 9/10 · Severe
- Chance of severe wind over 30 yrs
- 99.0%
Air-quality risk 1/10 · Minimal
- Unhealthy air days now
- 0 days/yr
- Unhealthy air days in 30 yrs
- 0 days/yr
Risk factors via First Street. Map © Google.
Why this score? — see what drove the B- grade
The composite is a weighted blend of 9 inputs, each scored 0–100. Each bar is that input's sub-score; the figure is the points it added to the 100-point composite (weight × sub-score).
- Cash flow +27.3/30.0
- ARV discount +11.5/15.0
- DSCR +9.5/10.0
- 1% rule +6.1/10.0
- Rent growth +4.0/5.0
- Livability +3.8/5.0
- Condition / age +2.5/5.0
- Schools +2.3/10.0
- Appreciation +0.0/10.0
$155,000
🖨 Deal sheet 📄 Offer letter ✓ Due diligence
Listing remarks
* * * MOTIVATED SELLER * * * Investor special, priced below market value with endless renovation potential and the opportunity to make it your own! Spacious 3-bedroom, 2-bath brick home situated on a large 1/2-acre corner lot in an established neighborhood near the University of South Alabama campus. Features include NEW ROOF October 2025, fenced backyard, covered back patio, covered carport, fireplace, bonus room, mature trees, and slab foundation. Seller states there is possibly parquet flooring under carpet! Original tile in bathrooms and Mid-Century Modern Cone Fireplace add so much charm and character! Home needs some love but offers great upside for investors or buyers looking to
Key facts
- Covered carport
- Bonus room
- Covered back patio
Tags
Property features AI
Exterior
- Parking: Carport; Driveway; 3 total parking spaces (including 1 carport space)
- Utilities: Cable available; Electricity available (110 volts); Phone available; Public sewer
- Home design: Single family residence; Residential property; Located in Park Forest Estates
- Construction: Brick 4 sides construction; Built in 1962; Shingle roof; Slab foundation
- Exterior features: Chain link fencing; No pool or spa; View available
Interior
- Kitchen: Dishwasher; Range hood; White cabinets
- Bedrooms: 3 bedrooms
- Flooring: Carpet; Ceramic tile
- Bathrooms: 2 full bathrooms
- Heating & cooling: Central heating; Central air conditioning
- Interior features: Other; Fireplace in the living room; Great room dining area; Kitchen with white cabinets
Neighborhood map
What this means for you Summary
Snapshot
- This is a 3-bed/2.0-bath single-family listed at $155k.
Deal economics
- At list price, monthly cash flow is $447 ($5k/yr) — positive.
- The deal already cash-flows at list — no discount required.
- Meets the 1% rule at list price ($2k rent vs $155k).
- Recommended offer: $150k (3.0% below list) — sets the bar for market timing.
- Cap rate 9.7% vs local median 4.9% in Mobile — top-decile yield for the area; either an underpriced asset or a hidden risk that comps aren't pricing in. Stress-test before assuming the spread holds.
Location & tenants
- Location reads 75/100 on livability (#20 in AL, #4,262 nationally) — a middle-class / working-renter tenant base. Strengths: commute A+, cost of living A+, housing A+; Watch: crime F, employment D-.
- Mobile County (urban): math 15% / reading 39% proficiency, ranked #81 of 129 in AL (top 63%) — low school quality limits family demand, transient renter base, plan for 1-2y turnover; 67% free/reduced lunch — lower-income household profile, screen leases tightly.
- Zoned schools: John Will Elementary School (math 4% / reading 21%, grade F, #534 of 627 statewide, top 85%, 509 students, 89% FRL); Mattie T Blount High School (math 2% / reading 3%, grade F, #291 of 305 statewide, top 100%, 1,176 students, 86% FRL) — zoned schools average 87% FRL vs 67% district-wide (20 pts higher); higher-poverty schools than district average — tighter screening recommended.
- Zoned-school proficiency averages 8% at this address vs 27% district-wide (-20 pts) — the specific schools serving this property underperform the Mobile County average; the district grade overstates school quality for this exact location.
- Market conditions: Rents rising fast (+6.2%/yr); 338 active listings in the ZIP; 26 comparable units currently listed for rent nearby; rentals at typical pace (median 21d on market — plan ~3-4 weeks tenant-placement turnaround); 1,678 units permitted in Mobile County in 2024 (264 in 5+ unit buildings).
- This rent runs 34% of the median local income ($61k/yr) — at the standard rent-burdened threshold; future hikes will face affordability resistance.
Forward outlook
- Local home prices are declining (-3.0%/yr); year-one equity from $1k of loan paydown is wiped out by about $5k of value loss. Plan a longer hold.
- Mobile County population projected to shrink 8% by 2050 — rents likely to lag national; underwrite the cash flow, not the appreciation.
- At projected returns (-3.0% appreciation + 6.2% rent growth), your $43k cash investment doubles in ~8 years — after that, you're playing with house money.
Negotiation context
- It's been on market 32 days — a 3% lower offer ($150k) is reasonable based on typical stale-listing flexibility.
- 2 sale attempts with the ask held roughly flat each time — persistent listings suggest the price (not the market) is what's stuck; bring a comps-based counter.
Risks & watch-outs
- Climate carrying-cost: severe wind risk, 99% chance of damaging wind over 30y; extreme-heat days projected 7→21/yr by 2055 (HVAC capex compounding) — expect insurance premiums to compound above CPI over the hold.
Questions for the listing agent
- It's been on market 32 days. Have you received any prior offers? Is the seller open to a 3% concession, seller financing, or rate buy-down credit?
- Built in 1962 — when were the roof, HVAC, electrical panel, plumbing, and water heater last replaced?
- Is there a deadline driving the sale (1031 exchange, divorce, estate, relocation)? That informs how much negotiation room exists.
- Schools are D-rated, which usually means shorter tenancies and higher turnover. Who's the typical renter profile here, and what's been the actual vacancy rate?
- Crime grade is F in this area — have there been break-ins, vandalism, or insurance claims at this property in the last 3 years? What carrier currently insures it and at what premium?
- What's the average days-on-market for RENTAL listings here right now (not sales)? A rising rental-DOM trend means longer vacancies and softer asking-rent achievability than the comps imply.
- What's the recent tenant-quality profile in this submarket — average credit score on applications, eviction rate, late-payment / NSF rate, and stable-employment percentage? A property-management company in the area should have these aggregated.
- How much new for-sale + rental construction is in the pipeline within 1–3 miles? Heavy new supply typically softens prices + rents 12–24 months out; constrained supply supports both.
Investment metrics
- 1% rule
- 1.11% ✓
- Cap rate
- 9.75%
- Cash-on-cash
- 12.35%
- DSCR
- 1.55
- GRM
- 7.5
CMA / ARV
- ARV (median comp)
- $170,193
- List price
- $155,000
- Delta
- -8.93%
- Verdict
- FAIR
- Comps
- 20 within 1.0 mi
Show comp detail 3 sales within ~0.75 mi
| Address | Dist | Beds/Ba | Sqft | Sold | Price | $/sf | Match |
|---|---|---|---|---|---|---|---|
| 5964 Montfort Rd S | 0.14mi | 3/2.0 | 1,395 (+6%) | 1mo | $170,000 | $122 | 82 |
| 816 E Montfort Rd | 0.15mi | 3/1.5 | 1,383 (+5%) | 14mo | $152,500 | $110 | 70 |
| 951 Wendover Rd | 0.21mi | 3/2.0 | 1,208 (-8%) | 9mo | $225,000 | $186 | 69 |
Match score weights: distance 35% · size 25% · config 20% · recency 20%. Top-matched comps best support the ARV.
Projected returns pro-forma
-3.0% appreciation · 6.15% rent growth · sell at horizon
- IRR
- 5.1%
- Equity multiple
- 1.21×
- Total profit
- $8,899
- Equity at exit
- $23,111
- IRR
- 17.0%
- Equity multiple
- 2.59×
- Total profit
- $68,805
- Equity at exit
- $13,402
Cash invested: $43,400 (down + closing). Projections, not guarantees.
Landlord ↔ Tenant lean methodology
- Overall (STATE)
- 90 Strongly Landlord-Friendly
- State Alabama
- 90 Strongly Landlord-Friendly · R+15
- County
- — inherits STATE
- City
- — inherits STATE
ZIP-level market 36608
- Rents YoY
- 6.2%
- Active inventory
- 338
- Price-to-rent
- 7.5×
Monthly cashflow live
- Estimated rent
- $1,727 high interval (Pro) →
- Mortgage (P&I)
- −$813
- Tax from tax record
- −$40 /mo · $481/yr
- Insurance
- −$65
- HOA
- −$0
- Vacancy / Maint / Mgmt
- −$363
- Net cashflow
- $447
Break-even live
UW: 25.0% down · 7.5% · 30yr · 1.5% tax · 5.0% vac · 8.0% maint · 8.0% mgmt
Financing live
Cash to close
- Down payment
- $38,750
- Closing costs
- $4,650
- Reserves months
- —
- Total cash needed
- —
Loan-product check · same deal, 3 products live
Conventional
25% down · 7.5% · 30yr
- Down + closing
- —
- Monthly P&I
- —
- Monthly cashflow
- —
- DSCR
- —
- Eligible?
- —
Personal DTI + credit; lowest rate.
DSCR
20% down · 8.5% · 30yr
- Down + closing
- —
- Monthly P&I
- —
- Monthly cashflow
- —
- DSCR
- —
- Eligible?
- —
No personal income docs; deal must DSCR.
Hard money
10% down · 12.0% · 12mo
- Down + closing
- —
- Monthly P&I
- —
- Monthly cashflow
- —
- DSCR
- —
- Eligible?
- —
Short-term bridge; refi at stabilization.
Rent comps 26 comps
| Address | Beds | Baths | Sqft | Rent | $/sqft | DOM | Units | Dist |
|---|---|---|---|---|---|---|---|---|
| 5855 Woodvale Dr Mobile, AL | 3.0 | 1.5 | 1712 | $1,350 | $0.79 | 21d | 1 | 0.14mi |
| 912 Wendover Rd Unit 1043703P Mobile, AL | 4.0 | 2.5 | 1496 | $3,190 | $2.13 | 21d | 1 | 0.22mi |
| 5904 Saint Gallen Ave S Unit 1043743P Mobile, AL | 4.0 | 2.0 | 1496 | $3,719 | $2.49 | 21d | 1 | 0.34mi |
| 5477 Ardell Dr Unit 1043691P Mobile, AL | 3.0 | 2.0 | 1496 | $2,680 | $1.79 | 13d | 1 | 0.57mi |
| 316 Syracuse St Mobile, AL | 3.0 | 2.0 | 1776 | $1,875 | $1.06 | 13d | 1 | 0.81mi |
| 304 N University Blvd Unit 1043721P Mobile, AL | 4.0 | 2.5 | 1496 | $4,148 | $2.77 | 21d | 1 | 0.82mi |
| 5751 Overlook Rd Unit A2 Mobile, AL | 2.0 | 1.0 | 890 | $850 | $0.96 | 21d | 1 | 0.96mi |
| 1305 Middle Ring Rd Mobile, AL | 3.0 | 1.0 | 1100 | $1,400 | $1.27 | 43d | 1 | 0.96mi |
| 914 David Langan Dr E Mobile, AL | 3.0 | 1.0 | 1080 | $1,450 | $1.34 | 43d | 1 | 0.98mi |
| 5613 Overlook Rd Mobile, AL | 3.0 | 1.5 | 1520 | $1,450 | $0.95 | 43d | 1 | 1.01mi |
| 1165 Barker Dr W Mobile, AL | 3.0 | 1.0 | 900 | $950 | $1.06 | 21d | 1 | 1.02mi |
| 5508 Overlook Rd Mobile, AL | 3.0 | 2.0 | 1260 | $1,400 | $1.11 | 13d | 1 | 1.10mi |
| 5520 Vienna Ave Mobile, AL | 3.0 | 2.0 | 1745 | $1,395 | $0.80 | 43d | 1 | 1.11mi |
| 1253 Athey Rd Mobile, AL | 3.0 | 2.0 | 1100 | $1,500 | $1.36 | 13d | 1 | 1.14mi |
| 1104 Garland St Mobile, AL | 3.0 | 1.0 | 1377 | $1,450 | $1.05 | 21d | 1 | 1.21mi |
| 1257 Devander Dr Mobile, AL | 3.0 | 1.0 | 1144 | $1,200 | $1.05 | 43d | 1 | 1.22mi |
| 5213 Pineview Ln S Mobile, AL | 3.0 | 1.0 | 1176 | $1,575 | $1.34 | 43d | 1 | 1.24mi |
| 6725 Zeigler Blvd Mobile, AL | 1.0–2.0 | 1.0 | 850 | $1,282 | $1.51 | 13d | 7 | 1.25mi |
| 133 East Dr Mobile, AL | 1.0–2.0 | 1.0 | 821 | $1,024 | $1.25 | 13d | 4 | 1.26mi |
| 5207 Azalea Cir S Mobile, AL | 3.0 | 2.0 | 1100 | $1,490 | $1.35 | 21d | 1 | 1.28mi |
| 5263 Border Dr S Mobile, AL | 3.0 | 1.0 | 946 | $1,400 | $1.48 | 13d | 1 | 1.34mi |
| 112 S University Blvd Mobile, AL | 4.0 | 4.5 | 1472 | $1,810 | $1.23 | 13d | 5 | 1.44mi |
| 1728 Tew Dr Mobile, AL | 2.0 | 1.0 | 912 | $995 | $1.09 | 43d | 1 | 1.45mi |
| 6016 Magnolia Pl E Mobile, AL | 3.0 | 2.0 | 1600 | $1,800 | $1.12 | 43d | 1 | 1.46mi |
| 6807 Victor Rd Mobile, AL | 3.0 | 1.0 | 1100 | $1,350 | $1.23 | 43d | 1 | 1.47mi |
| 1631 Colonial Oaks Dr Mobile, AL | 3.0 | 1.0 | 1196 | $1,100 | $0.92 | 43d | 1 | 1.47mi |
Listing history 12 events
-
2026-06-10status $155,000 Pending 32 DOM
-
2026-06-09days on market $155,000 Active 32 DOM
-
2026-06-08days on market $155,000 Active 31 DOM
-
2026-06-07days on market $155,000 Active 30 DOM
-
2026-06-05days on market $155,000 Active 27 DOM
-
2026-06-03days on market $155,000 Active 26 DOM
-
2026-06-03status $155,000 Active 25 DOM
-
2026-06-02days on market $155,000 Active Under Contract 25 DOM
-
2026-06-01days on market $155,000 Active Under Contract 24 DOM
-
2026-05-31days on market $155,000 Active Under Contract 23 DOM
-
2026-05-30days on market $155,000 Active Under Contract 22 DOM
-
2026-05-08$155,000 Active 892-char remark
ⓘ Source: listings_history table (triggers on properties + properties_extension) + one-shot
backfill from property_details.listing_events for pre-trigger history.
Tax reassessment forecast AL · Resets to sale price
- Current annual tax
- $481 · $40/mo
- Projected year-2 tax
- $636 · $53/mo
- Expected delta
- +$154/yr (+$13/mo · 32.1%)
ⓘ Screening estimate from a state-policy table — verify with the county assessor before closing.
Climate risk First Street
- Flood 1/10 Low FEMA zone X (unshaded) · 0% chance over 30 yrs
- Wildfire 3/10 Moderate
- Heat 9/10 Extreme 7 d/yr ≥104°F today · 21 d/yr by 30 yrs out
- Wind 9/10 Extreme 99% chance of damaging wind over 30 yrs
- Air quality 1/10 Low 0 unhealthy d/yr today · 0 by 30 yrs out
Nearby sold comps map
Loading sold comps map…
Walkable amenities ~0.75 mi
Loading nearby amenities…
Taxation est. · year 1
- Rental income
- $20,720
- − Mortgage interest
- −$8,682
- − Property taxes
- −$481
- − Insurance
- −$775
- − Repairs & maintenance
- −$1,658
- − Management
- −$1,658
- − Depreciation
- −$4,509
- Taxable income
- $2,957
- Est. tax owed @ 24.0%
- −$710
- After-tax cash flow
- $4,649/yr
For passive investors: Depreciation is non-cash, so a rental often shows a tax loss while cash-flowing — sheltering income. Rental losses are passive: they offset passive income freely, and up to $25,000/yr can offset ordinary (W-2) income if you actively participate and your MAGI is under $100k (phasing out to $0 by $150k); unused losses carry forward. On sale, claimed depreciation is recaptured at up to 25%, and gains may owe capital-gains tax (a 1031 exchange can defer both). Figures are a year-1 estimate at your 24.0% rate — not tax advice; consult a CPA.
Schools (NCES district)
- District
- Mobile County
- NCES district ID
- 0102370
- Math proficiency
- 15% ▼ -28.00%
- Reading proficiency
- 39% ▬ 0.00%
- Median HH income
- $42,455
- Composite
- 22.9/100
- National rank
- #8002
- State rank
- #81 of 129 in AL
Livability — Mobile
- Score
- 75/100
- State rank
- #20
- US rank
- #4262
Category grades
Schools grade is shown separately in the Schools card above.
Census & demographics
- Census place
- Mobile, AL
- County
- Mobile County · 246,577 people
- City population
- 205,729
- Metro
- Mobile, AL
- Population (ZIP)
- 38,890
- Household income
- $61,146
- Rent vs Own
- Severe rent burden
- 1823.0
Population outlook (Mobile County) Hauer SSP2
- Today (2025)
- 415,303 people
- By 2030
- 411,755 · -0.9%
- By 2040
- 399,670 · -3.8%
- By 2050
- 382,616 · -7.9%
- By 2075
- 337,353 · -18.8%
- By 2100
- 283,391 · -31.8%
Race, ethnicity, and origin ACS 2023
- Neighborhood character
- Diverse neighborhood (Simpson 0.56)
- Race & ethnicity
- White 56% Black 35% Two or more races 4% Hispanic / Latino 4% Asian 2%
- Common ancestry
- Lithuanian 3% Italian 2% Slovak 2%
- Foreign-born
- 4% · Canada
- Languages at home
- 95% English-only · Spanish 2% Arabic 1% Other Indo-European 1%
Political lean MEDSL · Mobile
- 2024 margin
- R (+16.4) · D 41.3% · R 57.7%
- 2008→2024 swing
- -7.7pp toward R · 2008: -8.7pp · 2024: -16.4pp
- All cycles
- 2024: R+16.4 2020: R+11.9 2016: R+13.9 2012: R+9.3 2008: R+8.7
Not yet ingested
- Civics
- —
Market trends
- HPI YoY
- ▼ -224.52%
- Current HPI
- 198.9469
- Rent YoY
- ▲ 6.15%
- Metro
- Mobile, AL
- State GDP YoY
- ▲ 2.94%
- F500 in state
- 4
Industry mix (Fortune 500 HQ in AL)
| Industry | F500 HQs | Revenue |
|---|---|---|
| Financial Services | 1 | $8B |
|
||
| Healthcare | 1 | $5B |
|
||
Price history
4 events — show timeline
- 2026-06-09 Pending — GCMLS AL
- 2026-06-02 Relisted — GCMLS AL
- 2026-05-25 Contingent — GCMLS AL
- 2026-05-08 Listed $155,000 GCMLS AL
Property tax history
-0.9%/yrLatest (2019): $481 · -1.2% YoY. Source: county tax records.
Cash-flow waterfall
monthlySold comps — $/sqft
last 12 mo · ≤1 miLoading sold comps…