 Duplex
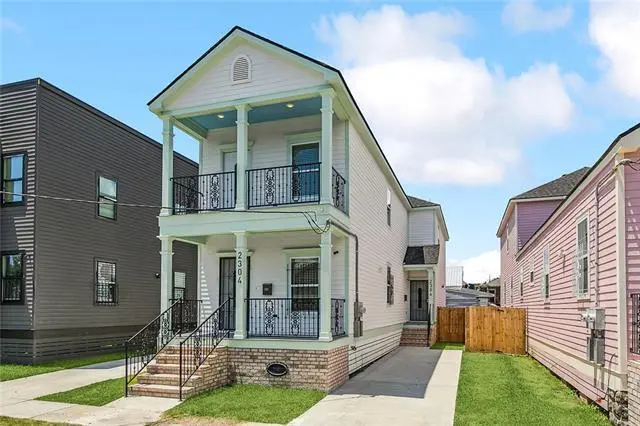
2304-06 New Orleans St · New Orleans, LA
Flood risk No data
- FEMA flood zone
- —
- Chance of flooding over 30 yrs
- —
- Est. flood insurance / yr
- —
Fire risk No data
- Est. fire insurance / yr
- —
Heat risk No data
- Hot days now (above threshold)
- —
- Hot days in 30 yrs
- —
Wind risk No data
- Chance of severe wind over 30 yrs
- —
Air-quality risk No data
- Unhealthy air days now
- —
- Unhealthy air days in 30 yrs
- —
Risk factors via First Street. Map © Google.
Why this score? — see what drove the C grade
The composite is a weighted blend of 9 inputs, each scored 0–100. Each bar is that input's sub-score; the figure is the points it added to the 100-point composite (weight × sub-score).
- Cash flow +26.5/30.0
- DSCR +9.0/10.0
- 1% rule +6.7/10.0
- Condition / age +4.8/5.0
- Livability +4.0/5.0
- ARV discount +3.2/15.0
- Rent growth +2.5/5.0
- Schools +1.6/10.0
- Appreciation +0.0/10.0
$449,000
🖨 Deal sheet (PDF) 📄 Offer letter ✓ Due diligence
Multi-family units
County records classify this as Multi-Family (2-4 Unit). Listing-text estimate: 2 units. confirmed
Listing remarks MLS
New Construction (kitchen appliances included.) Income-producing Duplex features impeccable finishes, light-filled open floor plans, covered front porches/balconies. Kitchens spotlight quartz counters, SS appliances. Both units features Primary Suites w/deep soaking tubs, walk-in showers, spacious closets. Wood floors, spray foam insulation, video cameras, wired for surround sound. Central location + vibrant community w/ access to local amenities. Welcome Home!
Key facts
- Quartz counters
- Deep soaking tubs
- Primary suites
Tags
Neighborhood map
What this means for you Summary
Snapshot
- This is a 2 × 6-bed/6.0-bath units multifamily listed at $449k. Condition is rated excellent.
Deal economics
- At list price, monthly cash flow is $1k ($14k/yr) — positive. Per door: $592/mo.
- The deal already cash-flows at list — no discount required.
- Meets the 1% rule at list price ($5k rent vs $449k).
- Recommended offer: $395k (12.0% below list) — sets the bar for market timing.
- Cap rate 9.5% vs local median 4.3% in New Orleans — top-decile yield for the area; either an underpriced asset or a hidden risk that comps aren't pricing in. Stress-test before assuming the spread holds.
Location & tenants
- Location reads 81/100 on livability (#3 in LA, #1,383 nationally) — a professional / high-income tenant draw. Strengths: amenities A+, commute A+, health & safety A+; Watch: crime C-, employment D.
- Orleans Parish (urban): math 11% / reading 27% proficiency, ranked #69 of 98 in LA (top 70%) — low school quality limits family demand, transient renter base, plan for 1-2y turnover; 68% free/reduced lunch — lower-income household profile, screen leases tightly.
- Zoned schools: Benjamin Franklin Elem. Math And Science (math 12% / reading 23%, grade F, #479 of 646 statewide, top 75%, 747 students, 98% FRL, charter) — zoned schools average 98% FRL vs 68% district-wide (30 pts higher); higher-poverty schools than district average — tighter screening recommended.
- Market conditions: Rents soft (-0.2%/yr); 384 active listings in the ZIP; 710 units permitted in Orleans Parish in 2024 (244 in 5+ unit buildings).
- At $5,262/mo this rent would consume 119% of the median local household income ($53k/yr) (locally 3381% of renters already pay >50% of income on rent) — very limited rent-growth headroom before tenants either downsize or default.
Forward outlook
- Local home prices are declining (-3.0%/yr); year-one equity from $3k of loan paydown is wiped out by about $13k of value loss. Plan a longer hold.
- Orleans County population projected at +61% by 2050 — long-run rental-demand tailwind backs the buy-and-hold thesis.
Negotiation context
- It's been on market 138 days — a 12% lower offer ($395k) is reasonable based on typical stale-listing flexibility.
- 5 sale attempts since 3y ago with the ask held roughly flat each time — persistent listings suggest the price (not the market) is what's stuck; bring a comps-based counter.
Questions for the listing agent
- It's been on market 138 days. Have you received any prior offers? Is the seller open to a 12% concession, seller financing, or rate buy-down credit?
- Can we see the unit-by-unit rent roll, current vacancy, and any below-market leases? What's the average tenancy length?
- What capital expenditures (roof, boiler, parking lot, exteriors) have been made in the last 5 years, and what's planned in the next 2?
- Why hasn't it sold? Are there any deal-killer items the seller is aware of (foundation, flood, title, zoning, code violations)?
- Is there a deadline driving the sale (1031 exchange, divorce, estate, relocation)? That informs how much negotiation room exists.
- What's the average days-on-market for RENTAL listings here right now (not sales)? A rising rental-DOM trend means longer vacancies and softer asking-rent achievability than the comps imply.
- What's the recent tenant-quality profile in this submarket — average credit score on applications, eviction rate, late-payment / NSF rate, and stable-employment percentage? A property-management company in the area should have these aggregated.
- How much new apartment / multifamily construction is in the pipeline within 1–3 miles? Heavy new supply (>2% of stock underway) typically softens rents 12–24 months out; light construction supports rent growth.
Investment metrics
- 1% rule
- 1.17% ✓
- Cap rate
- 9.46%
- Cash-on-cash
- 11.30%
- DSCR
- 1.50
- GRM
- 7.1
CMA / ARV
- ARV (median comp)
- $409,837
- List price
- $449,000
- Delta
- 9.56%
- Verdict
- FAIR
- Comps
- 20 within 1.0 mi
Show comp detail 4 sales within ~0.75 mi
| Address | Dist | Beds/Ba | Sqft | Sold | Price | $/sf | Match |
|---|---|---|---|---|---|---|---|
| 2612-14 Annette St | 0.27mi | 12/— | 4,500 (-13%) | 22mo | $215,000 | $48 | 48 |
| 1827-29 Frenchmen St | 0.54mi | 11/7.0 (-1) | 5,060 (-2%) | 9mo | $360,000 | $71 | 44 |
| 2805-07 New Orleans St | 0.43mi | 12/5.0 | 5,154 (-0%) | 20mo | $400,000 | $78 | 43 |
| 1704-06 N Broad St | 0.44mi | 12/8.0 | 4,853 (-6%) | 14mo | $479,000 | $99 | 42 |
Match score weights: distance 35% · size 25% · config 20% · recency 20%. Top-matched comps best support the ARV.
Projected returns pro-forma
-3.0% appreciation · 0.0% rent growth · sell at horizon
- IRR
- -2.8%
- Equity multiple
- 0.90×
- Total profit
- $-12,752
- Equity at exit
- $66,947
- IRR
- 3.3%
- Equity multiple
- 1.21×
- Total profit
- $26,421
- Equity at exit
- $38,821
Cash invested: $125,720 (down + closing). Projections, not guarantees.
Landlord ↔ Tenant lean methodology
- Overall (STATE)
- 90 Strongly Landlord-Friendly
- State Louisiana
- 90 Strongly Landlord-Friendly · R+12
- County
- — inherits STATE
- City
- — inherits STATE
ZIP-level market 70119
- Home prices YoY
- -34.8%
- Rents YoY
- -0.2%
- Active inventory
- 384
- Price-to-rent
- 14.2×
Monthly cashflow live
- Estimated rent
- $5,262 medium interval (Pro) →
- Mortgage (P&I)
- −$2,355
- Tax from tax record
- −$431 /mo · $5,172/yr
- Insurance
- −$187
- HOA
- −$0
- Lot rent
- −$0
- Vacancy / Maint / Mgmt
- −$1,105
- Net cashflow
- $1,184
Break-even live
Sensitivity live
| Price | -10% $1,438 | -5% $1,311 | +0% $1,184 | +5% $1,057 | +10% $930 |
|---|---|---|---|---|---|
| Rent | -10% $769 | -5% $976 | +0% $1,184 | +5% $1,392 | +10% $1,600 |
| Rate | -1.0pp $1,410 | -0.5pp $1,298 | base $1,184 | +0.5pp $1,068 | +1.0pp $950 |
2-unit breakdown (identical units grouped — click to expand)
| Units | Beds | Baths | Est. rent |
|---|---|---|---|
| 2× units | 6 | 6 | $5,262 |
| #1 | 6 | 6 | $2,631 |
| #2 | 6 | 6 | $2,631 |
| Total (2 units) | $5,262 | ||
UW: 25.0% down · 7.5% · 30yr · 1.5% tax · 5.0% vac · 8.0% maint · 8.0% mgmt
Financing live
Cash to close
- Down payment
- $112,250
- Closing costs
- $13,470
- Reserves months
- —
- Total cash needed
- —
Loan-product check · same deal, 3 products live
Conventional
25% down · 7.5% · 30yr
- Down + closing
- —
- Monthly P&I
- —
- Monthly cashflow
- —
- DSCR
- —
- Eligible?
- —
Personal DTI + credit; lowest rate.
DSCR
20% down · 8.5% · 30yr
- Down + closing
- —
- Monthly P&I
- —
- Monthly cashflow
- —
- DSCR
- —
- Eligible?
- —
No personal income docs; deal must DSCR.
Hard money
10% down · 12.0% · 12mo
- Down + closing
- —
- Monthly P&I
- —
- Monthly cashflow
- —
- DSCR
- —
- Eligible?
- —
Short-term bridge; refi at stabilization.
Listing history 22 events
-
2026-06-22days on market $449,000 Active 138 DOM
-
2026-06-21days on market $449,000 Active 137 DOM
-
2026-06-18days on market $449,000 Active 134 DOM
-
2026-06-17days on market $449,000 Active 133 DOM
-
2026-06-16days on market $449,000 Active 132 DOM
-
2026-06-15days on market $449,000 Active 131 DOM
-
2026-06-13days on market $449,000 Active 129 DOM
-
2026-06-10days on market $449,000 Active 126 DOM
-
2026-06-09days on market $449,000 Active 125 DOM
-
2026-06-08days on market $449,000 Active 124 DOM
-
2026-06-07days on market $449,000 Active 123 DOM
-
2026-06-05days on market $449,000 Active 120 DOM
-
2026-06-03days on market $449,000 Active 119 DOM
-
2026-06-02days on market $449,000 Active 118 DOM
-
2026-06-01days on market $449,000 Active 117 DOM
-
2026-05-31days on market $449,000 Active 116 DOM
-
2026-02-04$449,000 Active 465-char remark
Show marketing remark (465 chars)
New Construction (kitchen appliances included.) Income-producing Duplex features impeccable finishes, light-filled open floor plans, covered front porches/balconies. Kitchens spotlight quartz counters, SS appliances. Both units features Primary Suites w/deep soaking tubs, walk-in showers, spacious closets. Wood floors, spray foam insulation, video cameras, wired for surround sound. Central location + vibrant community w/ access to local amenities. Welcome Home!
-
2025-04-15$449,000 Active
-
2024-02-20$449,000
-
2024-01-25historical $1,800
-
2023-10-08$1,800
-
2023-08-08$399,000
ⓘ Source: listings_history table (triggers on properties + properties_extension) + one-shot
backfill from property_details.listing_events for pre-trigger history.
Tax reassessment forecast LA · Resets to sale price
- Current annual tax
- $5,172 · $431/mo
- Projected year-2 tax
- $5,172 · $431/mo
- Expected delta
- $0/yr ($0/mo · 0.0%)
ⓘ Screening estimate from a state-policy table — verify with the county assessor before closing.
Nearby sold comps map
Loading sold comps map…
Walkable amenities ~0.75 mi
Loading nearby amenities…
Taxation est. · year 1
- Rental income
- $63,144
- − Mortgage interest
- −$25,151
- − Property taxes
- −$5,172
- − Insurance
- −$2,245
- − Repairs & maintenance
- −$5,052
- − Management
- −$5,052
- − Depreciation
- −$13,062
- Taxable income
- $7,411
- Est. tax owed @ 24.0%
- −$1,779
- After-tax cash flow
- $12,433/yr
For passive investors: Depreciation is non-cash, so a rental often shows a tax loss while cash-flowing — sheltering income. Rental losses are passive: they offset passive income freely, and up to $25,000/yr can offset ordinary (W-2) income if you actively participate and your MAGI is under $100k (phasing out to $0 by $150k); unused losses carry forward. On sale, claimed depreciation is recaptured at up to 25%, and gains may owe capital-gains tax (a 1031 exchange can defer both). Figures are a year-1 estimate at your 24.0% rate — not tax advice; consult a CPA.
Condition & rehab AI · 12 photos
This multi-family home is in excellent condition with new construction, featuring modern finishes and a central location. It is move-in ready and ideal for investors seeking a high-value property.
Value-add opportunities
- Both Paint exterior siding — Enhances curb appeal and value
- Both Replace blinds with energy-efficient ones — Improves energy efficiency and aesthetics
- Both Install smart home security system — Enhances safety and adds modern amenities
Renovation cost estimate screening
Value-add ROI direction
- Both Paint exterior siding — Enhances curb appeal and value ↑
- Both Replace blinds with energy-efficient ones — Improves energy efficiency and aesthetics ↑
- Both Install smart home security system — Enhances safety and adds modern amenities ↑
ⓘ Cost ranges are severity-bucket heuristics (US national rule-of-thumb). Get contractor quotes + a written scope before underwriting a rehab budget.
Schools (NCES district)
- District
- Orleans Parish
- NCES district ID
- 2201170
- Math proficiency
- 11% ▼ -52.00%
- Reading proficiency
- 27% ▼ -46.00%
- Median HH income
- $37,011
- Composite
- 15.78/100
- National rank
- #9271
- State rank
- #69 of 98 in LA
Livability — New Orleans
- Score
- 81/100
- State rank
- #3
- US rank
- #1383
Category grades
Schools grade is shown separately in the Schools card above.
Census & demographics
- Census place
- New Orleans, LA
- County
- Orleans Parish · 338,817 people
- City population
- 338,817
- Metro
- New Orleans-Metairie, LA
- Population (ZIP)
- 37,253
- Household income
- $53,143
- Rent vs Own
- Severe rent burden
- 3381.0
Population outlook (Orleans County) Hauer SSP2
- Today (2025)
- 513,025 people
- By 2030
- 575,781 · +12.2%
- By 2040
- 700,174 · +36.5%
- By 2050
- 826,541 · +61.1%
- By 2075
- 1,123,374 · +119.0%
- By 2100
- 1,355,609 · +164.2%
Race, ethnicity, and origin ACS 2023
- Neighborhood character
- Diverse neighborhood (Simpson 0.64)
- Race & ethnicity
- Black 44% White 40% Two or more races 10% Hispanic / Latino 9% Asian 1%
- Hispanic origin (detail)
- Mexican 2%
- Common ancestry
- Lithuanian 8% Slovak 2% Romanian 1%
- Foreign-born
- 6% · Canada, Jamaica
- Languages at home
- 91% English-only · Spanish 6% French/Haitian/Cajun 1% Other Indo-European 0%
Political lean MEDSL · Orleans
- 2024 margin
- Solid D (+67.0) · D 82.2% · R 15.2% · Other 2.7%
- 2008→2024 swing
- +6.7pp toward D · 2008: 60.3pp · 2024: 67.0pp
- All cycles
- 2024: D+67.0 2020: D+68.2 2016: D+66.2 2012: D+62.5 2008: D+60.3
Not yet ingested
- Civics
- —
Market trends
- HPI YoY
- ▼ -135.38%
- Current HPI
- 253.1929
- Rent YoY
- ▼ -0.20%
- Metro
- New Orleans-Metairie, LA
- State GDP YoY
- ▲ 3.29%
- F500 in state
- 10
Industry mix (Fortune 500 HQ in LA)
| Industry | F500 HQs | Revenue |
|---|---|---|
| Telecommunications | 2 | $23B |
|
||
| Utilities | 1 | $12B |
|
||
| Wholesale / Distribution | 1 | $5B |
|
||
| Advertising | 1 | $2B |
|
||
Price history
+12.5% since first listed6 events — show timeline
- 2026-02-04 Listed $449,000 AcadianaMLS
- 2025-04-15 Listed $449,000 AcadianaMLS
- 2024-02-20 Listed $449,000 AcadianaMLS
- 2024-01-25 Rental Removed $1,800 GSREIN
- 2023-10-08 Listed for Rent $1,800 GSREIN
- 2023-08-08 Listed $399,000 AcadianaMLS
Property tax history
+242.1%/yrLatest (2026): $5,172 · +1.1% YoY. Source: county tax records.
Cash-flow waterfall
monthlySold comps — $/sqft
last 12 mo · ≤1 miLoading sold comps…