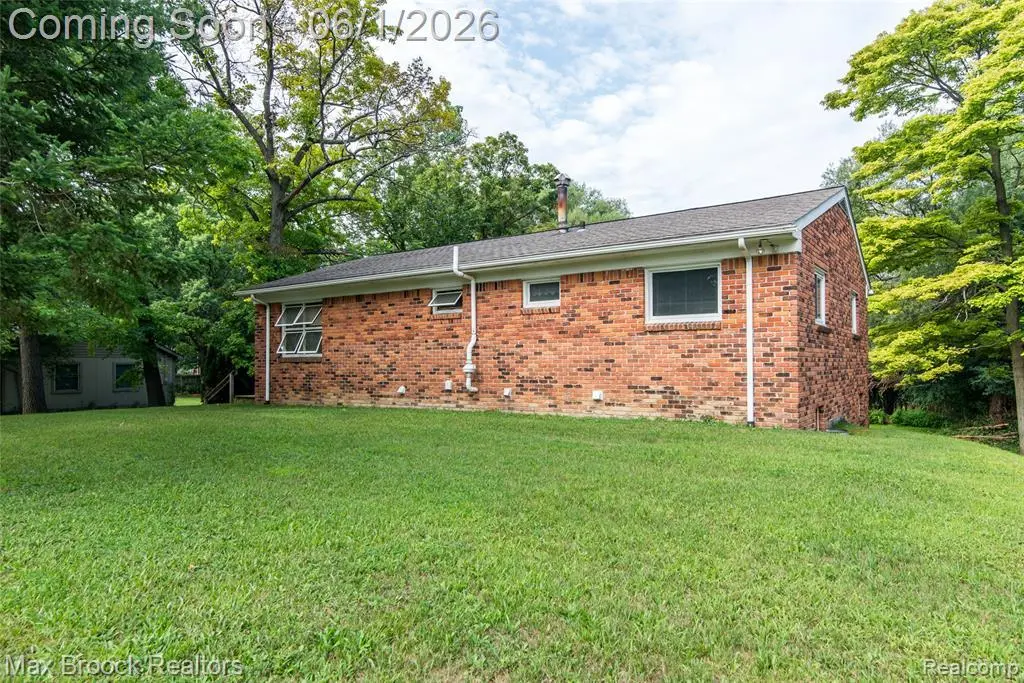
465 Robert Ct · Auburn Hills, MI
Flood risk 4/10 · Minor
- FEMA flood zone
- X (unshaded)
- Chance of flooding over 30 yrs
- 0.2%
- Est. flood insurance / yr
- $473 – $860
Fire risk 1/10 · Minimal
- Est. fire insurance / yr
- $784 – $1,456
Heat risk 2/10 · Minimal
- Hot days now (above 97°F)
- 7 days/yr
- Hot days in 30 yrs
- 15 days/yr
Wind risk 2/10 · Minimal
- Chance of severe wind over 30 yrs
- —
Air-quality risk 3/10 · Minor
- Unhealthy air days now
- 2 days/yr
- Unhealthy air days in 30 yrs
- 5 days/yr
Risk factors via First Street. Map © Google.
Why this score? — see what drove the C+ grade
The composite is a weighted blend of 9 inputs, each scored 0–100. Each bar is that input's sub-score; the figure is the points it added to the 100-point composite (weight × sub-score).
- Cash flow +22.8/30.0
- ARV discount +14.7/15.0
- DSCR +7.3/10.0
- 1% rule +5.1/10.0
- Livability +3.8/5.0
- Schools +3.7/10.0
- Condition / age +2.5/5.0
- Rent growth +1.9/5.0
- Appreciation +0.0/10.0
$320,000
🖨 Deal sheet 📄 Offer letter ✓ Due diligence
Listing remarks
Located on a spacious 0.46-acre lot in the Churchill neighborhood of Auburn Hills, 456 Robert Ct offers a solid value-add opportunity in a strong suburban rental market. This brick 4-unit ranch, built in 1966, features 2,536 square feet with a practical two-upper, two-lower layout. One unit includes a private entrance and balcony, adding extra tenant appeal and future rent potential. Each unit offers a full bath, living/dining space, and a kitchen with appliances. The property also includes a circular driveway with ample off-street parking and a 1.5-car garage that can be used for storage or future tenant use. The property has been maintained but will benefit from updates and modernization.
Key facts
- 0.46 acre lot
- Garage
- Built 1966
Neighborhood map
What this means for you Summary
Snapshot
- This is a 4-bed/4.0-bath single-family listed at $320k.
Deal economics
- At list price, monthly cash flow is $559 ($7k/yr) — positive.
- The deal already cash-flows at list — no discount required.
- Meets the 1% rule at list price ($3k rent vs $320k).
- Recommended offer: $315k (1.5% below list) — sets the bar for market timing.
- Cap rate 8.4% vs local median 4.3% in Auburn Hills — top-decile yield for the area; either an underpriced asset or a hidden risk that comps aren't pricing in. Stress-test before assuming the spread holds.
Location & tenants
- Location reads 76/100 on livability (#151 in MI, #3,766 nationally) — a middle-class / working-renter tenant base. Strengths: commute A+, cost of living A+, housing A+; Watch: crime D+, schools D, amenities F.
- Avondale School District (suburban): math 34% / reading 48% proficiency, ranked #162 of 540 in MI (top 30%) — families likely to look elsewhere, expect single-tenant / working-renter base with shorter leases.
- Market conditions: Rents soft (-2.3%/yr); 107 active listings in the ZIP; 4 comparable units currently listed for rent nearby; rentals leasing fast (median 2d on market — plan ~1-2 weeks tenant-placement turnaround); solid renter incomes; 2,614 units permitted in Oakland County in 2024 (721 in 5+ unit buildings).
- At $3,224/mo this rent would consume 45% of the median local household income ($85k/yr) (locally 986% of renters already pay >50% of income on rent) — very limited rent-growth headroom before tenants either downsize or default.
Forward outlook
- Local home prices are declining (-3.0%/yr); year-one equity from $2k of loan paydown is wiped out by about $10k of value loss. Plan a longer hold.
- Oakland County population projected at +10% by 2050 — modest demand growth; plan on rents tracking national, not racing it.
Negotiation context
- It's been on market 18 days — a 2% lower offer ($315k) is reasonable based on typical stale-listing flexibility.
- 12 sale attempts since 6y ago with the ask held roughly flat each time — persistent listings suggest the price (not the market) is what's stuck; bring a comps-based counter.
Questions for the listing agent
- Built in 1966 — when were the roof, HVAC, electrical panel, plumbing, and water heater last replaced?
- Is there a deadline driving the sale (1031 exchange, divorce, estate, relocation)? That informs how much negotiation room exists.
- Schools are D-rated, which usually means shorter tenancies and higher turnover. Who's the typical renter profile here, and what's been the actual vacancy rate?
- Crime grade is D in this area — have there been break-ins, vandalism, or insurance claims at this property in the last 3 years? What carrier currently insures it and at what premium?
- What's the average days-on-market for RENTAL listings here right now (not sales)? A rising rental-DOM trend means longer vacancies and softer asking-rent achievability than the comps imply.
- What's the recent tenant-quality profile in this submarket — average credit score on applications, eviction rate, late-payment / NSF rate, and stable-employment percentage? A property-management company in the area should have these aggregated.
- How much new for-sale + rental construction is in the pipeline within 1–3 miles? Heavy new supply typically softens prices + rents 12–24 months out; constrained supply supports both.
Investment metrics
- 1% rule
- 1.01% ✓
- Cap rate
- 8.39%
- Cash-on-cash
- 7.49%
- DSCR
- 1.33
- GRM
- 8.3
CMA / ARV
- ARV (median comp)
- $380,530
- List price
- $320,000
- Delta
- -15.91%
- Verdict
- UNDERPRICED
- Comps
- 4 within 1.0 mi
Show comp detail 1 sale within ~0.75 mi
| Address | Dist | Beds/Ba | Sqft | Sold | Price | $/sf | Match |
|---|---|---|---|---|---|---|---|
| 3843 Andover Ave | 0.72mi | 3/2.5 (-1) | 2,532 (+3%) | 5mo | $520,000 | $205 | 46 |
Match score weights: distance 35% · size 25% · config 20% · recency 20%. Top-matched comps best support the ARV.
Projected returns pro-forma
-3.0% appreciation · 0.0% rent growth · sell at horizon
- IRR
- -8.0%
- Equity multiple
- 0.71×
- Total profit
- $-25,770
- Equity at exit
- $47,713
- IRR
- -2.5%
- Equity multiple
- 0.85×
- Total profit
- $-13,447
- Equity at exit
- $27,668
Cash invested: $89,600 (down + closing). Projections, not guarantees.
Landlord ↔ Tenant lean methodology
- Overall (STATE)
- 62 Landlord-Friendly
- State Michigan
- 62 Landlord-Friendly · EVEN
- County
- — inherits STATE
- City
- — inherits STATE
ZIP-level market 48326
- Rents YoY
- -2.3%
- Active inventory
- 107
- Price-to-rent
- 8.3×
Monthly cashflow live
- Estimated rent
- $3,224 medium interval (Pro) →
- Mortgage (P&I)
- −$1,678
- Tax from tax record
- −$176 /mo · $2,113/yr
- Insurance
- −$133
- HOA
- −$0
- Vacancy / Maint / Mgmt
- −$677
- Net cashflow
- $559
Break-even live
UW: 25.0% down · 7.5% · 30yr · 1.5% tax · 5.0% vac · 8.0% maint · 8.0% mgmt
Financing live
Cash to close
- Down payment
- $80,000
- Closing costs
- $9,600
- Reserves months
- —
- Total cash needed
- —
Loan-product check · same deal, 3 products live
Conventional
25% down · 7.5% · 30yr
- Down + closing
- —
- Monthly P&I
- —
- Monthly cashflow
- —
- DSCR
- —
- Eligible?
- —
Personal DTI + credit; lowest rate.
DSCR
20% down · 8.5% · 30yr
- Down + closing
- —
- Monthly P&I
- —
- Monthly cashflow
- —
- DSCR
- —
- Eligible?
- —
No personal income docs; deal must DSCR.
Hard money
10% down · 12.0% · 12mo
- Down + closing
- —
- Monthly P&I
- —
- Monthly cashflow
- —
- DSCR
- —
- Eligible?
- —
Short-term bridge; refi at stabilization.
Rent comps 4 comps
| Address | Beds | Baths | Sqft | Rent | $/sqft | DOM | Units | Dist |
|---|---|---|---|---|---|---|---|---|
| 124 Optimist Auburn Hills, MI | 2.0–3.0 | 2.0–2.5 | 1914 | $3,535 | $1.85 | 1d | 9 | 0.91mi |
| 124 Optimist Unit 1201 Rochester Hills, MI | 3.0 | 2.5 | 2504 | $3,535 | $1.41 | 1d | 1 | 0.91mi |
| 915 Huntclub Blvd Auburn Hills, MI | 4.0 | 2.5 | 2403 | $3,200 | $1.33 | 15d | 1 | 1.20mi |
| 3200 South Blvd Bloomfield Hills, MI | 2.0–3.0 | 2.0 | 1782 | $4,250 | $2.38 | 1d | 1 | 1.41mi |
Listing history 39 events
-
2026-06-18days on market $320,000 Active 18 DOM
-
2026-06-17days on market $320,000 Active 17 DOM
-
2026-06-16days on market $320,000 Active 16 DOM
-
2026-06-15days on market $320,000 Active 15 DOM
-
2026-06-13days on market $320,000 Active 13 DOM
-
2026-06-13days on market $320,000 Active 12 DOM
-
2026-06-09days on market $320,000 Active 9 DOM
-
2026-06-08days on market $320,000 Active 8 DOM
-
2026-06-07days on market $320,000 Active 7 DOM
-
2026-06-04days on market $320,000 Active 4 DOM
-
2026-06-03days on market $320,000 Active 3 DOM
-
2026-06-02days on market $320,000 Active 2 DOM
-
2026-06-01status $320,000 Active 1 DOM
-
2026-05-31statusdays on market $320,000 Coming Soon 1 DOM
-
2026-05-09historical
-
2026-05-07status Active
-
2026-05-07status Active
-
2026-01-29status Pending
-
2026-01-29status Pending
-
2026-01-29historical
-
2026-01-22$320,000 Active
-
2026-01-22$320,000 Active
-
2025-11-15historical
-
2025-11-15historical
-
2025-08-16$360,000 Active
-
2025-08-16$360,000 Active
-
2025-08-13historical
-
2021-07-02historical
-
2021-07-01historical
-
2021-05-03status Active
-
2021-05-03status Active
-
2021-03-24status Pending
-
2021-03-24status Pending
-
2021-02-17status Active
-
2021-02-17status Active
-
2021-02-08historical Accepting Backup Offers
-
2021-02-08historical Accepting Backup Offers
-
2020-10-02$335,000 Active
-
2020-10-02$335,000 Active
ⓘ Source: listings_history table (triggers on properties + properties_extension) + one-shot
backfill from property_details.listing_events for pre-trigger history.
Tax reassessment forecast MI · Partial reset (capped growth)
- Current annual tax
- $2,113 · $176/mo
- Projected year-2 tax
- $3,521 · $293/mo
- Expected delta
- +$1,407/yr (+$117/mo · 66.6%)
ⓘ Screening estimate from a state-policy table — verify with the county assessor before closing.
Climate risk First Street
- Flood 4/10 Moderate FEMA zone X (unshaded) · 20% chance over 30 yrs
- Wildfire 1/10 Low
- Heat 2/10 Low 7 d/yr ≥97°F today · 15 d/yr by 30 yrs out
- Wind 2/10 Low
- Air quality 3/10 Moderate 2 unhealthy d/yr today · 5 by 30 yrs out
Nearby sold comps map
Loading sold comps map…
Walkable amenities ~0.75 mi
Loading nearby amenities…
Taxation est. · year 1
- Rental income
- $38,686
- − Mortgage interest
- −$17,925
- − Property taxes
- −$2,113
- − Insurance
- −$1,600
- − Repairs & maintenance
- −$3,095
- − Management
- −$3,095
- − Depreciation
- −$9,309
- Taxable income
- $1,549
- Est. tax owed @ 24.0%
- −$372
- After-tax cash flow
- $6,340/yr
For passive investors: Depreciation is non-cash, so a rental often shows a tax loss while cash-flowing — sheltering income. Rental losses are passive: they offset passive income freely, and up to $25,000/yr can offset ordinary (W-2) income if you actively participate and your MAGI is under $100k (phasing out to $0 by $150k); unused losses carry forward. On sale, claimed depreciation is recaptured at up to 25%, and gains may owe capital-gains tax (a 1031 exchange can defer both). Figures are a year-1 estimate at your 24.0% rate — not tax advice; consult a CPA.
Schools (NCES district)
- District
- Avondale School District
- NCES district ID
- 2603690
- Math proficiency
- 34% ▼ -8.00%
- Reading proficiency
- 48% ▼ -4.00%
- Median HH income
- $71,549
- Composite
- 37.33/100
- National rank
- #4442
- State rank
- #162 of 540 in MI
Livability — Auburn Hills
- Score
- 76/100
- State rank
- #151
- US rank
- #3766
Category grades
Schools grade is shown separately in the Schools card above.
Census & demographics
- Census place
- Auburn Hills, MI
- County
- Oakland County · 1,009,092 people
- City population
- 24,514
- Metro
- Detroit-Warren-Dearborn, MI
- Population (ZIP)
- 24,514
- Household income
- $85,190
- Rent vs Own
- Severe rent burden
- 986.0
Population outlook (Oakland County) Hauer SSP2
- Today (2025)
- 1,335,747 people
- By 2030
- 1,375,100 · +2.9%
- By 2040
- 1,435,385 · +7.5%
- By 2050
- 1,469,250 · +10.0%
- By 2075
- 1,531,946 · +14.7%
- By 2100
- 1,450,485 · +8.6%
Race, ethnicity, and origin ACS 2023
- Neighborhood character
- Diverse neighborhood (Simpson 0.64)
- Race & ethnicity
- White 56% Asian 15% Black 11% Hispanic / Latino 11% Two or more races 11%
- Hispanic origin (detail)
- Mexican 7% Puerto Rican 2%
- Common ancestry
- Romanian 6% Slovak 2% Lithuanian 2%
- Foreign-born
- 19% · Canada, China, Jamaica
- Languages at home
- 76% English-only · Spanish 8% Other Indo-European 6% Other Asian/Pacific 4%
Political lean MEDSL · Oakland
- 2024 margin
- D (+10.6) · D 54.4% · R 43.8% · Other 1.9%
- 2008→2024 swing
- -3.9pp toward R · 2008: 14.5pp · 2024: 10.6pp
- All cycles
- 2024: D+10.6 2020: D+14.1 2016: D+8.1 2012: D+8.1 2008: D+14.5
Not yet ingested
- Civics
- —
Market trends
- HPI YoY
- ▼ -298.32%
- Current HPI
- 178.7685
- Rent YoY
- ▼ -2.27%
- Metro
- Detroit-Warren-Dearborn, MI
- State GDP YoY
- ▲ 1.37%
- F500 in state
- 28
Industry mix (Fortune 500 HQ in MI)
| Industry | F500 HQs | Revenue |
|---|---|---|
| Automotive Parts | 3 | $48B |
|
||
| Automotive | 2 | $372B |
|
||
| Chemicals | 1 | $45B |
|
||
| Automotive Retail | 1 | $29B |
|
||
| Healthcare / Medical Devices | 1 | $23B |
|
||
| Automotive Technology | 1 | $20B |
|
||
Price history
-4.5% since first listed25 events — show timeline
- 2026-05-09 Listing Removed — MiRealSource-MiMLS
- 2026-05-07 Relisted — MiRealSource-MiMLS
- 2026-05-07 Relisted — REALCOMP
- 2026-01-29 Pending — MiRealSource-MiMLS
- 2026-01-29 Pending — REALCOMP
- 2026-01-29 Listing Removed — REALCOMP
- 2026-01-22 Listed $320,000 REALCOMP
- 2026-01-22 Listed $320,000 MiRealSource-MiMLS
- 2025-11-15 Listing Removed — MiRealSource-MiMLS
- 2025-11-15 Listing Removed — REALCOMP
- 2025-08-16 Listed $360,000 REALCOMP
- 2025-08-16 Listed $360,000 MiRealSource-MiMLS
- 2025-08-13 Coming Soon — MiRealSource-MiMLS
- 2021-07-02 Listing Removed — REALCOMP
- 2021-07-01 Listing Removed — MiRealSource-MiMLS
- 2021-05-03 Relisted — MiRealSource-MiMLS
- 2021-05-03 Relisted — REALCOMP
- 2021-03-24 Pending — MiRealSource-MiMLS
- 2021-03-24 Pending — REALCOMP
- 2021-02-17 Relisted — MiRealSource-MiMLS
- 2021-02-17 Relisted — REALCOMP
- 2021-02-08 Contingent — MiRealSource-MiMLS
- 2021-02-08 Contingent — REALCOMP
- 2020-10-02 Listed $335,000 MiRealSource-MiMLS
- 2020-10-02 Listed $335,000 REALCOMP
Property tax history
-2.3%/yrLatest (2025): $2,113 · -49.1% YoY. Source: county tax records.
Cash-flow waterfall
monthlySold comps — $/sqft
last 12 mo · ≤1 miLoading sold comps…