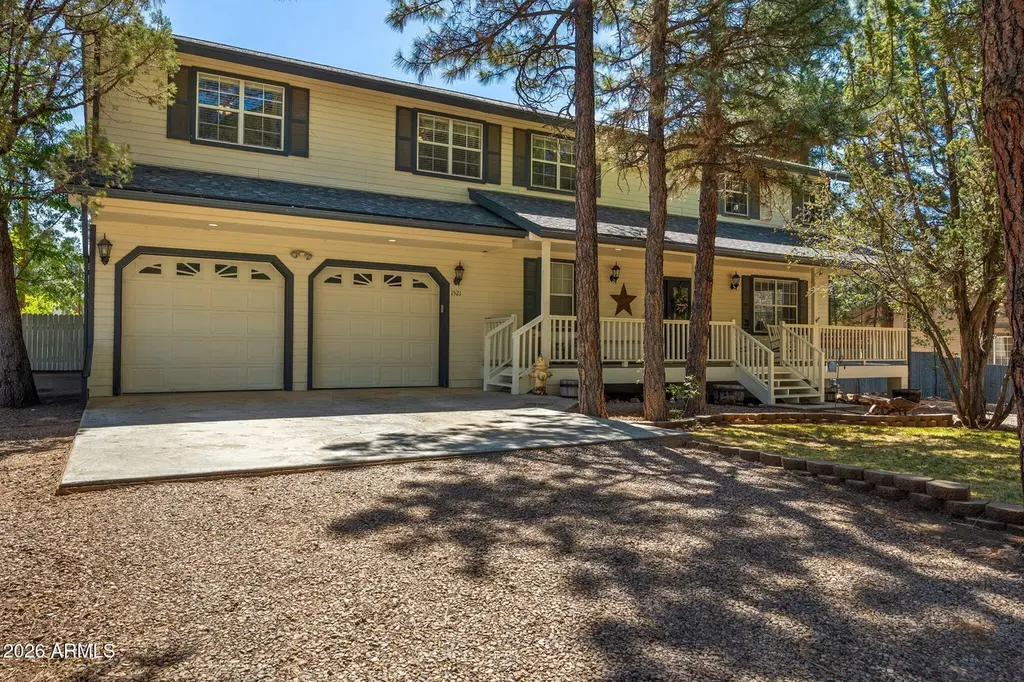
1521 N 40th Dr · Show Low, AZ
Flood risk 1/10 · Minimal
- FEMA flood zone
- X (unshaded)
- Chance of flooding over 30 yrs
- 0.0%
- Est. flood insurance / yr
- $507 – $1,088
Fire risk 6/10 · Moderate
- Est. fire insurance / yr
- $610 – $1,132
Heat risk 2/10 · Minimal
- Hot days now (above 89°F)
- 7 days/yr
- Hot days in 30 yrs
- 18 days/yr
Wind risk 1/10 · Minimal
- Chance of severe wind over 30 yrs
- —
Air-quality risk 2/10 · Minimal
- Unhealthy air days now
- 1 days/yr
- Unhealthy air days in 30 yrs
- 1 days/yr
Risk factors via First Street. Map © Google.
Why this score? — see what drove the B grade
The composite is a weighted blend of 9 inputs, each scored 0–100. Each bar is that input's sub-score; the figure is the points it added to the 100-point composite (weight × sub-score).
- Cash flow +28.3/30.0
- ARV discount +14.5/15.0
- DSCR +10.0/10.0
- 1% rule +6.7/10.0
- Livability +3.2/5.0
- Schools +3.0/10.0
- Rent growth +2.5/5.0
- Condition / age +2.5/5.0
- Appreciation +0.0/10.0
$600,000
🖨 Deal sheet (PDF) 📄 Offer letter ✓ Due diligence
Listing remarks
Nestled in the desirable Country Club Manor community, this spacious 4-bedroom + den, 3-bath home offers approximately 2,780 sq ft of comfortable mountain living with no HOA! This well-maintained home features a versatile floorplan with a large loft, oversized 2-car garage, and newer luxury vinyl plank flooring throughout. The inviting living area is highlighted by a cozy gas fireplace, while the kitchen features a gas stove and plenty of space for entertaining. All of the bathrooms and the kitchen have been beautifully remodeled and have quartz countertops. Step outside to Trex-deck front to sit on the porch swing, or the back porch overlooking the fenced backyard complete with a basketbal
Key facts
- Quartz countertops
- Large loft
- Trex-deck front
Tags
Property features AI
Finance
- Other: Lot size approximately 12,512 sq. ft. (assessor)
- Financial info: Non-assumable financing
- HOA & community: Association fee covers other items (see remarks)
Exterior
- Parking: 2 open parking spaces; 2 covered parking spaces; 2-car garage; RV access/parking with RV gate; Garage door opener; Extended length garage
- Utilities: City water; Public sewer
- Home design: Single family residence; Fee simple ownership; Asphalt road access
- Construction: Wood frame construction; Painted exterior; Composition roof; Building area per assessor
- Exterior features: Private yard; Sport court(s); Storage; Shed(s); Chain link and wood fencing; Grass front yard; Grass backyard; East/West exposure
Interior
- Kitchen: Built-in microwave; Refrigerator; Dishwasher; Garbage disposal; Pantry; Eat-in kitchen
- Bedrooms: Up to 6 possible bedrooms
- Flooring: Carpet; Laminate
- Bathrooms: 3 full bathrooms
- Heating & cooling: Electric heating; Central air conditioning; Ceiling fans
- Interior features: Double vanity; Upstairs living area; Eat-in kitchen; 9+ foot flat ceilings; Pantry; Master bedroom with a 3/4 bath; Dual-pane windows; Family room gas fireplace
- Laundry & utility: Indoor laundry
Neighborhood map
What this means for you Summary
Snapshot
- This is a 4-bed/3.0-bath single-family listed at $600k.
Deal economics
- At list price, monthly cash flow is $2k ($23k/yr) — positive.
- The deal already cash-flows at list — no discount required.
- Meets the 1% rule at list price ($7k rent vs $600k).
- Recommended offer: $591k (1.5% below list) — sets the bar for market timing.
- Cap rate 10.1% vs local median 3.3% in Show Low — top-decile yield for the area; either an underpriced asset or a hidden risk that comps aren't pricing in. Stress-test before assuming the spread holds.
Location & tenants
- Location reads 65/100 on livability (#90 in AZ) — a middle-class / working-renter tenant base. Strengths: cost of living A+, housing A+; Watch: employment D, crime F, amenities F.
- Show Low Unified District (4393) (rural): math 32% / reading 39% proficiency, ranked #89 of 249 in AZ (top 36%) — families likely to look elsewhere, expect single-tenant / working-renter base with shorter leases.
- Zoned schools: Whipple Ranch Elementary School (404 students, 50% FRL); Show Low Junior High School (math 29% / reading 34%, grade F, #78 of 218 statewide, top 36%, 587 students, 45% FRL); Show Low High School (math 22% / reading 37%, grade F, #120 of 381 statewide, top 34%, 877 students, 31% FRL).
- Market conditions: 891 active listings in the ZIP; 1 comparable units currently listed for rent nearby; 485 units permitted in Navajo County in 2024 (11 in 5+ unit buildings).
Forward outlook
- Local home prices are declining (-3.0%/yr); year-one equity from $4k of loan paydown is wiped out by about $18k of value loss. Plan a longer hold.
- Navajo County population projected at -16% by 2050 — secular population decline; favor cash flow + early exit over multi-decade hold.
- At projected returns (-3.0% appreciation + 3.0% rent growth), your $168k cash investment doubles in ~9 years — after that, you're playing with house money.
Negotiation context
- It's been on market 29 days — a 2% lower offer ($591k) is reasonable based on typical stale-listing flexibility.
- 2 sale attempts with the ask held roughly flat each time — persistent listings suggest the price (not the market) is what's stuck; bring a comps-based counter.
- Current owner paid $26k; list at $600k implies a 2253% gain — meaningful room to come down on a strong offer.
Risks & watch-outs
- Climate carrying-cost: major wildfire risk — expect insurance premiums to compound above CPI over the hold.
Questions for the listing agent
- Is there a deadline driving the sale (1031 exchange, divorce, estate, relocation)? That informs how much negotiation room exists.
- Schools are B-rated — typically a magnet for longer-tenancy family renters. What's the average tenant stay here, and is there a school-zone premium baked into asking?
- Crime grade is F in this area — have there been break-ins, vandalism, or insurance claims at this property in the last 3 years? What carrier currently insures it and at what premium?
- What's the average days-on-market for RENTAL listings here right now (not sales)? A rising rental-DOM trend means longer vacancies and softer asking-rent achievability than the comps imply.
- What's the recent tenant-quality profile in this submarket — average credit score on applications, eviction rate, late-payment / NSF rate, and stable-employment percentage? A property-management company in the area should have these aggregated.
- How much new for-sale + rental construction is in the pipeline within 1–3 miles? Heavy new supply typically softens prices + rents 12–24 months out; constrained supply supports both.
Investment metrics
- 1% rule
- 1.17% ✓
- Cap rate
- 10.14%
- Cash-on-cash
- 13.74%
- DSCR
- 1.61
- GRM
- 7.1
CMA / ARV
- ARV (on-the-fly)
- $709,659
- Comps found
- 12
Show comp detail 12 sales within ~0.75 mi
| Address | Dist | Beds/Ba | Sqft | Sold | Price | $/sf | Match |
|---|---|---|---|---|---|---|---|
| 1840 N 36th Dr | 0.19mi | 3/3.0 (-1) | 2,846 (+5%) | 14mo | $564,000 | $198 | 67 |
| 1490 N 40Th Cir | 0.12mi | 3/3.5 (-1) | 2,635 (-3%) | 20mo | $1,025,000 | $389 | 66 |
| 1641 N 36th Dr | 0.23mi | 4/3.0 | 2,625 (-4%) | 21mo | $600,000 | $229 | 66 |
| 4101 W Thornton Rd | 0.08mi | 3/2.0 (-1) | 2,536 (-7%) | 12mo | $525,000 | $207 | 66 |
| 1220 N Fairway Ln | 0.21mi | 3/2.5 (-1) | 2,487 (-8%) | 22mo | $650,000 | $261 | 51 |
| 1080 N 47th Dr | 0.51mi | 3/3.0 (-1) | 2,950 (+8%) | 8mo | $485,000 | $164 | 50 |
| 3591 W Fairway Ct | 0.34mi | 5/3.0 (+1) | 3,093 (+14%) | 8mo | $839,333 | $271 | 50 |
| 1420 N Hidden Hollow Ln | 0.41mi | 4/2.0 | 2,430 (-11%) | 12mo | $645,000 | $265 | 50 |
| 1260 N 36th Dr | 0.28mi | 4/4.0 | 2,984 (+10%) | 21mo | $390,000 | $131 | 49 |
| 3031 W Alpine Ridge Rd | 0.64mi | 4/3.0 | 3,038 (+12%) | 2mo | $885,000 | $291 | 49 |
| 4701 W Hawthorn Rd | 0.67mi | 4/3.5 | 2,618 (-4%) | 19mo | $1,180,000 | $451 | 44 |
| 921 N 36Th Dr | 0.49mi | 3/2.0 (-1) | 2,350 (-14%) | 18mo | $519,000 | $221 | 31 |
Match score weights: distance 35% · size 25% · config 20% · recency 20%. Top-matched comps best support the ARV.
Projected returns pro-forma
-3.0% appreciation · 3.0% rent growth · sell at horizon
- IRR
- 3.9%
- Equity multiple
- 1.15×
- Total profit
- $25,056
- Equity at exit
- $89,462
- IRR
- 13.3%
- Equity multiple
- 2.06×
- Total profit
- $178,649
- Equity at exit
- $51,877
Cash invested: $168,000 (down + closing). Projections, not guarantees.
Landlord ↔ Tenant lean methodology
- Overall (STATE)
- 87 Strongly Landlord-Friendly
- State Arizona
- 87 Strongly Landlord-Friendly · R+3
- County
- — inherits STATE
- City
- — inherits STATE
ZIP-level market 85901
- Home prices YoY
- -14.5%
- Active inventory
- 891
- Price-to-rent
- 7.1×
Monthly cashflow live
- Estimated rent
- $7,000 medium interval (Pro) →
- Mortgage (P&I)
- −$3,146
- Tax from tax record
- −$210 /mo · $2,520/yr
- Insurance
- −$250
- HOA
- −$0
- Vacancy / Maint / Mgmt
- −$1,470
- Net cashflow
- $1,923
Break-even live
Sensitivity live
| Price | -10% $2,263 | -5% $2,093 | +0% $1,923 | +5% $1,754 | +10% $1,584 |
|---|---|---|---|---|---|
| Rent | -10% $1,370 | -5% $1,647 | +0% $1,923 | +5% $2,200 | +10% $2,476 |
| Rate | -1.0pp $2,226 | -0.5pp $2,076 | base $1,923 | +0.5pp $1,768 | +1.0pp $1,610 |
UW: 25.0% down · 7.5% · 30yr · 1.5% tax · 5.0% vac · 8.0% maint · 8.0% mgmt
Financing live
Cash to close
- Down payment
- $150,000
- Closing costs
- $18,000
- Reserves months
- —
- Total cash needed
- —
Loan-product check · same deal, 3 products live
Conventional
25% down · 7.5% · 30yr
- Down + closing
- —
- Monthly P&I
- —
- Monthly cashflow
- —
- DSCR
- —
- Eligible?
- —
Personal DTI + credit; lowest rate.
DSCR
20% down · 8.5% · 30yr
- Down + closing
- —
- Monthly P&I
- —
- Monthly cashflow
- —
- DSCR
- —
- Eligible?
- —
No personal income docs; deal must DSCR.
Hard money
10% down · 12.0% · 12mo
- Down + closing
- —
- Monthly P&I
- —
- Monthly cashflow
- —
- DSCR
- —
- Eligible?
- —
Short-term bridge; refi at stabilization.
Rent comps 1 comps
| Address | Beds | Baths | Sqft | Rent | $/sqft | DOM | Units | Dist |
|---|---|---|---|---|---|---|---|---|
| 4500 W Hackberry Ln #161 Show Low, AZ | 4.0 | 3.5 | 2761 | $7,000 | $2.54 | 44d | 1 | 1.41mi |
Listing history 13 events
-
2026-06-19days on market $600,000 Active 29 DOM
-
2026-06-18days on market $600,000 Active 28 DOM
-
2026-06-17days on market $600,000 Active 27 DOM
-
2026-06-16days on market $600,000 Active 26 DOM
-
2026-06-15days on market $600,000 Active 25 DOM
-
2026-06-14days on market $600,000 Active 23 DOM
-
2026-06-12days on market $600,000 Active 22 DOM
-
2026-06-09days on market $600,000 Active 19 DOM
-
2026-06-08days on market $600,000 Active 18 DOM
-
2026-06-07days on market $600,000 Active 17 DOM
-
2026-06-07pricestatusdays on market $600,000 Active 16 DOM
-
2026-06-04remarks 699-char remark
-
2026-06-04$585,000 Under Contract Accepting Backups 13 DOM
ⓘ Source: listings_history table (triggers on properties + properties_extension) + one-shot
backfill from property_details.listing_events for pre-trigger history.
Tax reassessment forecast AZ · Resets to sale price
- Current annual tax
- $2,520 · $210/mo
- Projected year-2 tax
- $3,960 · $330/mo
- Expected delta
- +$1,440/yr (+$120/mo · 57.1%)
ⓘ Screening estimate from a state-policy table — verify with the county assessor before closing.
Climate risk First Street
- Flood 1/10 Low FEMA zone X (unshaded) · 0% chance over 30 yrs
- Wildfire 6/10 Major
- Heat 2/10 Low 7 d/yr ≥89°F today · 18 d/yr by 30 yrs out
- Wind 1/10 Low
- Air quality 2/10 Low 1 unhealthy d/yr today · 1 by 30 yrs out
Nearby sold comps map
Loading sold comps map…
Walkable amenities ~0.75 mi
Loading nearby amenities…
Taxation est. · year 1
- Rental income
- $84,000
- − Mortgage interest
- −$33,609
- − Property taxes
- −$2,520
- − Insurance
- −$3,000
- − Repairs & maintenance
- −$6,720
- − Management
- −$6,720
- − Depreciation
- −$17,455
- Taxable income
- $13,976
- Est. tax owed @ 24.0%
- −$3,354
- After-tax cash flow
- $19,728/yr
For passive investors: Depreciation is non-cash, so a rental often shows a tax loss while cash-flowing — sheltering income. Rental losses are passive: they offset passive income freely, and up to $25,000/yr can offset ordinary (W-2) income if you actively participate and your MAGI is under $100k (phasing out to $0 by $150k); unused losses carry forward. On sale, claimed depreciation is recaptured at up to 25%, and gains may owe capital-gains tax (a 1031 exchange can defer both). Figures are a year-1 estimate at your 24.0% rate — not tax advice; consult a CPA.
Schools (NCES district)
- District
- Show Low Unified District (4393)
- NCES district ID
- 0407700
- Math proficiency
- 32% ▼ -9.00%
- Reading proficiency
- 39% ▼ -4.00%
- Median HH income
- $41,240
- Composite
- 29.9/100
- National rank
- #6387
- State rank
- #89 of 249 in AZ
Livability — Show Low
- Score
- 65/100
- State rank
- #90
- US rank
- #13573
Category grades
Schools grade is shown separately in the Schools card above.
Census & demographics
- Census place
- Show Low, AZ
- City population
- 18,821
- Population (ZIP)
- 18,821
Population outlook (Navajo County) Hauer SSP2
- Today (2025)
- 105,760 people
- By 2030
- 103,301 · -2.3%
- By 2040
- 97,070 · -8.2%
- By 2050
- 88,850 · -16.0%
- By 2075
- 65,180 · -38.4%
- By 2100
- 37,281 · -64.7%
Race, ethnicity, and origin ACS 2023
- Neighborhood character
- Predominantly White (77%)
- Race & ethnicity
- White 77% Hispanic / Latino 16% Two or more races 11% Native American 2%
- Hispanic origin (detail)
- Mexican 12%
- Common ancestry
- Slovak 2% Lithuanian 2% Italian 2%
- Foreign-born
- 4% · Canada
- Languages at home
- 92% English-only · Spanish 7% Tagalog/Filipino 1%
Political lean MEDSL · Navajo
- 2024 margin
- R (+17.2) · D 40.9% · R 58.1%
- 2008→2024 swing
- -5.5pp toward R · 2008: -11.7pp · 2024: -17.2pp
- All cycles
- 2024: R+17.2 2020: R+8.2 2016: R+7.9 2012: R+8.4 2008: R+11.7
Not yet ingested
- Civics
- —
Market trends
- HPI YoY
- ▼ -65.52%
- Current HPI
- 386.3007
- Rent YoY
- —
- Metro
- —
- State GDP YoY
- ▲ 4.54%
- F500 in state
- 20
Industry mix (Fortune 500 HQ in AZ)
| Industry | F500 HQs | Revenue |
|---|---|---|
| Technology | 2 | $13B |
|
||
| Mining / Metals | 1 | $23B |
|
||
| Environmental Services | 1 | $16B |
|
||
| Metals / Steel | 1 | $14B |
|
||
| Technology Distribution | 1 | $9B |
|
||
| Homebuilding | 1 | $8B |
|
||
Price history
+2826.8% since first listed6 events — show timeline
- 2026-06-04 Relisted — ARMLS
- 2026-06-04 Price Changed $600,000 ARMLS
- 2026-05-28 Contingent — ARMLS
- 2026-05-21 Listed $585,000 ARMLS
- 1999-01-04 Sold (Public Records) $25,500 Public Records
- 1998-10-30 Sold (Public Records) $20,500 Public Records
Property tax history
+4.0%/yrLatest (2025): $2,520 · +4.3% YoY. Source: county tax records.
Cash-flow waterfall
monthlySold comps — $/sqft
last 12 mo · ≤1 miLoading sold comps…