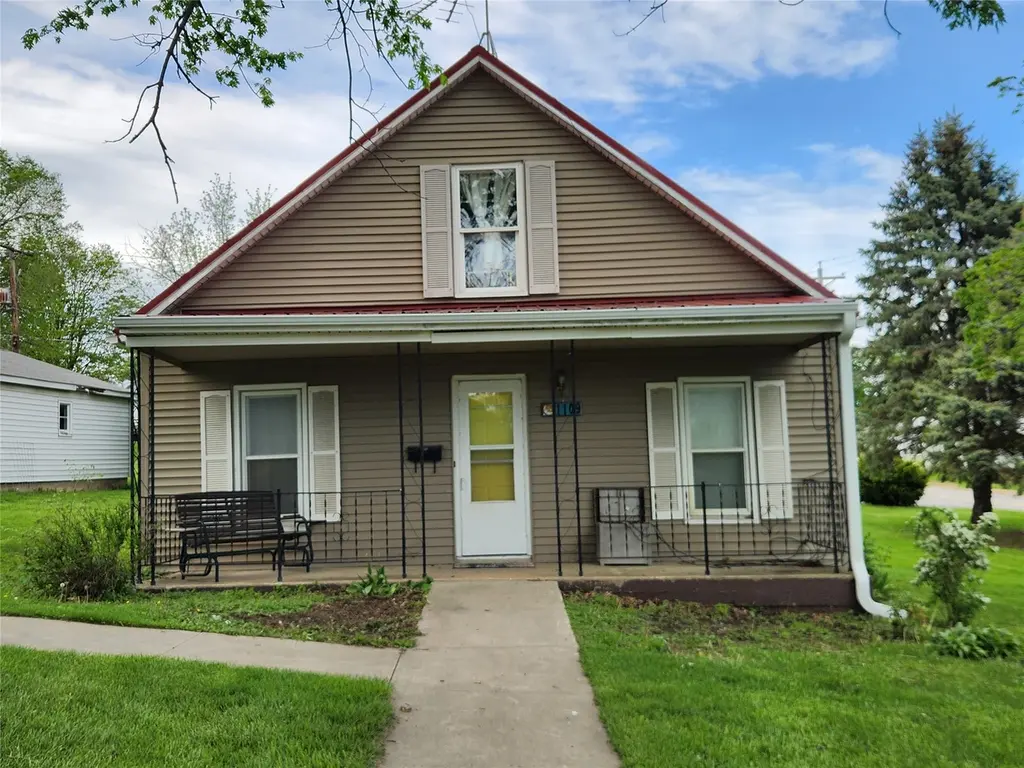
1109 E Montgomery St · Knoxville, IA
Flood risk 1/10 · Minimal
- FEMA flood zone
- X (unshaded)
- Chance of flooding over 30 yrs
- 0.0%
- Est. flood insurance / yr
- $507 – $1,088
Fire risk 3/10 · Minor
- Est. fire insurance / yr
- $902 – $1,676
Heat risk 3/10 · Minor
- Hot days now (above 104°F)
- 7 days/yr
- Hot days in 30 yrs
- 16 days/yr
Wind risk 2/10 · Minimal
- Chance of severe wind over 30 yrs
- —
Air-quality risk 2/10 · Minimal
- Unhealthy air days now
- 0 days/yr
- Unhealthy air days in 30 yrs
- 1 days/yr
Risk factors via First Street. Map © Google.
Why this score? — see what drove the B grade
The composite is a weighted blend of 9 inputs, each scored 0–100. Each bar is that input's sub-score; the figure is the points it added to the 100-point composite (weight × sub-score).
- Cash flow +28.0/30.0
- ARV discount +15.0/15.0
- DSCR +10.0/10.0
- 1% rule +7.7/10.0
- Schools +5.3/10.0
- Livability +3.5/5.0
- Rent growth +2.5/5.0
- Condition / age +2.5/5.0
- Appreciation +0.0/10.0
$95,000
🖨 Deal sheet (PDF) 📄 Offer letter ✓ Due diligence
Listing remarks
Handyman special full of potential! Bring your vision and finishing touches to make this property truly shine. The home already features several valuable updates, including newer countertops and kitchen improvements that add style and functionality to the heart of the home. A spacious oversized 2-car garage provides plenty of room for vehicles, storage, tools, or a workshop setup. Durable metal roof offers long-lasting protection and peace of mind. Whether you're an investor, flipper, or buyer looking to build equity, this property is packed with possibilities. Don’t miss your chance to turn this diamond in the rough into something special!
Key facts
- Durable metal roof
- Newer countertops
- Kitchen improvements
Tags
Property features AI
Exterior
- Parking: Detached two-car garage
- Utilities: Public water; Public sewer
- Home design: Single-story home; Vinyl siding; Asphalt shingle roof
- Construction: Vinyl siding construction; Asphalt shingle roof
- Exterior features: Concrete road frontage; Zoned residential
Interior
- Bedrooms: 2 main-level bedrooms
- Bathrooms: 1 full bathroom
- Heating & cooling: Gas heating; Central air conditioning
- Interior features: One-story layout
Neighborhood map
What this means for you Summary
Snapshot
- This is a 3-bed/1.0-bath single-family listed at $95k.
Deal economics
- At list price, monthly cash flow is $297 ($4k/yr) — positive.
- The deal already cash-flows at list — no discount required.
- Meets the 1% rule at list price ($1k rent vs $95k).
- Cap rate 10.0% vs local median 2.4% in Knoxville — top-decile yield for the area; either an underpriced asset or a hidden risk that comps aren't pricing in. Stress-test before assuming the spread holds.
Location & tenants
- Location reads 69/100 on livability (#406 in IA) — a middle-class / working-renter tenant base. Strengths: cost of living A+, housing A+, health & safety A+; Watch: amenities F, commute F.
- Knoxville Community School District (town): math 62% / reading 63% proficiency, ranked #220 of 289 in IA (top 76%) — acceptable for families but not a draw, mixed tenant base, ~2y average lease.
- Market conditions: 100 active listings in the ZIP; 122 units permitted in Marion County in 2024 (0 in 5+ unit buildings).
Forward outlook
- Local home prices are declining (-3.0%/yr); year-one equity from $657 of loan paydown is wiped out by about $3k of value loss. Plan a longer hold.
- Marion County population projected to shrink 7% by 2050 — rents likely to lag national; underwrite the cash flow, not the appreciation.
- At projected returns (-3.0% appreciation + 3.0% rent growth), your $27k cash investment doubles in ~9 years — after that, you're playing with house money.
Negotiation context
- Only 2 days on market — expect competitive offers; lowballing is unlikely to land.
Risks & watch-outs
- Watch-outs: built in 1907 — expect roof / HVAC / electrical / plumbing capex.
Questions for the listing agent
- Built in 1907 — when were the roof, HVAC, electrical panel, plumbing, and water heater last replaced?
- Is there a deadline driving the sale (1031 exchange, divorce, estate, relocation)? That informs how much negotiation room exists.
- Schools are B-rated — typically a magnet for longer-tenancy family renters. What's the average tenant stay here, and is there a school-zone premium baked into asking?
- What's the average days-on-market for RENTAL listings here right now (not sales)? A rising rental-DOM trend means longer vacancies and softer asking-rent achievability than the comps imply.
- What's the recent tenant-quality profile in this submarket — average credit score on applications, eviction rate, late-payment / NSF rate, and stable-employment percentage? A property-management company in the area should have these aggregated.
- How much new for-sale + rental construction is in the pipeline within 1–3 miles? Heavy new supply typically softens prices + rents 12–24 months out; constrained supply supports both.
Investment metrics
- 1% rule
- 1.27% ✓
- Cap rate
- 10.04%
- Cash-on-cash
- 13.39%
- DSCR
- 1.60
- GRM
- 6.6
CMA / ARV
- ARV (on-the-fly)
- $126,504
- Comps found
- 12
Show comp detail 12 sales within ~0.75 mi
| Address | Dist | Beds/Ba | Sqft | Sold | Price | $/sf | Match |
|---|---|---|---|---|---|---|---|
| 1109 E Montgomery St | 0.00mi | 3/1.0 | 1,004 (0%) | 1mo | $80,000 | $80 | 99 |
| 905 E Montgomery St | 0.08mi | 2/1.0 (-1) | 1,013 (+1%) | 0mo | $127,500 | $126 | 89 |
| 910 E Marion St | 0.18mi | 3/1.0 | 911 (-9%) | 6mo | $82,000 | $90 | 71 |
| 1010 E Washington St | 0.10mi | 3/1.5 | 892 (-11%) | 6mo | $192,000 | $215 | 70 |
| 1406 E Robinson St | 0.14mi | 2/2.0 (-1) | 936 (-7%) | 9mo | $60,000 | $64 | 65 |
| 413 3rd Street Pl | 0.53mi | 2/1.0 (-1) | 1,012 (+1%) | 9mo | $99,500 | $98 | 62 |
| 814 S 1st St | 0.72mi | 2/1.5 (-1) | 1,008 (+0%) | 3mo | $13,900 | $14 | 56 |
| 509 E Washington St | 0.35mi | 2/2.0 (-1) | 1,074 (+7%) | 9mo | $207,000 | $193 | 56 |
| 114 N Attica Rd | 0.15mi | 2/2.0 (-1) | 864 (-14%) | 6mo | $159,000 | $184 | 56 |
| 606 E Montgomery St | 0.29mi | 3/2.0 | 1,135 (+13%) | 6mo | $229,000 | $202 | 55 |
| 410 N 3rd St | 0.59mi | 2/1.5 (-1) | 902 (-10%) | 2mo | $160,000 | $177 | 47 |
| 313 Roche St S | 0.67mi | 2/1.0 (-1) | 1,132 (+13%) | 9mo | $130,000 | $115 | 35 |
Match score weights: distance 35% · size 25% · config 20% · recency 20%. Top-matched comps best support the ARV.
Projected returns pro-forma
-3.0% appreciation · 3.0% rent growth · sell at horizon
- IRR
- 3.4%
- Equity multiple
- 1.13×
- Total profit
- $3,522
- Equity at exit
- $14,165
- IRR
- 13.0%
- Equity multiple
- 2.03×
- Total profit
- $27,475
- Equity at exit
- $8,214
Cash invested: $26,600 (down + closing). Projections, not guarantees.
Landlord ↔ Tenant lean methodology
- Overall (STATE)
- 83 Strongly Landlord-Friendly
- State Iowa
- 83 Strongly Landlord-Friendly · R+6
- County
- — inherits STATE
- City
- — inherits STATE
ZIP-level market 50138
- Home prices YoY
- -25.3%
- Active inventory
- 100
- Price-to-rent
- 6.6×
Monthly cashflow live
- Estimated rent
- $1,207 medium interval (Pro) →
- Mortgage (P&I)
- −$498
- Tax from tax record
- −$119 /mo · $1,428/yr
- Insurance
- −$40
- HOA
- −$0
- Vacancy / Maint / Mgmt
- −$253
- Net cashflow
- $297
Break-even live
Sensitivity live
| Price | -10% $350 | -5% $324 | +0% $297 | +5% $270 | +10% $243 |
|---|---|---|---|---|---|
| Rent | -10% $201 | -5% $249 | +0% $297 | +5% $344 | +10% $392 |
| Rate | -1.0pp $345 | -0.5pp $321 | base $297 | +0.5pp $272 | +1.0pp $247 |
UW: 25.0% down · 7.5% · 30yr · 1.5% tax · 5.0% vac · 8.0% maint · 8.0% mgmt
Financing live
Cash to close
- Down payment
- $23,750
- Closing costs
- $2,850
- Reserves months
- —
- Total cash needed
- —
Loan-product check · same deal, 3 products live
Conventional
25% down · 7.5% · 30yr
- Down + closing
- —
- Monthly P&I
- —
- Monthly cashflow
- —
- DSCR
- —
- Eligible?
- —
Personal DTI + credit; lowest rate.
DSCR
20% down · 8.5% · 30yr
- Down + closing
- —
- Monthly P&I
- —
- Monthly cashflow
- —
- DSCR
- —
- Eligible?
- —
No personal income docs; deal must DSCR.
Hard money
10% down · 12.0% · 12mo
- Down + closing
- —
- Monthly P&I
- —
- Monthly cashflow
- —
- DSCR
- —
- Eligible?
- —
Short-term bridge; refi at stabilization.
Listing history 2 events
-
2026-05-01status Pending
-
2026-04-29$95,000 Active
ⓘ Source: listings_history table (triggers on properties + properties_extension) + one-shot
backfill from property_details.listing_events for pre-trigger history.
Tax reassessment forecast IA · Partial reset (capped growth)
- Current annual tax
- $1,428 · $119/mo
- Projected year-2 tax
- $1,460 · $122/mo
- Expected delta
- +$32/yr (+$3/mo · 2.2%)
ⓘ Screening estimate from a state-policy table — verify with the county assessor before closing.
Climate risk First Street
- Flood 1/10 Low FEMA zone X (unshaded) · 0% chance over 30 yrs
- Wildfire 3/10 Moderate
- Heat 3/10 Moderate 7 d/yr ≥104°F today · 16 d/yr by 30 yrs out
- Wind 2/10 Low
- Air quality 2/10 Low 0 unhealthy d/yr today · 1 by 30 yrs out
Nearby sold comps map
Loading sold comps map…
Walkable amenities ~0.75 mi
Loading nearby amenities…
Taxation est. · year 1
- Rental income
- $14,483
- − Mortgage interest
- −$5,321
- − Property taxes
- −$1,428
- − Insurance
- −$475
- − Repairs & maintenance
- −$1,159
- − Management
- −$1,159
- − Depreciation
- −$2,764
- Taxable income
- $2,178
- Est. tax owed @ 24.0%
- −$523
- After-tax cash flow
- $3,038/yr
For passive investors: Depreciation is non-cash, so a rental often shows a tax loss while cash-flowing — sheltering income. Rental losses are passive: they offset passive income freely, and up to $25,000/yr can offset ordinary (W-2) income if you actively participate and your MAGI is under $100k (phasing out to $0 by $150k); unused losses carry forward. On sale, claimed depreciation is recaptured at up to 25%, and gains may owe capital-gains tax (a 1031 exchange can defer both). Figures are a year-1 estimate at your 24.0% rate — not tax advice; consult a CPA.
Schools (NCES district)
- District
- Knoxville Community School District
- NCES district ID
- 1915840
- Math proficiency
- 62% ▼ -6.00%
- Reading proficiency
- 63% ▬ 0.00%
- Median HH income
- $49,594
- Composite
- 53.11/100
- National rank
- #1512
- State rank
- #220 of 289 in IA
Livability — Knoxville
- Score
- 69/100
- State rank
- #406
- US rank
- #8643
Category grades
Schools grade is shown separately in the Schools card above.
Census & demographics
- Census place
- Knoxville, IA
- County
- Marion County · 25,533 people
- City population
- 11,117
- Metro
- Pella, IA
- Population (ZIP)
- 11,117
- Household income
- $74,693
- Rent vs Own
- Severe rent burden
- 122.0
Population outlook (Marion County) Hauer SSP2
- Today (2025)
- 32,883 people
- By 2030
- 32,685 · -0.6%
- By 2040
- 31,892 · -3.0%
- By 2050
- 30,691 · -6.7%
- By 2075
- 27,610 · -16.0%
- By 2100
- 23,851 · -27.5%
Race, ethnicity, and origin ACS 2023
- Neighborhood character
- Predominantly White (94%)
- Race & ethnicity
- White 94% Two or more races 3% Hispanic / Latino 2%
- Common ancestry
- Iranian 12% Portuguese 4% Italian 4%
- Foreign-born
- 1% · Philippines, Canada
- Languages at home
- 99% English-only · Spanish 1%
Political lean MEDSL · Marion
- 2024 margin
- Solid R (+37.8) · D 30.4% · R 68.2% · Other 1.4%
- 2008→2024 swing
- -27.0pp toward R · 2008: -10.8pp · 2024: -37.8pp
- All cycles
- 2024: R+37.8 2020: R+33.7 2016: R+31.2 2012: R+13.3 2008: R+10.8
Not yet ingested
- Civics
- —
Market trends
- HPI YoY
- ▼ -80.37%
- Current HPI
- 237.7055
- Rent YoY
- —
- Metro
- Pella, IA
- State GDP YoY
- ▲ 2.48%
- F500 in state
- 4
Industry mix (Fortune 500 HQ in IA)
| Industry | F500 HQs | Revenue |
|---|---|---|
| Financial Services | 1 | $16B |
|
||
| Retail / Convenience | 1 | $15B |
|
||
Price history
2 events — show timeline
- 2026-05-01 Pending — DMMLS
- 2026-04-29 Listed $95,000 DMMLS
Property tax history
+5.8%/yrLatest (2025): $1,428 · +2.9% YoY. Source: county tax records.
Cash-flow waterfall
monthlySold comps — $/sqft
last 12 mo · ≤1 miLoading sold comps…