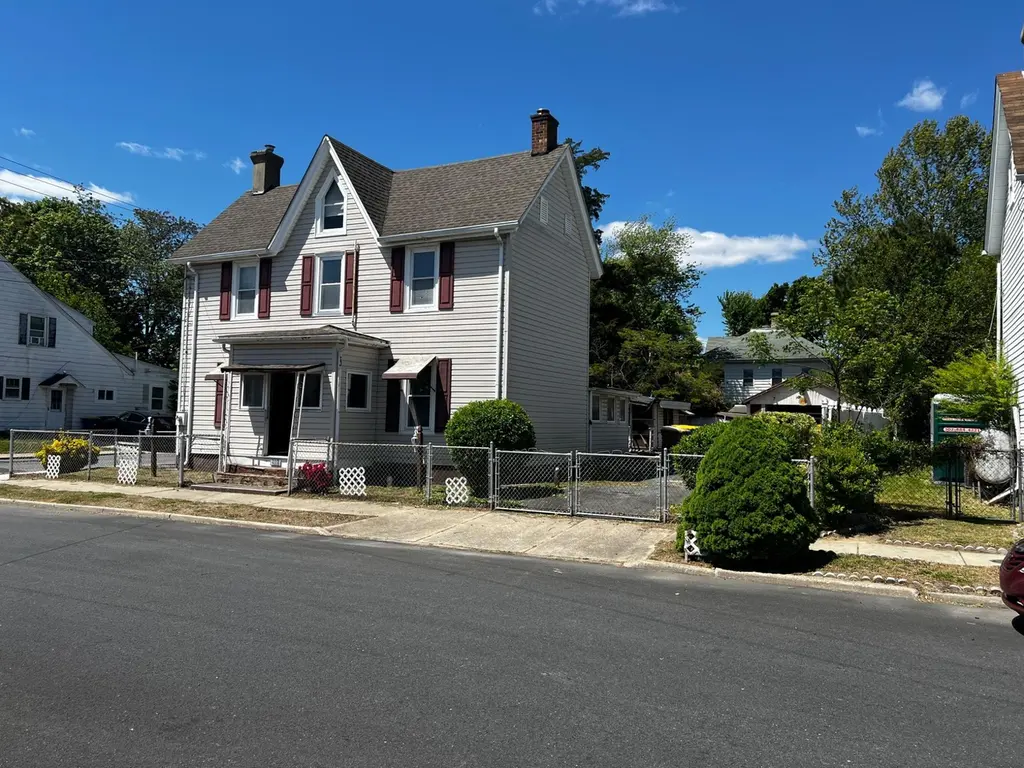
201 NE 4th St · Milford, DE
Flood risk 1/10 · Minimal
- FEMA flood zone
- X (unshaded)
- Chance of flooding over 30 yrs
- 0.0%
- Est. flood insurance / yr
- $473 – $860
Fire risk 1/10 · Minimal
- Est. fire insurance / yr
- $476 – $884
Heat risk 8/10 · Major
- Hot days now (above 102°F)
- 7 days/yr
- Hot days in 30 yrs
- 17 days/yr
Wind risk 7/10 · Major
- Chance of severe wind over 30 yrs
- 76.0%
Air-quality risk 2/10 · Minimal
- Unhealthy air days now
- 1 days/yr
- Unhealthy air days in 30 yrs
- 1 days/yr
Risk factors via First Street. Map © Google.
Why this score? — see what drove the B grade
The composite is a weighted blend of 9 inputs, each scored 0–100. Each bar is that input's sub-score; the figure is the points it added to the 100-point composite (weight × sub-score).
- Cash flow +30.0/30.0
- ARV discount +15.0/15.0
- DSCR +10.0/10.0
- 1% rule +7.5/10.0
- Livability +3.1/5.0
- Rent growth +2.5/5.0
- Condition / age +2.5/5.0
- Schools +2.2/10.0
- Appreciation +0.0/10.0
$150,000
🖨 Deal sheet 📄 Offer letter ✓ Due diligence
Listing remarks
Remarkable opportunity to purchase this home to be renovated. Priced to sell, you will find a solid structure with an intact exterior with good roof, windows and siding. Detached 1 car garage with off street parking all located on a large in town lot with loads of potential. Total renovation needed on the interior. Home is now vacant, but was recently rented.
Key facts
- Good siding
- Intact exterior
- Good windows
Tags
Property features AI
Finance
- Other: Ownership: Fee simple
Exterior
- Parking: Detached garage (front entry) with one garage space; Driveway parking
- Utilities: Public water; Private sewer
- Home design: Detached property; Combination construction materials; Concrete perimeter foundation
- Construction: Estimated year built; Concrete perimeter foundation; Combination exterior construction
- Exterior features: Not in a federal flood zone; Ground rent paid annually; Tidal water: no; Other above-grade structures
Interior
- Bedrooms: Three bedrooms on the main level
- Bathrooms: One full bathroom on the main level; One half bathroom on the main level
- Heating & cooling: Convector heating; Propane hot water (leased propane)
- Interior features: Estimated living area; No basement
Neighborhood map
What this means for you Summary
Snapshot
- This is a 4-bed/1.5-bath single-family listed at $150k.
Deal economics
- At list price, monthly cash flow is $558 ($7k/yr) — positive.
- The deal already cash-flows at list — no discount required.
- Meets the 1% rule at list price ($2k rent vs $150k).
- Recommended offer: $148k (1.5% below list) — sets the bar for market timing.
- Cap rate 10.8% vs local median 3.7% in Milford — top-decile yield for the area; either an underpriced asset or a hidden risk that comps aren't pricing in. Stress-test before assuming the spread holds.
Location & tenants
- Location reads 62/100 on livability (#61 in DE) — a middle-class / working-renter tenant base. Strengths: cost of living A+, health & safety A+, housing A-; Watch: crime F, amenities F, commute F.
- Milford School District (town): math 18% / reading 32% proficiency, ranked #22 of 26 in DE (top 85%) — low school quality limits family demand, transient renter base, plan for 1-2y turnover.
- Zoned schools: Milford Central Academy (math 21% / reading 36%, grade F, #17 of 36 statewide, top 46%, 1,068 students, 0% FRL); Milford Senior High School (math 17% / reading 32%, grade F, #27 of 40 statewide, top 69%, 1,279 students, 0% FRL) — zoned schools average 0% FRL vs 51% district-wide (51 pts lower); this property's tenant base skews higher-income than the district average.
- Market conditions: 205 active listings in the ZIP; 6 comparable units currently listed for rent nearby; rentals lingering (median 44d on market — plan ~5-8 weeks vacancy on turnover, expect pricing pressure); 100% of comp listings sitting > 30 days — soft ceiling on asking rent; 1,201 units permitted in Kent County in 2024 (116 in 5+ unit buildings).
Forward outlook
- Local home prices are declining (-3.0%/yr); year-one equity from $1k of loan paydown is wiped out by about $4k of value loss. Plan a longer hold.
- Kent County population projected at +22% by 2050 — long-run rental-demand tailwind backs the buy-and-hold thesis.
- At projected returns (-3.0% appreciation + 3.0% rent growth), your $42k cash investment doubles in ~8 years — after that, you're playing with house money.
Negotiation context
- It's been on market 23 days — a 2% lower offer ($148k) is reasonable based on typical stale-listing flexibility.
Risks & watch-outs
- Watch-outs: built in 1949 — expect roof / HVAC / electrical / plumbing capex.
- Climate carrying-cost: major wind risk, 76% chance of damaging wind over 30y; extreme-heat days projected 7→17/yr by 2055 (HVAC capex compounding) — expect insurance premiums to compound above CPI over the hold.
Questions for the listing agent
- Built in 1949 — when were the roof, HVAC, electrical panel, plumbing, and water heater last replaced?
- Is there a deadline driving the sale (1031 exchange, divorce, estate, relocation)? That informs how much negotiation room exists.
- Schools are D-rated, which usually means shorter tenancies and higher turnover. Who's the typical renter profile here, and what's been the actual vacancy rate?
- Crime grade is F in this area — have there been break-ins, vandalism, or insurance claims at this property in the last 3 years? What carrier currently insures it and at what premium?
- What's the average days-on-market for RENTAL listings here right now (not sales)? A rising rental-DOM trend means longer vacancies and softer asking-rent achievability than the comps imply.
- What's the recent tenant-quality profile in this submarket — average credit score on applications, eviction rate, late-payment / NSF rate, and stable-employment percentage? A property-management company in the area should have these aggregated.
- How much new for-sale + rental construction is in the pipeline within 1–3 miles? Heavy new supply typically softens prices + rents 12–24 months out; constrained supply supports both.
Investment metrics
- 1% rule
- 1.25% ✓
- Cap rate
- 10.76%
- Cash-on-cash
- 15.95%
- DSCR
- 1.71
- GRM
- 6.7
CMA / ARV
- ARV (median comp)
- $280,234
- List price
- $150,000
- Delta
- -46.47%
- Verdict
- UNDERPRICED
- Comps
- 20 within 1.0 mi
Show comp detail 12 sales within ~0.75 mi
| Address | Dist | Beds/Ba | Sqft | Sold | Price | $/sf | Match |
|---|---|---|---|---|---|---|---|
| 9 General Torbert Dr | 0.34mi | 3/2.0 (-1) | 1,506 (+2%) | 2mo | $360,000 | $239 | 72 |
| 216 N Walnut | 0.13mi | 3/2.0 (-1) | 1,600 (+9%) | 1mo | $169,900 | $106 | 72 |
| 216 S Washington St | 0.47mi | 3/1.5 (-1) | 1,500 (+2%) | 5mo | $240,000 | $160 | 66 |
| 807 N Walnut St | 0.49mi | 3/1.5 (-1) | 1,442 (-2%) | 3mo | $150,000 | $104 | 66 |
| 204 SE 2nd St | 0.43mi | 3/1.0 (-1) | 1,448 (-2%) | 8mo | $150,000 | $104 | 63 |
| 106 Brady Dr | 0.30mi | 3/2.0 (-1) | 1,352 (-8%) | 3mo | $287,000 | $212 | 63 |
| 206A Truitt Ave | 0.41mi | 3/2.5 (-1) | 1,415 (-4%) | 5mo | $325,000 | $230 | 61 |
| 1 Governor Burton Ct | 0.16mi | 3/2.0 (-1) | 1,292 (-12%) | 8mo | $330,990 | $256 | 58 |
| 107 Charles | 0.59mi | 3/2.5 (-1) | 1,415 (-4%) | 3mo | $325,000 | $230 | 54 |
| 7 Causey Ave | 0.40mi | 3/2.0 (-1) | 1,600 (+9%) | 7mo | $320,480 | $200 | 54 |
| 106 Causey Ave | 0.50mi | 4/3.0 | 1,648 (+12%) | 2mo | $304,000 | $184 | 49 |
| 803 N Washington St | 0.47mi | 3/2.0 (-1) | 1,288 (-12%) | 6mo | $286,000 | $222 | 45 |
Match score weights: distance 35% · size 25% · config 20% · recency 20%. Top-matched comps best support the ARV.
Projected returns pro-forma
-3.0% appreciation · 3.0% rent growth · sell at horizon
- IRR
- 6.8%
- Equity multiple
- 1.27×
- Total profit
- $11,198
- Equity at exit
- $22,365
- IRR
- 16.2%
- Equity multiple
- 2.32×
- Total profit
- $55,348
- Equity at exit
- $12,969
Cash invested: $42,000 (down + closing). Projections, not guarantees.
Landlord ↔ Tenant lean methodology
- Overall (STATE)
- 70 Landlord-Friendly
- State Delaware
- 70 Landlord-Friendly · D+7
- County
- — inherits STATE
- City
- — inherits STATE
ZIP-level market 19963
- Active inventory
- 205
- Price-to-rent
- 6.7×
Monthly cashflow live
- Estimated rent
- $1,871 high interval (Pro) →
- Mortgage (P&I)
- −$787
- Tax from tax record
- −$71 /mo · $850/yr
- Insurance
- −$62
- HOA
- −$0
- Vacancy / Maint / Mgmt
- −$393
- Net cashflow
- $558
Break-even live
UW: 25.0% down · 7.5% · 30yr · 1.5% tax · 5.0% vac · 8.0% maint · 8.0% mgmt
Financing live
Cash to close
- Down payment
- $37,500
- Closing costs
- $4,500
- Reserves months
- —
- Total cash needed
- —
Loan-product check · same deal, 3 products live
Conventional
25% down · 7.5% · 30yr
- Down + closing
- —
- Monthly P&I
- —
- Monthly cashflow
- —
- DSCR
- —
- Eligible?
- —
Personal DTI + credit; lowest rate.
DSCR
20% down · 8.5% · 30yr
- Down + closing
- —
- Monthly P&I
- —
- Monthly cashflow
- —
- DSCR
- —
- Eligible?
- —
No personal income docs; deal must DSCR.
Hard money
10% down · 12.0% · 12mo
- Down + closing
- —
- Monthly P&I
- —
- Monthly cashflow
- —
- DSCR
- —
- Eligible?
- —
Short-term bridge; refi at stabilization.
Rent comps 6 comps
| Address | Beds | Baths | Sqft | Rent | $/sqft | DOM | Units | Dist |
|---|---|---|---|---|---|---|---|---|
| 409 N Washington St Milford, DE | 3.0 | 1.5 | 1050 | $1,500 | $1.43 | 43d | 1 | 0.11mi |
| 400 N Walnut St Milford, DE | 3.0 | 2.0 | 1200 | $2,100 | $1.75 | 43d | 1 | 0.15mi |
| 100 Valley Dr Milford, DE | 1.0–3.0 | 1.0–2.0 | 1011 | $2,009 | $1.99 | 43d | 13 | 0.59mi |
| 17151 Windward Blvd Unit 8-203 Milford, DE | 3.0 | 2.0 | 1456 | $2,195 | $1.51 | 43d | 1 | 1.13mi |
| 6364 Pebblebrook Dr Milford, DE | 3.0 | 2.5 | 1307 | $2,600 | $1.99 | 43d | 1 | 1.32mi |
| 10875 Farmerfield St Milford, DE | 3.0 | 2.5 | 1365 | $2,195 | $1.61 | 43d | 1 | 1.41mi |
Listing history 7 events
-
2026-06-07statusdays on market $150,000 Pending 23 DOM
-
2026-06-03days on market $150,000 Active 21 DOM
-
2026-06-02days on market $150,000 Active 20 DOM
-
2026-06-01days on market $150,000 Active 19 DOM
-
2026-05-31days on market $150,000 Active 18 DOM
-
2026-05-30days on market $150,000 Active 17 DOM
-
2026-05-13$150,000 Active 361-char remark
ⓘ Source: listings_history table (triggers on properties + properties_extension) + one-shot
backfill from property_details.listing_events for pre-trigger history.
Tax reassessment forecast DE · Partial reset (capped growth)
- Current annual tax
- $850 · $71/mo
- Projected year-2 tax
- $860 · $72/mo
- Expected delta
- +$10/yr (+$1/mo · 1.2%)
ⓘ Screening estimate from a state-policy table — verify with the county assessor before closing.
Climate risk First Street
- Flood 1/10 Low FEMA zone X (unshaded) · 0% chance over 30 yrs
- Wildfire 1/10 Low
- Heat 8/10 Severe 7 d/yr ≥102°F today · 17 d/yr by 30 yrs out
- Wind 7/10 Severe 76% chance of damaging wind over 30 yrs
- Air quality 2/10 Low 1 unhealthy d/yr today · 1 by 30 yrs out
Nearby sold comps map
Loading sold comps map…
Walkable amenities ~0.75 mi
Loading nearby amenities…
Taxation est. · year 1
- Rental income
- $22,452
- − Mortgage interest
- −$8,402
- − Property taxes
- −$850
- − Insurance
- −$750
- − Repairs & maintenance
- −$1,796
- − Management
- −$1,796
- − Depreciation
- −$4,364
- Taxable income
- $4,494
- Est. tax owed @ 24.0%
- −$1,078
- After-tax cash flow
- $5,619/yr
For passive investors: Depreciation is non-cash, so a rental often shows a tax loss while cash-flowing — sheltering income. Rental losses are passive: they offset passive income freely, and up to $25,000/yr can offset ordinary (W-2) income if you actively participate and your MAGI is under $100k (phasing out to $0 by $150k); unused losses carry forward. On sale, claimed depreciation is recaptured at up to 25%, and gains may owe capital-gains tax (a 1031 exchange can defer both). Figures are a year-1 estimate at your 24.0% rate — not tax advice; consult a CPA.
Schools (NCES district)
- District
- Milford School District
- NCES district ID
- 1001080
- Math proficiency
- 18% ▼ -26.00%
- Reading proficiency
- 32% ▼ -19.00%
- Median HH income
- $51,794
- Composite
- 22.18/100
- National rank
- #8162
- State rank
- #22 of 26 in DE
Livability — Milford
- Score
- 62/100
- State rank
- #61
- US rank
- #16211
Category grades
Schools grade is shown separately in the Schools card above.
Census & demographics
- Census place
- Milford, DE
- Population (ZIP)
- 22,544
Population outlook (Kent County) Hauer SSP2
- Today (2025)
- 194,477 people
- By 2030
- 204,351 · +5.1%
- By 2040
- 222,135 · +14.2%
- By 2050
- 236,483 · +21.6%
- By 2075
- 266,327 · +36.9%
- By 2100
- 275,335 · +41.6%
Race, ethnicity, and origin ACS 2023
- Neighborhood character
- Diverse neighborhood (Simpson 0.56)
- Race & ethnicity
- White 62% Black 20% Hispanic / Latino 10% Two or more races 7% Asian 3%
- Hispanic origin (detail)
- Mexican 4% Puerto Rican 2%
- Common ancestry
- Hispanic 3% Romanian 2% Slovak 1%
- Foreign-born
- 11% · Canada, China
- Languages at home
- 84% English-only · Spanish 7% French/Haitian/Cajun 5% Other Indo-European 2%
Political lean MEDSL · Kent
- 2024 margin
- Toss-up / Even · D 50.2% · R 48.2% · Other 1.7%
- 2008→2024 swing
- -7.8pp toward R · 2008: 9.8pp · 2024: 2.0pp
- All cycles
- 2024: D+2.0 2020: D+4.1 2016: R+4.9 2012: D+4.9 2008: D+9.8
Not yet ingested
- Civics
- —
Market trends
- HPI YoY
- ▼ -135.01%
- Current HPI
- 227.2369
- Rent YoY
- —
- Metro
- —
- State GDP YoY
- —
- F500 in state
- 0
Price history
2 events — show timeline
- 2026-06-05 Pending — BRIGHT MLS
- 2026-05-13 Listed $150,000 BRIGHT MLS
Property tax history
+3.9%/yrLatest (2025): $850 · -43.5% YoY. Source: county tax records.
Cash-flow waterfall
monthlySold comps — $/sqft
last 12 mo · ≤1 miLoading sold comps…