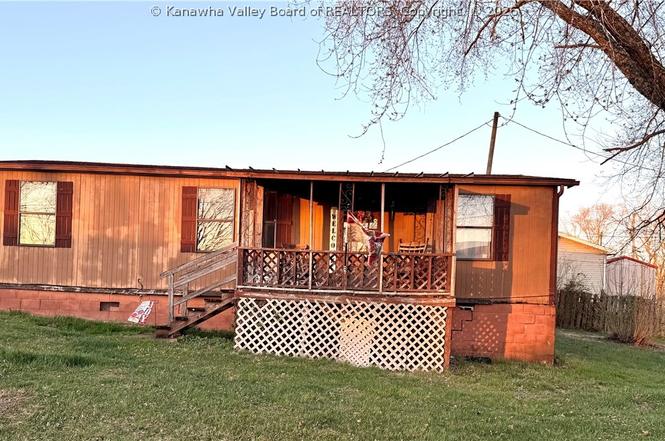
19 Lee Cir · Hurricane, WV
Flood risk 1/10 · Minimal
- FEMA flood zone
- X (unshaded)
- Chance of flooding over 30 yrs
- 0.0%
- Est. flood insurance / yr
- $507 – $1,088
Fire risk 5/10 · Moderate
- Est. fire insurance / yr
- $787 – $1,461
Heat risk 5/10 · Moderate
- Hot days now (above 101°F)
- 7 days/yr
- Hot days in 30 yrs
- 20 days/yr
Wind risk 2/10 · Minimal
- Chance of severe wind over 30 yrs
- 1.0%
Air-quality risk 1/10 · Minimal
- Unhealthy air days now
- 0 days/yr
- Unhealthy air days in 30 yrs
- 0 days/yr
Risk factors via First Street. Map © Google.
Why this score? — see what drove the B grade
The composite is a weighted blend of 9 inputs, each scored 0–100. Each bar is that input's sub-score; the figure is the points it added to the 100-point composite (weight × sub-score).
- Cash flow +30.0/30.0
- 1% rule +10.0/10.0
- DSCR +10.0/10.0
- ARV discount +7.5/15.0
- Schools +3.9/10.0
- Livability +3.6/5.0
- Rent growth +2.5/5.0
- Condition / age +2.5/5.0
- Appreciation +0.0/10.0
$82,500
🖨 Deal sheet 📄 Offer letter ✓ Due diligence
Listing remarks
Great opportunity just outside the city limits of Hurricane, WV! This mobile home sits on a desirable corner lot and features recently replaced laminate flooring, offering a solid start for updates and improvements. With a little vision and TLC, this property could make a great fixer-upper for a homeowner or a valuable addition to an investor's portfolio.
Key facts
- Corner lot
- 7,623 sq ft lot
- Garage
Tags
Neighborhood map
What this means for you Summary
Snapshot
- This is a 3-bed/2.0-bath manufactured listed at $82k.
Deal economics
- At list price, monthly cash flow is $612 ($7k/yr) — positive.
- The deal already cash-flows at list — no discount required.
- Meets the 1% rule at list price ($1k rent vs $82k).
- Cap rate 15.2% vs local median 4.0% in Hurricane — top-decile yield for the area; either an underpriced asset or a hidden risk that comps aren't pricing in. Stress-test before assuming the spread holds.
Location & tenants
- Location reads 72/100 on livability (#47 in WV) — a middle-class / working-renter tenant base. Strengths: crime A+, cost of living A+, housing A+; Watch: amenities F, commute F, health & safety F.
- Putnam County Schools (suburban): math 40% / reading 50% proficiency, ranked #2 of 55 in WV (top 4%) — families likely to look elsewhere, expect single-tenant / working-renter base with shorter leases.
- Zoned schools: Hurricane Town Elementary (math 42% / reading 42%, grade F, #87 of 377 statewide, top 28%, 299 students, 0% FRL); Hurricane Middle (math 44% / reading 50%, grade D+, #6 of 109 statewide, top 6%, 849 students, 0% FRL); Hurricane High School (math 38% / reading 62%, grade D+, #6 of 110 statewide, top 5%, 1,256 students, 0% FRL) — zoned schools average 0% FRL vs 33% district-wide (33 pts lower); this property's tenant base skews higher-income than the district average.
- Market conditions: 119 active listings in the ZIP; solid renter incomes; 111 units permitted in Putnam County in 2024 (0 in 5+ unit buildings).
Forward outlook
- Local home prices are declining (-3.0%/yr); year-one equity from $570 of loan paydown is wiped out by about $2k of value loss. Plan a longer hold.
- At projected returns (-3.0% appreciation + 3.0% rent growth), your $23k cash investment doubles in ~4 years — after that, you're playing with house money.
Negotiation context
- Only 10 days on market — expect competitive offers; lowballing is unlikely to land.
Risks & watch-outs
- Climate carrying-cost: moderate wildfire risk; extreme-heat days projected 7→20/yr by 2055 (HVAC capex compounding) — expect insurance premiums to compound above CPI over the hold.
Questions for the listing agent
- Is there a deadline driving the sale (1031 exchange, divorce, estate, relocation)? That informs how much negotiation room exists.
- Schools are D-rated, which usually means shorter tenancies and higher turnover. Who's the typical renter profile here, and what's been the actual vacancy rate?
- What's the average days-on-market for RENTAL listings here right now (not sales)? A rising rental-DOM trend means longer vacancies and softer asking-rent achievability than the comps imply.
- What's the recent tenant-quality profile in this submarket — average credit score on applications, eviction rate, late-payment / NSF rate, and stable-employment percentage? A property-management company in the area should have these aggregated.
- How much new for-sale + rental construction is in the pipeline within 1–3 miles? Heavy new supply typically softens prices + rents 12–24 months out; constrained supply supports both.
Investment metrics
- 1% rule
- 1.69% ✓
- Cap rate
- 15.19%
- Cash-on-cash
- 31.77%
- DSCR
- 2.41
- GRM
- 4.9
CMA / ARV
- ARV (on-the-fly)
- $49,500
- Comps found
- 1
Show comp detail 1 sale within ~0.75 mi
| Address | Dist | Beds/Ba | Sqft | Sold | Price | $/sf | Match |
|---|---|---|---|---|---|---|---|
| 19 Lee Cir | 0.00mi | 3/2.0 | 1,100 (0%) | 1mo | $50,000 | $45 | 100 |
Match score weights: distance 35% · size 25% · config 20% · recency 20%. Top-matched comps best support the ARV.
Projected returns pro-forma
-3.0% appreciation · 3.0% rent growth · sell at horizon
- IRR
- 26.7%
- Equity multiple
- 2.11×
- Total profit
- $25,558
- Equity at exit
- $12,301
- IRR
- 34.3%
- Equity multiple
- 4.13×
- Total profit
- $72,306
- Equity at exit
- $7,133
Cash invested: $23,100 (down + closing). Projections, not guarantees.
Landlord ↔ Tenant lean methodology
- Overall (STATE)
- 83 Strongly Landlord-Friendly
- State West Virginia
- 83 Strongly Landlord-Friendly · R+22
- County
- — inherits STATE
- City
- — inherits STATE
ZIP-level market 25526
- Home prices YoY
- -30.1%
- Active inventory
- 119
- Price-to-rent
- 4.9×
Monthly cashflow live
- Estimated rent
- $1,398 medium interval (Pro) →
- Mortgage (P&I)
- −$433
- Tax from tax record
- −$26 /mo · $307/yr
- Insurance
- −$34
- HOA
- −$0
- Vacancy / Maint / Mgmt
- −$294
- Net cashflow
- $612
Break-even live
UW: 25.0% down · 7.5% · 30yr · 1.5% tax · 5.0% vac · 8.0% maint · 8.0% mgmt
Financing live
Cash to close
- Down payment
- $20,625
- Closing costs
- $2,475
- Reserves months
- —
- Total cash needed
- —
Loan-product check · same deal, 3 products live
Conventional
25% down · 7.5% · 30yr
- Down + closing
- —
- Monthly P&I
- —
- Monthly cashflow
- —
- DSCR
- —
- Eligible?
- —
Personal DTI + credit; lowest rate.
DSCR
20% down · 8.5% · 30yr
- Down + closing
- —
- Monthly P&I
- —
- Monthly cashflow
- —
- DSCR
- —
- Eligible?
- —
No personal income docs; deal must DSCR.
Hard money
10% down · 12.0% · 12mo
- Down + closing
- —
- Monthly P&I
- —
- Monthly cashflow
- —
- DSCR
- —
- Eligible?
- —
Short-term bridge; refi at stabilization.
Listing history 2 events
-
2026-03-23status Pending
-
2026-03-13$82,500 Active
ⓘ Source: listings_history table (triggers on properties + properties_extension) + one-shot
backfill from property_details.listing_events for pre-trigger history.
Tax reassessment forecast WV · Resets to sale price
- Current annual tax
- $307 · $26/mo
- Projected year-2 tax
- $487 · $41/mo
- Expected delta
- +$180/yr (+$15/mo · 58.4%)
ⓘ Screening estimate from a state-policy table — verify with the county assessor before closing.
Climate risk First Street
- Flood 1/10 Low FEMA zone X (unshaded) · 0% chance over 30 yrs
- Wildfire 5/10 Major
- Heat 5/10 Major 7 d/yr ≥101°F today · 20 d/yr by 30 yrs out
- Wind 2/10 Low 100% chance of damaging wind over 30 yrs
- Air quality 1/10 Low 0 unhealthy d/yr today · 0 by 30 yrs out
Nearby sold comps map
Loading sold comps map…
Walkable amenities ~0.75 mi
Loading nearby amenities…
Taxation est. · year 1
- Rental income
- $16,773
- − Mortgage interest
- −$4,621
- − Property taxes
- −$307
- − Insurance
- −$412
- − Repairs & maintenance
- −$1,342
- − Management
- −$1,342
- − Depreciation
- −$2,400
- Taxable income
- $6,348
- Est. tax owed @ 24.0%
- −$1,524
- After-tax cash flow
- $5,816/yr
For passive investors: Depreciation is non-cash, so a rental often shows a tax loss while cash-flowing — sheltering income. Rental losses are passive: they offset passive income freely, and up to $25,000/yr can offset ordinary (W-2) income if you actively participate and your MAGI is under $100k (phasing out to $0 by $150k); unused losses carry forward. On sale, claimed depreciation is recaptured at up to 25%, and gains may owe capital-gains tax (a 1031 exchange can defer both). Figures are a year-1 estimate at your 24.0% rate — not tax advice; consult a CPA.
Schools (NCES district)
- District
- Putnam County Schools
- NCES district ID
- 5401200
- Math proficiency
- 40% ▼ -13.00%
- Reading proficiency
- 50% ▼ -6.00%
- Median HH income
- $54,783
- Composite
- 39.06/100
- National rank
- #4060
- State rank
- #2 of 55 in WV
Livability — Hurricane
- Score
- 72/100
- State rank
- #47
- US rank
- #5846
Category grades
Schools grade is shown separately in the Schools card above.
Census & demographics
- County
- Putnam County · 22,514 people
- City population
- 22,514
- Metro
- Huntington-Ashland, WV-KY-OH
- Population (ZIP)
- 22,514
- Household income
- $85,176
- Rent vs Own
- Severe rent burden
- 205.0
Population outlook (Putnam County) Hauer SSP2
- Today (2025)
- 58,915 people
- By 2030
- 59,400 · +0.8%
- By 2040
- 59,444 · +0.9%
- By 2050
- 58,510 · -0.7%
- By 2075
- 54,603 · -7.3%
- By 2100
- 46,202 · -21.6%
Race, ethnicity, and origin ACS 2023
- Neighborhood character
- Predominantly White (94%)
- Race & ethnicity
- White 94% Two or more races 3% Hispanic / Latino 2% Asian 1%
- Common ancestry
- Slovak 3% Italian 1% Serbian 1%
- Foreign-born
- 2% · Canada
- Languages at home
- 98% English-only · Spanish 1% Other Asian/Pacific 0%
Political lean MEDSL · Putnam
- 2024 margin
- Solid R (+46.3) · D 25.9% · R 72.2% · Other 1.9%
- 2008→2024 swing
- -22.8pp toward R · 2008: -23.5pp · 2024: -46.3pp
- All cycles
- 2024: R+46.3 2020: R+42.6 2016: R+47.8 2012: R+37.1 2008: R+23.5
Not yet ingested
- Civics
- —
Market trends
- HPI YoY
- ▼ -68.01%
- Current HPI
- 157.7355
- Rent YoY
- —
- Metro
- Huntington-Ashland, WV-KY-OH
- State GDP YoY
- —
- F500 in state
- 0
Price history
2 events — show timeline
- 2026-03-23 Pending — KVBOR
- 2026-03-13 Listed $82,500 KVBOR
Property tax history
+3.0%/yrLatest (2025): $307 · +45.6% YoY. Source: county tax records.
Cash-flow waterfall
monthlySold comps — $/sqft
last 12 mo · ≤1 miLoading sold comps…