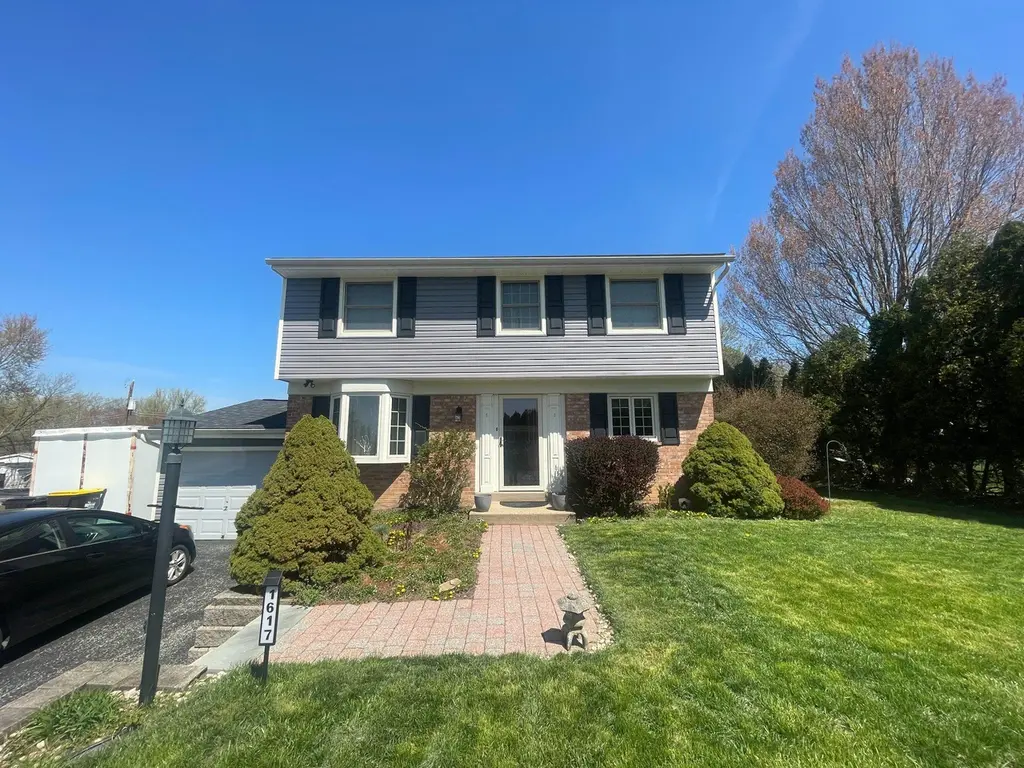
1617 Sylvan Dr · Blue Bell, PA
Flood risk 1/10 · Minimal
- FEMA flood zone
- X (unshaded)
- Chance of flooding over 30 yrs
- 0.0%
- Est. flood insurance / yr
- $473 – $860
Fire risk 1/10 · Minimal
- Est. fire insurance / yr
- $511 – $949
Heat risk 6/10 · Moderate
- Hot days now (above 101°F)
- 7 days/yr
- Hot days in 30 yrs
- 15 days/yr
Wind risk 6/10 · Moderate
- Chance of severe wind over 30 yrs
- 27.0%
Air-quality risk 4/10 · Minor
- Unhealthy air days now
- 5 days/yr
- Unhealthy air days in 30 yrs
- 8 days/yr
Risk factors via First Street. Map © Google.
Why this score? — see what drove the F grade
The composite is a weighted blend of 9 inputs, each scored 0–100. Each bar is that input's sub-score; the figure is the points it added to the 100-point composite (weight × sub-score).
- Cash flow +9.5/30.0
- Schools +6.3/10.0
- ARV discount +5.6/15.0
- Livability +3.6/5.0
- DSCR +2.7/10.0
- Condition / age +2.5/5.0
- 1% rule +2.4/10.0
- Rent growth +2.2/5.0
- Appreciation +0.0/10.0
$499,995
🖨 Deal sheet (PDF) 📄 Offer letter ✓ Due diligence
Listing remarks
Welcome to this move-in ready gem nestled in a well-established neighborhood. This charming 4-bedroom, 1.5-bath home offers the perfect blend of comfort, space, and convenience. Step inside to find a bright and inviting layout with spacious living areas, fresh finishes, and plenty of natural light throughout. The updated kitchen provides ample cabinet and counter space, ideal for both everyday living and entertaining. Upstairs, you’ll find four generously sized bedrooms along with a full bath. Outside, enjoy a spacious yard—perfect for relaxing, gardening, or hosting gatherings. Located with easy access to shopping, dining, parks, and major routes, this home truly checks all the
Key facts
- Spacious yard
- Updated kitchen
- Move in ready
Tags
Neighborhood map
What this means for you Summary
Snapshot
- This is a 5-bed/1.5-bath single-family listed at $500k.
Deal economics
- At list price, monthly cash flow is $-346 ($-4k/yr) — negative.
- To cash-flow at today's rent, offer at most $439k (12.2% below list).
- To meet the 1% rule (rent ≥ 1% of price), the offer needs to be $368k (26.3% below list).
- Recommended offer: $368k (26.3% below list) — sets the bar for 1% rule.
- Cap rate 5.5% vs local median 2.0% in Blue Bell — top-decile yield for the area; either an underpriced asset or a hidden risk that comps aren't pricing in. Stress-test before assuming the spread holds.
Location & tenants
- Location reads 71/100 on livability (#688 in PA) — a middle-class / working-renter tenant base. Strengths: schools A+, crime A+, employment A+; Watch: amenities F, commute F, cost of living F.
- Wissahickon SD (suburban): math 61% / reading 77% proficiency, ranked #18 of 539 in PA (top 3%) — acceptable for families but not a draw, mixed tenant base, ~2y average lease; only 16% free/reduced lunch — higher-income household profile.
- Market conditions: Rents soft (-1.3%/yr); 85 active listings in the ZIP; 1 comparable units currently listed for rent nearby; high-income renter base; 1,936 units permitted in Montgomery County in 2024 (530 in 5+ unit buildings).
Forward outlook
- Local home prices are declining (-3.0%/yr); year-one equity from $3k of loan paydown is wiped out by about $15k of value loss. Plan a longer hold.
- Montgomery County population projected at +5% by 2050 — modest demand growth; plan on rents tracking national, not racing it.
Negotiation context
- Only 2 days on market — expect competitive offers; lowballing is unlikely to land.
- Current owner paid $175k; list at $500k implies a 186% gain — meaningful room to come down on a strong offer.
Risks & watch-outs
- Climate carrying-cost: major wind risk, 27% chance of damaging wind over 30y; extreme-heat days projected 7→15/yr by 2055 (HVAC capex compounding) — expect insurance premiums to compound above CPI over the hold.
Questions for the listing agent
- What do current leases actually rent for vs. the listed asking? Can we see a recent rent roll and the last 12 months of T-12 income?
- Built in 1960 — when were the roof, HVAC, electrical panel, plumbing, and water heater last replaced?
- Is there a deadline driving the sale (1031 exchange, divorce, estate, relocation)? That informs how much negotiation room exists.
- Schools are A-rated — typically a magnet for longer-tenancy family renters. What's the average tenant stay here, and is there a school-zone premium baked into asking?
- The area grade is low — what's the realistic commute time and amenity access for the typical tenant pool here? Any planned neighborhood developments (good or bad) we should know about?
- What's the average days-on-market for RENTAL listings here right now (not sales)? A rising rental-DOM trend means longer vacancies and softer asking-rent achievability than the comps imply.
- What's the recent tenant-quality profile in this submarket — average credit score on applications, eviction rate, late-payment / NSF rate, and stable-employment percentage? A property-management company in the area should have these aggregated.
- How much new for-sale + rental construction is in the pipeline within 1–3 miles? Heavy new supply typically softens prices + rents 12–24 months out; constrained supply supports both.
Investment metrics
- 1% rule
- 0.74% ✗
- Cap rate
- 5.46%
- Cash-on-cash
- -2.96%
- DSCR
- 0.87
- GRM
- 11.3
CMA / ARV
- ARV (on-the-fly)
- $479,460
- Comps found
- 12
Show comp detail 12 sales within ~0.75 mi
| Address | Dist | Beds/Ba | Sqft | Sold | Price | $/sf | Match |
|---|---|---|---|---|---|---|---|
| 1617 Sylvan Dr | 0.00mi | 4/1.5 (-1) | 1,830 (0%) | 1mo | $545,000 | $298 | 94 |
| 1673 Sylvan Dr | 0.13mi | 5/1.5 | 1,830 (0%) | 7mo | $540,500 | $295 | 88 |
| 1662 Woodford Way | 0.16mi | 5/2.5 | 1,830 (0%) | 18mo | $360,000 | $197 | 74 |
| 1526 Pulaski Dr | 0.32mi | 4/2.0 (-1) | 1,850 (+1%) | 10mo | $540,000 | $292 | 67 |
| 1637 Clearview Ave | 0.26mi | 4/2.5 (-1) | 1,872 (+2%) | 14mo | $490,000 | $262 | 63 |
| 1626 Pulaski Dr | 0.21mi | 4/2.0 (-1) | 2,024 (+11%) | 15mo | $508,000 | $251 | 53 |
| 1833 Pulaski Dr | 0.47mi | 4/3.5 (-1) | 1,830 (0%) | 18mo | $625,000 | $342 | 50 |
| 1542 Pulaski Dr | 0.30mi | 4/1.5 (-1) | 1,582 (-14%) | 13mo | $525,000 | $332 | 48 |
| 3018 Swede Rd | 0.62mi | 4/3.0 (-1) | 1,728 (-6%) | 7mo | $415,000 | $240 | 45 |
| 2949 Stoney Crk | 0.71mi | 4/1.5 (-1) | 1,591 (-13%) | 7mo | $402,000 | $253 | 34 |
| 100 Norwood Ln | 0.47mi | 4/3.0 (-1) | 1,561 (-15%) | 11mo | $300,000 | $192 | 33 |
| 3002 Stoney Creek Rd | 0.61mi | 4/2.0 (-1) | 1,600 (-13%) | 15mo | $395,000 | $247 | 31 |
Match score weights: distance 35% · size 25% · config 20% · recency 20%. Top-matched comps best support the ARV.
Projected returns pro-forma
-3.0% appreciation · 0.0% rent growth · sell at horizon
- IRR
- -24.4%
- Equity multiple
- 0.19×
- Total profit
- $-113,911
- Equity at exit
- $74,551
- IRR
- -31.0%
- Equity multiple
- -0.21×
- Total profit
- $-169,553
- Equity at exit
- $43,230
Cash invested: $139,999 (down + closing). Projections, not guarantees.
Landlord ↔ Tenant lean methodology
- Overall (STATE)
- 62 Landlord-Friendly
- State Pennsylvania
- 62 Landlord-Friendly · EVEN
- County
- — inherits STATE
- City
- — inherits STATE
ZIP-level market 19422
- Rents YoY
- -1.3%
- Active inventory
- 85
- Price-to-rent
- 11.3×
Monthly cashflow live
- Estimated rent
- $3,685 medium interval (Pro) →
- Mortgage (P&I)
- −$2,622
- Tax from tax record
- −$426 /mo · $5,115/yr
- Insurance
- −$208
- HOA
- −$0
- Vacancy / Maint / Mgmt
- −$774
- Net cashflow
- $-346
Break-even live
Sensitivity live
| Price | -10% $-63 | -5% $-204 | +0% $-346 | +5% $-487 | +10% $-629 |
|---|---|---|---|---|---|
| Rent | -10% $-637 | -5% $-491 | +0% $-346 | +5% $-200 | +10% $-55 |
| Rate | -1.0pp $-94 | -0.5pp $-219 | base $-346 | +0.5pp $-475 | +1.0pp $-607 |
UW: 25.0% down · 7.5% · 30yr · 1.5% tax · 5.0% vac · 8.0% maint · 8.0% mgmt
Financing live
Cash to close
- Down payment
- $124,999
- Closing costs
- $15,000
- Reserves months
- —
- Total cash needed
- —
Loan-product check · same deal, 3 products live
Conventional
25% down · 7.5% · 30yr
- Down + closing
- —
- Monthly P&I
- —
- Monthly cashflow
- —
- DSCR
- —
- Eligible?
- —
Personal DTI + credit; lowest rate.
DSCR
20% down · 8.5% · 30yr
- Down + closing
- —
- Monthly P&I
- —
- Monthly cashflow
- —
- DSCR
- —
- Eligible?
- —
No personal income docs; deal must DSCR.
Hard money
10% down · 12.0% · 12mo
- Down + closing
- —
- Monthly P&I
- —
- Monthly cashflow
- —
- DSCR
- —
- Eligible?
- —
Short-term bridge; refi at stabilization.
Rent comps 1 comps
| Address | Beds | Baths | Sqft | Rent | $/sqft | DOM | Units | Dist |
|---|---|---|---|---|---|---|---|---|
| 1621 Clearview Ave Blue Bell, PA | 4.0 | 2.5 | 1830 | $4,150 | $2.27 | 2d | 1 | 0.23mi |
Listing history 5 events
-
2026-04-23status Pending
-
2026-04-21$499,995 Active
-
1999-02-05soldstatus $175,000
-
1987-07-22soldstatus $120,000
-
1983-07-29soldstatus $74,500
ⓘ Source: listings_history table (triggers on properties + properties_extension) + one-shot
backfill from property_details.listing_events for pre-trigger history.
Tax reassessment forecast PA · Partial reset (capped growth)
- Current annual tax
- $5,115 · $426/mo
- Projected year-2 tax
- $6,508 · $542/mo
- Expected delta
- +$1,392/yr (+$116/mo · 27.2%)
ⓘ Screening estimate from a state-policy table — verify with the county assessor before closing.
Climate risk First Street
- Flood 1/10 Low FEMA zone X (unshaded) · 0% chance over 30 yrs
- Wildfire 1/10 Low
- Heat 6/10 Major 7 d/yr ≥101°F today · 15 d/yr by 30 yrs out
- Wind 6/10 Major 27% chance of damaging wind over 30 yrs
- Air quality 4/10 Moderate 5 unhealthy d/yr today · 8 by 30 yrs out
Nearby sold comps map
Loading sold comps map…
Walkable amenities ~0.75 mi
Loading nearby amenities…
Taxation est. · year 1
- Rental income
- $44,215
- − Mortgage interest
- −$28,007
- − Property taxes
- −$5,115
- − Insurance
- −$2,500
- − Repairs & maintenance
- −$3,537
- − Management
- −$3,537
- − Depreciation
- −$14,545
- Taxable loss
- −$13,028
- Est. tax savings @ 24.0%
- +$3,127
- After-tax cash flow
- $-1,023/yr
For passive investors: Depreciation is non-cash, so a rental often shows a tax loss while cash-flowing — sheltering income. Rental losses are passive: they offset passive income freely, and up to $25,000/yr can offset ordinary (W-2) income if you actively participate and your MAGI is under $100k (phasing out to $0 by $150k); unused losses carry forward. On sale, claimed depreciation is recaptured at up to 25%, and gains may owe capital-gains tax (a 1031 exchange can defer both). Figures are a year-1 estimate at your 24.0% rate — not tax advice; consult a CPA.
Schools (NCES district)
- District
- Wissahickon SD
- NCES district ID
- 4202400
- Math proficiency
- 61% ▼ -10.00%
- Reading proficiency
- 77% ▼ -7.00%
- Median HH income
- $94,741
- Composite
- 62.75/100
- National rank
- #670
- State rank
- #18 of 539 in PA
Livability — Blue Bell
- Score
- 71/100
- State rank
- #688
- US rank
- #6729
Category grades
Schools grade is shown separately in the Schools card above.
Census & demographics
- County
- Montgomery County · 712,331 people
- City population
- 20,412
- Metro
- Philadelphia-Camden-Wilmington, PA-NJ-DE-MD
- Population (ZIP)
- 20,412
- Household income
- $158,288
- Rent vs Own
- Severe rent burden
- 400.0
Population outlook (Montgomery County) Hauer SSP2
- Today (2025)
- 856,074 people
- By 2030
- 870,887 · +1.7%
- By 2040
- 891,195 · +4.1%
- By 2050
- 896,417 · +4.7%
- By 2075
- 903,212 · +5.5%
- By 2100
- 843,240 · -1.5%
Race, ethnicity, and origin ACS 2023
- Neighborhood character
- Predominantly White (71%)
- Race & ethnicity
- White 71% Asian 12% Black 10% Two or more races 5% Hispanic / Latino 4%
- Common ancestry
- Romanian 4% Slovak 3% Scotch-Irish 2%
- Foreign-born
- 12% · South Korea, China, Canada
- Languages at home
- 85% English-only · Korean 4% Other Indo-European 3% Chinese 2%
Political lean MEDSL · Montgomery
- 2024 margin
- Strong D (+22.8) · D 60.9% · R 38.1% · Other 1.1%
- 2008→2024 swing
- +2.0pp toward D · 2008: 20.8pp · 2024: 22.8pp
- All cycles
- 2024: D+22.8 2020: D+26.3 2016: D+21.1 2012: D+14.3 2008: D+20.8
Not yet ingested
- Civics
- —
Market trends
- HPI YoY
- ▼ -264.70%
- Current HPI
- 274.5661
- Rent YoY
- ▼ -1.29%
- Metro
- Philadelphia-Camden-Wilmington, PA-NJ-DE-MD
- State GDP YoY
- ▲ 1.68%
- F500 in state
- 34
Industry mix (Fortune 500 HQ in PA)
| Industry | F500 HQs | Revenue |
|---|---|---|
| Healthcare | 2 | $309B |
|
||
| Insurance | 2 | $27B |
|
||
| Telecommunications / Media | 1 | $124B |
|
||
| Industrial Distribution | 1 | $22B |
|
||
| Financial Services | 1 | $20B |
|
||
| Chemicals / Materials | 1 | $18B |
|
||
Price history
+571.1% since first listed5 events — show timeline
- 2026-04-23 Pending — BRIGHT MLS
- 2026-04-21 Listed $499,995 BRIGHT MLS
- 1999-02-05 Sold (Public Records) $175,000 Public Records
- 1987-07-22 Sold (Public Records) $120,000 Public Records
- 1983-07-29 Sold (Public Records) $74,500 Public Records
Property tax history
+2.7%/yrLatest (2026): $5,115 · +4.8% YoY. Source: county tax records.
Cash-flow waterfall
monthlySold comps — $/sqft
last 12 mo · ≤1 miLoading sold comps…