 Duplex
2234 W Memorial Dr · Muncie, IN
Flood risk 1/10 · Minimal
- FEMA flood zone
- X (shaded)
- Chance of flooding over 30 yrs
- 0.0%
- Est. flood insurance / yr
- $507 – $1,088
Fire risk 1/10 · Minimal
- Est. fire insurance / yr
- $717 – $1,331
Heat risk 3/10 · Minor
- Hot days now (above 100°F)
- 7 days/yr
- Hot days in 30 yrs
- 18 days/yr
Wind risk 2/10 · Minimal
- Chance of severe wind over 30 yrs
- 0.0%
Air-quality risk 3/10 · Minor
- Unhealthy air days now
- 2 days/yr
- Unhealthy air days in 30 yrs
- 3 days/yr
Risk factors via First Street. Map © Google.
Why this score? — see what drove the C grade
The composite is a weighted blend of 9 inputs, each scored 0–100. Each bar is that input's sub-score; the figure is the points it added to the 100-point composite (weight × sub-score).
- Cash flow +25.0/30.0
- DSCR +8.2/10.0
- ARV discount +7.5/15.0
- 1% rule +5.5/10.0
- Rent growth +4.0/5.0
- Livability +4.0/5.0
- Condition / age +2.5/5.0
- Schools +1.7/10.0
- Appreciation +0.0/10.0
$239,900
🖨 Deal sheet 📄 Offer letter ✓ Due diligence
Multi-family units
County records classify this as Multi-Family (5+ Unit). Listing-text estimate: 2 units. estimate disagrees with records
5+ unit building — per-unit beds/baths from public records are typically unavailable; the breakdown below (if shown) is an estimate from the listing text.
Listing remarks MLS
4 units, 2 units each bldg 2 lots 2200 memorial Dr. sold as is. Long tern tenants. Gross monthly rent $2150 all currently month to month. 3 electric meters, 4 gas meters and 2 water meters.
Key facts
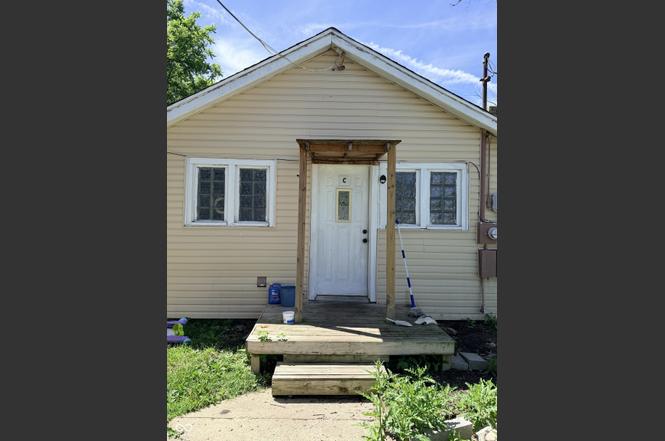
- Renovated bathroom
- New siding
- Brand new roof
Tags
Property features AI
Finance
- Other: Current use: Apartments (fewer than 20 units); Lot size approximately 0.34 acre
- Financial info: Four total rental units; Gross income approximately $40,620; Net operating income approximately $31,888; Operating expenses approximately $8,732; Typical monthly rents shown: $750, $745, $945, $945
Exterior
- Security: Smoke detector(s)
- Utilities: Solid waste service available; Owner pays gas, water, sewer and trash collection
- Home design: Residential income property (quadruplex)
- Exterior features: Low-maintenance property; Access road to the lot
Interior
- Kitchen: Unit kitchens (sizes vary: approximately 10x10 and 8x8)
- Bedrooms: Three 2-bedroom units; One 1-bedroom unit
- Interior features: Smoke detectors installed
Neighborhood map
What this means for you Summary
Snapshot
- This is a 2 × 4-bed/2.0-bath units multifamily listed at $240k.
Deal economics
- At list price, monthly cash flow is $524 ($6k/yr) — positive. Per door: $262/mo.
- The deal already cash-flows at list — no discount required.
- Meets the 1% rule at list price ($3k rent vs $240k).
- Cap rate 8.9% vs local median 6.0% in Muncie — top-decile yield for the area; either an underpriced asset or a hidden risk that comps aren't pricing in. Stress-test before assuming the spread holds.
Location & tenants
- Location reads 80/100 on livability (#18 in IN, #1,654 nationally) — a professional / high-income tenant draw. Strengths: amenities A+, commute A+, cost of living A+; Watch: schools D+, crime F, employment F.
- Muncie Community Schools (urban): math 18% / reading 25% proficiency, ranked #275 of 301 in IN (top 91%) — low school quality limits family demand, transient renter base, plan for 1-2y turnover; 68% free/reduced lunch — lower-income household profile, screen leases tightly.
- Market conditions: Rents rising fast (+6.1%/yr); 148 active listings in the ZIP; 6 comparable units currently listed for rent nearby; rentals lingering (median 44d on market — plan ~5-8 weeks vacancy on turnover, expect pricing pressure); 100% of comp listings sitting > 30 days — soft ceiling on asking rent; 171 units permitted in Delaware County in 2024 (57 in 5+ unit buildings).
- At $2,525/mo this rent would consume 63% of the median local household income ($48k/yr) (locally 1150% of renters already pay >50% of income on rent) — very limited rent-growth headroom before tenants either downsize or default.
Forward outlook
- Local home prices are declining (-3.0%/yr); year-one equity from $2k of loan paydown is wiped out by about $7k of value loss. Plan a longer hold.
- Delaware County population projected at -11% by 2050 — secular population decline; favor cash flow + early exit over multi-decade hold.
- At projected returns (-3.0% appreciation + 6.1% rent growth), your $67k cash investment doubles in ~9 years — after that, you're playing with house money.
Negotiation context
- Only 4 days on market — expect competitive offers; lowballing is unlikely to land.
- 2 sale attempts since 5y ago with the ask held roughly flat each time — persistent listings suggest the price (not the market) is what's stuck; bring a comps-based counter.
- Current owner paid $60k; list at $240k implies a 300% gain — meaningful room to come down on a strong offer.
Risks & watch-outs
- Watch-outs: built in 1941 — expect roof / HVAC / electrical / plumbing capex.
Questions for the listing agent
- Can we see the unit-by-unit rent roll, current vacancy, and any below-market leases? What's the average tenancy length?
- What capital expenditures (roof, boiler, parking lot, exteriors) have been made in the last 5 years, and what's planned in the next 2?
- Built in 1941 — when were the roof, HVAC, electrical panel, plumbing, and water heater last replaced?
- Is there a deadline driving the sale (1031 exchange, divorce, estate, relocation)? That informs how much negotiation room exists.
- Schools are D-rated, which usually means shorter tenancies and higher turnover. Who's the typical renter profile here, and what's been the actual vacancy rate?
- Crime grade is F in this area — have there been break-ins, vandalism, or insurance claims at this property in the last 3 years? What carrier currently insures it and at what premium?
- What's the average days-on-market for RENTAL listings here right now (not sales)? A rising rental-DOM trend means longer vacancies and softer asking-rent achievability than the comps imply.
- What's the recent tenant-quality profile in this submarket — average credit score on applications, eviction rate, late-payment / NSF rate, and stable-employment percentage? A property-management company in the area should have these aggregated.
- How much new apartment / multifamily construction is in the pipeline within 1–3 miles? Heavy new supply (>2% of stock underway) typically softens rents 12–24 months out; light construction supports rent growth.
Investment metrics
- 1% rule
- 1.05% ✓
- Cap rate
- 8.92%
- Cash-on-cash
- 9.37%
- DSCR
- 1.42
- GRM
- 7.9
CMA / ARV
- ARV (on-the-fly)
- $144,606
- Comps found
- 1
Show comp detail 1 sale within ~0.75 mi
| Address | Dist | Beds/Ba | Sqft | Sold | Price | $/sf | Match |
|---|---|---|---|---|---|---|---|
| 1421-1423 S Perkins Ave | 0.54mi | 4/2.0 (+1) | 1,630 (-13%) | 10mo | $125,000 | $77 | 40 |
Match score weights: distance 35% · size 25% · config 20% · recency 20%. Top-matched comps best support the ARV.
Projected returns pro-forma
-3.0% appreciation · 6.11% rent growth · sell at horizon
- IRR
- 1.0%
- Equity multiple
- 1.04×
- Total profit
- $2,595
- Equity at exit
- $35,770
- IRR
- 13.3%
- Equity multiple
- 2.20×
- Total profit
- $80,591
- Equity at exit
- $20,742
Cash invested: $67,172 (down + closing). Projections, not guarantees.
Landlord ↔ Tenant lean methodology
- Overall (STATE)
- 90 Strongly Landlord-Friendly
- State Indiana
- 90 Strongly Landlord-Friendly · R+11
- County
- — inherits STATE
- City
- — inherits STATE
ZIP-level market 47302
- Home prices YoY
- -12.6%
- Rents YoY
- 6.1%
- Active inventory
- 148
- Price-to-rent
- 15.8×
Monthly cashflow live
- Estimated rent
- $2,525 high interval (Pro) →
- Mortgage (P&I)
- −$1,258
- Tax from tax record
- −$112 /mo · $1,348/yr
- Insurance
- −$100
- HOA
- −$0
- Vacancy / Maint / Mgmt
- −$530
- Net cashflow
- $524
Break-even live
2-unit breakdown (identical units grouped — click to expand)
| Units | Beds | Baths | Est. rent |
|---|---|---|---|
| 2× units | 4 | 2 | $2,526 |
| #1 | 4 | 2 | $1,263 |
| #2 | 4 | 2 | $1,263 |
| Total (2 units) | $2,525 | ||
UW: 25.0% down · 7.5% · 30yr · 1.5% tax · 5.0% vac · 8.0% maint · 8.0% mgmt
Financing live
Cash to close
- Down payment
- $59,975
- Closing costs
- $7,197
- Reserves months
- —
- Total cash needed
- —
Loan-product check · same deal, 3 products live
Conventional
25% down · 7.5% · 30yr
- Down + closing
- —
- Monthly P&I
- —
- Monthly cashflow
- —
- DSCR
- —
- Eligible?
- —
Personal DTI + credit; lowest rate.
DSCR
20% down · 8.5% · 30yr
- Down + closing
- —
- Monthly P&I
- —
- Monthly cashflow
- —
- DSCR
- —
- Eligible?
- —
No personal income docs; deal must DSCR.
Hard money
10% down · 12.0% · 12mo
- Down + closing
- —
- Monthly P&I
- —
- Monthly cashflow
- —
- DSCR
- —
- Eligible?
- —
Short-term bridge; refi at stabilization.
Rent comps 6 comps
| Address | Beds | Baths | Sqft | Rent | $/sqft | DOM | Units | Dist |
|---|---|---|---|---|---|---|---|---|
| 2112 W 11th St Muncie, IN | 3.0 | 2.0 | 1646 | $1,000 | $0.61 | 43d | 1 | 0.13mi |
| 328 S Talley Ave Muncie, IN | 2.0 | 1.0 | 1770 | $1,400 | $0.79 | 43d | 1 | 0.89mi |
| 312 S Calvert St Muncie, IN | 3.0 | 1.0 | 1813 | $1,500 | $0.83 | 43d | 1 | 0.94mi |
| 623 W 9th St Muncie, IN | 3.0 | 1.0 | 1574 | $1,499 | $0.95 | 43d | 1 | 1.07mi |
| 605 W 10th St Muncie, IN | 3.0 | 1.0 | 1688 | $1,150 | $0.68 | 43d | 1 | 1.09mi |
| 412 W Howard St Muncie, IN | 3.0 | 1.0 | 1300 | $1,000 | $0.77 | 43d | 1 | 1.43mi |
Listing history 5 events
-
2026-06-19days on market $239,900 Active 4 DOM
-
2026-06-18days on market $239,900 Active 3 DOM
-
2026-06-17days on market $239,900 Active 2 DOM
-
2026-06-15remarks 578-char remark
-
2026-06-15$239,900 Active 1 DOM
ⓘ Source: listings_history table (triggers on properties + properties_extension) + one-shot
backfill from property_details.listing_events for pre-trigger history.
Tax reassessment forecast IN · Partial reset (capped growth)
- Current annual tax
- $1,348 · $112/mo
- Projected year-2 tax
- $1,694 · $141/mo
- Expected delta
- +$346/yr (+$29/mo · 25.6%)
ⓘ Screening estimate from a state-policy table — verify with the county assessor before closing.
Climate risk First Street
- Flood 1/10 Low FEMA zone X (shaded) · 0% chance over 30 yrs
- Wildfire 1/10 Low
- Heat 3/10 Moderate 7 d/yr ≥100°F today · 18 d/yr by 30 yrs out
- Wind 2/10 Low 0% chance of damaging wind over 30 yrs
- Air quality 3/10 Moderate 2 unhealthy d/yr today · 3 by 30 yrs out
Nearby sold comps map
Loading sold comps map…
Walkable amenities ~0.75 mi
Loading nearby amenities…
Taxation est. · year 1
- Rental income
- $30,300
- − Mortgage interest
- −$13,438
- − Property taxes
- −$1,348
- − Insurance
- −$1,200
- − Repairs & maintenance
- −$2,424
- − Management
- −$2,424
- − Depreciation
- −$6,979
- Taxable income
- $2,487
- Est. tax owed @ 24.0%
- −$597
- After-tax cash flow
- $5,696/yr
For passive investors: Depreciation is non-cash, so a rental often shows a tax loss while cash-flowing — sheltering income. Rental losses are passive: they offset passive income freely, and up to $25,000/yr can offset ordinary (W-2) income if you actively participate and your MAGI is under $100k (phasing out to $0 by $150k); unused losses carry forward. On sale, claimed depreciation is recaptured at up to 25%, and gains may owe capital-gains tax (a 1031 exchange can defer both). Figures are a year-1 estimate at your 24.0% rate — not tax advice; consult a CPA.
Schools (NCES district)
- District
- Muncie Community Schools
- NCES district ID
- 1807320
- Math proficiency
- 18% ▼ -9.00%
- Reading proficiency
- 25% ▼ -4.00%
- Median HH income
- $30,052
- Composite
- 17.22/100
- National rank
- #9099
- State rank
- #275 of 301 in IN
Livability — Muncie
- Score
- 80/100
- State rank
- #18
- US rank
- #1654
Category grades
Schools grade is shown separately in the Schools card above.
Census & demographics
- Census place
- Muncie, IN
- County
- Delaware County · 84,658 people
- City population
- 84,658
- Metro
- Muncie, IN
- Population (ZIP)
- 25,473
- Household income
- $47,837
- Rent vs Own
- Severe rent burden
- 1150.0
Population outlook (Delaware County) Hauer SSP2
- Today (2025)
- 113,036 people
- By 2030
- 111,313 · -1.5%
- By 2040
- 106,432 · -5.8%
- By 2050
- 100,747 · -10.9%
- By 2075
- 91,000 · -19.5%
- By 2100
- 80,687 · -28.6%
Race, ethnicity, and origin ACS 2023
- Neighborhood character
- Predominantly White (84%)
- Race & ethnicity
- White 84% Two or more races 6% Black 6% Hispanic / Latino 4%
- Common ancestry
- Italian 2% Slovak 1% Romanian 1%
- Foreign-born
- 1% · Canada
- Languages at home
- 98% English-only · Spanish 1% German/W. Germanic 1%
Political lean MEDSL · Delaware
- 2024 margin
- R (+15.8) · D 41.2% · R 57.0% · Other 1.8%
- 2008→2024 swing
- -30.8pp toward R · 2008: 15.0pp · 2024: -15.8pp
- All cycles
- 2024: R+15.8 2020: R+13.2 2016: R+13.7 2012: D+3.1 2008: D+15.0
Not yet ingested
- Civics
- —
Market trends
- HPI YoY
- ▼ -30.32%
- Current HPI
- 210.431
- Rent YoY
- ▲ 6.11%
- Metro
- Muncie, IN
- State GDP YoY
- ▲ 2.90%
- F500 in state
- 18
Industry mix (Fortune 500 HQ in IN)
| Industry | F500 HQs | Revenue |
|---|---|---|
| Industrial Machinery | 2 | $37B |
|
||
| Healthcare | 1 | $177B |
|
||
| Pharmaceuticals | 1 | $45B |
|
||
| Metals / Steel | 1 | $18B |
|
||
| Agriculture | 1 | $17B |
|
||
| Packaging | 1 | $12B |
|
||
Price history
+283.8% since first listed3 events — show timeline
- 2026-06-13 Listed $239,900 MIBOR as Distributed by MLS Grid
- 2021-04-08 Sold (MLS) $60,000 MIBOR as Distributed by MLS Grid
- 2021-03-15 Listed $62,500 MIBOR as Distributed by MLS Grid
Property tax history
-7.8%/yrLatest (2024): $1,348 · +0.0% YoY. Source: county tax records.
Cash-flow waterfall
monthlySold comps — $/sqft
last 12 mo · ≤1 miLoading sold comps…