610 Davis St #2607 · Austin, TX
Flood risk No data
- FEMA flood zone
- —
- Chance of flooding over 30 yrs
- —
- Est. flood insurance / yr
- —
Fire risk No data
- Est. fire insurance / yr
- —
Heat risk No data
- Hot days now (above threshold)
- —
- Hot days in 30 yrs
- —
Wind risk No data
- Chance of severe wind over 30 yrs
- —
Air-quality risk No data
- Unhealthy air days now
- —
- Unhealthy air days in 30 yrs
- —
Risk factors via First Street. Map © Google.
Why this score? — see what drove the D- grade
The composite is a weighted blend of 9 inputs, each scored 0–100. Each bar is that input's sub-score; the figure is the points it added to the 100-point composite (weight × sub-score).
- ARV discount +15.0/15.0
- Appreciation +4.8/10.0
- Livability +4.1/5.0
- Cash flow +3.7/30.0
- Schools +3.4/10.0
- Rent growth +3.1/5.0
- Condition / age +2.5/5.0
- 1% rule +1.5/10.0
- DSCR +0.0/10.0
$416,000
🖨 Deal sheet (PDF) 📄 Offer letter ✓ Due diligence
Listing remarks MLS
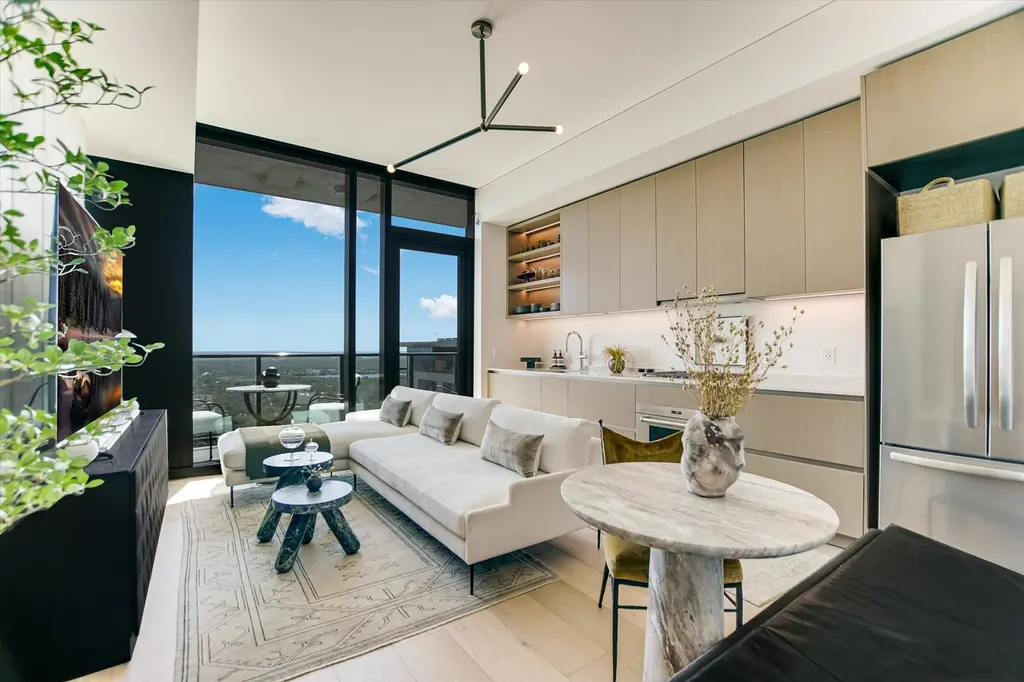
Experience elevated downtown living at The Modern Austin Residences, Austin’s newest premier luxury tower. This 1-bedroom, 1-bath home features 10’4” ceilings, floor-to-ceiling windows, quartz countertops, and a top-of-the-line Wolf range and cooktop. Enjoy beautiful views of Lady Bird Lake from the private balcony and unwind in the spa-inspired bathroom with a walk-in shower and designer finishes. Residents enjoy over 19,000 sq. ft. of luxury amenities, including a lap pool, fitness center, yoga studio, sky lounge, co-working spaces, and 24/7 concierge service.
Key facts
- Designer finishes
- Private balcony
- Walk-in shower
Tags
Neighborhood map
What this means for you Summary
Snapshot
- This is a 1-bed/1.0-bath condo listed at $416k.
Deal economics
- At list price, monthly cash flow is $-1k ($-15k/yr) — negative.
- To cash-flow at today's rent, offer at most $240k (42.3% below list).
- To meet the 1% rule (rent ≥ 1% of price), the offer needs to be $270k (35.0% below list).
- Recommended offer: $240k (42.3% below list) — sets the bar for cash-flow.
- Cap rate 2.8% vs local median 1.8% in Austin — top-decile yield for the area; either an underpriced asset or a hidden risk that comps aren't pricing in. Stress-test before assuming the spread holds.
Location & tenants
- Location reads 82/100 on livability (#16 in TX, #1,208 nationally) — a professional / high-income tenant draw. Strengths: amenities A+, commute A+, employment A+; Watch: cost of living D, crime F.
- Austin ISD (urban): math 33% / reading 44% proficiency, ranked #431 of 826 in TX (top 52%) — families likely to look elsewhere, expect single-tenant / working-renter base with shorter leases.
- Market conditions: Rents rising (+2.5%/yr); 301 active listings in the ZIP; 40 comparable units currently listed for rent nearby; rentals at typical pace (median 25d on market — plan ~3-4 weeks tenant-placement turnaround); 45% of comp listings sitting > 30 days — soft ceiling on asking rent; high-income renter base; 17,121 units permitted in Travis County in 2024 (11,963 in 5+ unit buildings).
Forward outlook
- In year one you build about $977 of equity ($3k loan paydown + $-2k appreciation (-0.5% local appreciation)).
- Travis County population projected at +60% by 2050 — long-run rental-demand tailwind backs the buy-and-hold thesis.
Negotiation context
- It's been on market 233 days — a 12% lower offer ($366k) is reasonable based on typical stale-listing flexibility.
Questions for the listing agent
- What do current leases actually rent for vs. the listed asking? Can we see a recent rent roll and the last 12 months of T-12 income?
- It's been on market 233 days. Have you received any prior offers? Is the seller open to a 42% concession, seller financing, or rate buy-down credit?
- What does the HOA fee cover, when was the last increase, and are there any pending special assessments or reserve-fund shortfalls?
- Any open or pending special assessments — roof, HVAC, plumbing, elevator, façade? What's the per-unit balance and payoff schedule, and is the seller paying it off at close or rolling it to the buyer?
- Why hasn't it sold? Are there any deal-killer items the seller is aware of (foundation, flood, title, zoning, code violations)?
- Is there a deadline driving the sale (1031 exchange, divorce, estate, relocation)? That informs how much negotiation room exists.
- Crime grade is F in this area — have there been break-ins, vandalism, or insurance claims at this property in the last 3 years? What carrier currently insures it and at what premium?
- The area grade is low — what's the realistic commute time and amenity access for the typical tenant pool here? Any planned neighborhood developments (good or bad) we should know about?
- What's the average days-on-market for RENTAL listings here right now (not sales)? A rising rental-DOM trend means longer vacancies and softer asking-rent achievability than the comps imply.
- What's the recent tenant-quality profile in this submarket — average credit score on applications, eviction rate, late-payment / NSF rate, and stable-employment percentage? A property-management company in the area should have these aggregated.
- How much new apartment / multifamily construction is in the pipeline within 1–3 miles? Heavy new supply (>2% of stock underway) typically softens rents 12–24 months out; light construction supports rent growth.
Investment metrics
- 1% rule
- 0.65% ✗
- Cap rate
- 2.78%
- Cash-on-cash
- -12.54%
- DSCR
- 0.44
- GRM
- 12.8
CMA / ARV
- ARV (median comp)
- $509,015
- List price
- $416,000
- Delta
- -18.27%
- Verdict
- UNDERPRICED
- Comps
- 20 within 1.0 mi
Projected returns pro-forma
-0.46% appreciation · 2.54% rent growth · sell at horizon
- IRR
- -19.3%
- Equity multiple
- 0.15×
- Total profit
- $-99,466
- Equity at exit
- $111,383
- IRR
- -13.0%
- Equity multiple
- -0.25×
- Total profit
- $-145,377
- Equity at exit
- $126,591
Cash invested: $116,480 (down + closing). Projections, not guarantees.
Landlord ↔ Tenant lean methodology
- Overall (STATE)
- 87 Strongly Landlord-Friendly
- State Texas
- 87 Strongly Landlord-Friendly · R+5
- County
- — inherits STATE
- City
- — inherits STATE
ZIP-level market 78701
- Home prices YoY
- -0.2%
- Rents YoY
- 2.5%
- Active inventory
- 301
- Price-to-rent
- 12.8×
Monthly cashflow live
- Estimated rent
- $2,703 high interval (Pro) →
- Mortgage (P&I)
- −$2,182
- Tax est. 1.5%
- −$520 /mo · $6,240/yr
- Insurance
- −$173
- HOA
- −$478
- Vacancy / Maint / Mgmt
- −$568
- Net cashflow
- $-1,217
Break-even live
Sensitivity live
| Price | -10% $-930 | -5% $-1,074 | +0% $-1,217 | +5% $-1,361 | +10% $-1,505 |
|---|---|---|---|---|---|
| Rent | -10% $-1,431 | -5% $-1,324 | +0% $-1,217 | +5% $-1,111 | +10% $-1,004 |
| Rate | -1.0pp $-1,008 | -0.5pp $-1,112 | base $-1,217 | +0.5pp $-1,325 | +1.0pp $-1,435 |
UW: 25.0% down · 7.5% · 30yr · 1.5% tax · 5.0% vac · 8.0% maint · 8.0% mgmt
Financing live
Cash to close
- Down payment
- $104,000
- Closing costs
- $12,480
- Reserves months
- —
- Total cash needed
- —
Loan-product check · same deal, 3 products live
Conventional
25% down · 7.5% · 30yr
- Down + closing
- —
- Monthly P&I
- —
- Monthly cashflow
- —
- DSCR
- —
- Eligible?
- —
Personal DTI + credit; lowest rate.
DSCR
20% down · 8.5% · 30yr
- Down + closing
- —
- Monthly P&I
- —
- Monthly cashflow
- —
- DSCR
- —
- Eligible?
- —
No personal income docs; deal must DSCR.
Hard money
10% down · 12.0% · 12mo
- Down + closing
- —
- Monthly P&I
- —
- Monthly cashflow
- —
- DSCR
- —
- Eligible?
- —
Short-term bridge; refi at stabilization.
Rent comps 40 comps
| Address | Beds | Baths | Sqft | Rent | $/sqft | DOM | Units | Dist |
|---|---|---|---|---|---|---|---|---|
| 91 Red River St Austin, TX | 3.0 | 1.0–2.0 | 1317 | $3,550 | $2.69 | 0d | 17 | 0.03mi |
| 610 Davis St Unit 1809 Austin, TX | 1.0 | 1.0 | 660 | $2,750 | $4.17 | 25d | 1 | 0.04mi |
| 610 Davis St Unit 2909 Austin, TX | 1.0 | 1.0 | 662 | $3,100 | $4.68 | 45d | 1 | 0.04mi |
| 610 Davis St Austin, TX | 1.0 | 1.0 | 613 | $3,000 | $4.89 | 45d | 1 | 0.04mi |
| 610 Davis St Unit 5206 Austin, TX | 1.0 | 1.0 | 662 | $3,500 | $5.29 | 45d | 1 | 0.04mi |
| 80 Rainey St Unit 3517 Austin, TX | — | 1.0 | 421 | $2,000 | $4.75 | 6d | 1 | 0.04mi |
| 80 Rainey St Austin, TX | 3.0 | 1.0–3.5 | 1205 | $17,048 | $14.15 | 0d | 106 | 0.05mi |
| 91 Red River St Unit 133 Austin, TX | 1.0 | 1.0 | 415 | $2,075 | $5.00 | 45d | 1 | 0.06mi |
| 91 Red River St Unit 106 Austin, TX | 1.0 | 1.0 | 749 | $2,524 | $3.37 | 45d | 1 | 0.06mi |
| 84 N Interstate 35 #2302 Austin, TX | 1.0 | 1.0 | 697 | $3,035 | $4.35 | 16d | 1 | 0.08mi |
| 84 N Interstate 35 #2508 Austin, TX | 1.0 | 1.0 | 667 | $2,525 | $3.79 | 45d | 1 | 0.08mi |
| 84 N Interstate 35 #2102 Austin, TX | 1.0 | 1.0 | 697 | $2,700 | $3.87 | 21d | 1 | 0.08mi |
| 84 N Interstate 35 #3707 Austin, TX | 1.0 | 1.0 | 727 | $2,950 | $4.06 | 6d | 1 | 0.08mi |
| 84 N Interstate 35 #2708 Austin, TX | 1.0 | 1.0 | 667 | $2,900 | $4.35 | 45d | 1 | 0.08mi |
| 84 N Interstate 35 #2807 Austin, TX | 1.0 | 1.0 | 697 | $2,550 | $3.66 | 45d | 1 | 0.08mi |
| 700 River St Austin, TX | 1.0–3.0 | 1.0–3.5 | 1708 | $3,504 | $2.05 | 0d | 69 | 0.14mi |
| 55 Rainey St Unit 703 Austin, TX | 1.0 | 1.0 | 679 | $2,490 | $3.67 | 45d | 1 | 0.19mi |
| 51 Rainey St Austin, TX | 1.0 | 1.0 | 729 | $2,845 | $3.90 | 45d | 1 | 0.20mi |
| 51 Rainey St Unit 93 Austin, TX | 1.0 | 1.0 | 618 | $2,214 | $3.58 | 0d | 1 | 0.21mi |
| 51 Rainey St Unit 66 Austin, TX | 1.0 | 1.0 | 679 | $2,435 | $3.59 | 16d | 1 | 0.21mi |
| 51 Rainey St Unit 66 Austin, TX | 1.0 | 1.0 | 655 | $2,099 | $3.20 | 0d | 1 | 0.21mi |
| 51 Rainey St Austin, TX | 1.0 | 1.0 | 692 | $2,472 | $3.57 | 14d | 2 | 0.21mi |
| 47 Rainey St Unit 01F2 Austin, TX | — | 1.0 | 584 | $1,931 | $3.31 | 45d | 1 | 0.24mi |
| 47 Rainey St Unit 11F4 Austin, TX | 1.0 | 1.0 | 729 | $1,832 | $2.51 | 45d | 1 | 0.24mi |
| 48 East Ave Unit 1013569P Austin, TX | 1.0 | 1.0 | 667 | $3,850 | $5.77 | 45d | 1 | 0.24mi |
| 48 East Ave Austin, TX | 1.0 | 1.0 | 725 | $3,352 | $4.62 | 0d | 2 | 0.24mi |
| 44 East Ave #1502 Austin, TX | 1.0 | 1.0 | 632 | $2,999 | $4.75 | 6d | 1 | 0.28mi |
| 44 East Ave #3111 Austin, TX | 1.0 | 1.0 | 707 | $3,500 | $4.95 | 6d | 1 | 0.28mi |
| 43 Rainey St Austin, TX | 1.0–3.0 | 1.0–2.5 | 1745 | $1,915 | $1.10 | 0d | 15 | 0.28mi |
| 44 East Ave #3004 Austin, TX | 1.0 | 1.0 | 615 | $3,450 | $5.61 | 45d | 1 | 0.29mi |
| 44 East Ave #3104 Austin, TX | 1.0 | 1.0 | 614 | $3,500 | $5.70 | 25d | 1 | 0.29mi |
| 44 East Ave #2404 Austin, TX | 1.0 | 1.0 | 615 | $3,500 | $5.69 | 45d | 1 | 0.29mi |
| 44 East Ave #1402 Austin, TX | 1.0 | 1.0 | 632 | $2,800 | $4.43 | 25d | 1 | 0.29mi |
| 44 East Ave #2606 Austin, TX | — | 1.0 | 538 | $2,250 | $4.18 | 19d | 1 | 0.29mi |
| 405 Red River St Austin, TX | 1.0 | 1.0 | 639 | $2,788 | $4.36 | 45d | 1 | 0.34mi |
| 301 E 4th St Austin, TX | 1.0–3.0 | 1.0–2.0 | 837 | $1,591 | $1.90 | 0d | 4 | 0.37mi |
| 301 E 4th St Austin, TX | 1.0–3.0 | 1.0–2.0 | 837 | $1,622 | $1.94 | 45d | 4 | 0.37mi |
| 1013 E 3rd St Unit B Austin, TX | 1.0 | 1.0 | 650 | $1,200 | $1.85 | 45d | 1 | 0.37mi |
| 222 E Riverside Dr Unit 237 Austin, TX | 1.0 | 1.0 | 523 | $1,405 | $2.69 | 0d | 1 | 0.37mi |
| 222 E Riverside Dr Unit 237 Austin, TX | 1.0 | 1.0 | 523 | $1,399 | $2.67 | 16d | 1 | 0.37mi |
HOA detail condo
- Monthly dues
- $478 · $5,736/yr
- Likely covers
- poolgymdoorman
- Assessments
- None detected in remarks — confirm with the listing agent.
Listing history 19 events
-
2026-06-21days on market $416,000 Active 233 DOM
-
2026-06-18days on market $416,000 Active 230 DOM
-
2026-06-17days on market $416,000 Active 229 DOM
-
2026-06-16days on market $416,000 Active 228 DOM
-
2026-06-15days on market $416,000 Active 227 DOM
-
2026-06-13days on market $416,000 Active 225 DOM
-
2026-06-09days on market $416,000 Active 221 DOM
-
2026-06-08days on market $416,000 Active 220 DOM
-
2026-06-07days on market $416,000 Active 219 DOM
-
2026-06-05days on market $416,000 Active 216 DOM
-
2026-06-03days on market $416,000 Active 215 DOM
-
2026-06-02days on market $416,000 Active 214 DOM
-
2026-06-01days on market $416,000 Active 213 DOM
-
2026-05-31days on market $416,000 Active 212 DOM
-
2026-03-13price $416,000 586-char remark
Show marketing remark (586 chars)
Experience elevated downtown living at The Modern Austin Residences, Austin’s newest premier luxury tower. This 1-bedroom, 1-bath home features 10’4” ceilings, floor-to-ceiling windows, quartz countertops, and a top-of-the-line Wolf range and cooktop. Enjoy beautiful views of Lady Bird Lake from the private balcony and unwind in the spa-inspired bathroom with a walk-in shower and designer finishes. Residents enjoy over 19,000 sq. ft. of luxury amenities, including a lap pool, fitness center, yoga studio, sky lounge, co-working spaces, and 24/7 concierge service.
-
2026-01-20price $396,200 586-char remark
Show marketing remark (586 chars)
Experience elevated downtown living at The Modern Austin Residences, Austin’s newest premier luxury tower. This 1-bedroom, 1-bath home features 10’4” ceilings, floor-to-ceiling windows, quartz countertops, and a top-of-the-line Wolf range and cooktop. Enjoy beautiful views of Lady Bird Lake from the private balcony and unwind in the spa-inspired bathroom with a walk-in shower and designer finishes. Residents enjoy over 19,000 sq. ft. of luxury amenities, including a lap pool, fitness center, yoga studio, sky lounge, co-working spaces, and 24/7 concierge service.
-
2026-01-10price $416,010 586-char remark
Show marketing remark (586 chars)
Experience elevated downtown living at The Modern Austin Residences, Austin’s newest premier luxury tower. This 1-bedroom, 1-bath home features 10’4” ceilings, floor-to-ceiling windows, quartz countertops, and a top-of-the-line Wolf range and cooktop. Enjoy beautiful views of Lady Bird Lake from the private balcony and unwind in the spa-inspired bathroom with a walk-in shower and designer finishes. Residents enjoy over 19,000 sq. ft. of luxury amenities, including a lap pool, fitness center, yoga studio, sky lounge, co-working spaces, and 24/7 concierge service.
-
2025-12-18price $396,200 586-char remark
Show marketing remark (586 chars)
Experience elevated downtown living at The Modern Austin Residences, Austin’s newest premier luxury tower. This 1-bedroom, 1-bath home features 10’4” ceilings, floor-to-ceiling windows, quartz countertops, and a top-of-the-line Wolf range and cooktop. Enjoy beautiful views of Lady Bird Lake from the private balcony and unwind in the spa-inspired bathroom with a walk-in shower and designer finishes. Residents enjoy over 19,000 sq. ft. of luxury amenities, including a lap pool, fitness center, yoga studio, sky lounge, co-working spaces, and 24/7 concierge service.
-
2025-10-31$500,000 Active 586-char remark
Show marketing remark (586 chars)
Experience elevated downtown living at The Modern Austin Residences, Austin’s newest premier luxury tower. This 1-bedroom, 1-bath home features 10’4” ceilings, floor-to-ceiling windows, quartz countertops, and a top-of-the-line Wolf range and cooktop. Enjoy beautiful views of Lady Bird Lake from the private balcony and unwind in the spa-inspired bathroom with a walk-in shower and designer finishes. Residents enjoy over 19,000 sq. ft. of luxury amenities, including a lap pool, fitness center, yoga studio, sky lounge, co-working spaces, and 24/7 concierge service.
ⓘ Source: listings_history table (triggers on properties + properties_extension) + one-shot
backfill from property_details.listing_events for pre-trigger history.
Nearby sold comps map
Loading sold comps map…
Walkable amenities ~0.75 mi
Loading nearby amenities…
Taxation est. · year 1
- Rental income
- $32,437
- − Mortgage interest
- −$23,302
- − Property taxes
- −$6,240
- − Insurance
- −$2,080
- − Repairs & maintenance
- −$2,595
- − Management
- −$2,595
- − HOA
- −$5,736
- − Depreciation
- −$12,102
- Taxable loss
- −$22,213
- Est. tax savings @ 24.0%
- +$5,331
- After-tax cash flow
- $-9,278/yr
For passive investors: Depreciation is non-cash, so a rental often shows a tax loss while cash-flowing — sheltering income. Rental losses are passive: they offset passive income freely, and up to $25,000/yr can offset ordinary (W-2) income if you actively participate and your MAGI is under $100k (phasing out to $0 by $150k); unused losses carry forward. On sale, claimed depreciation is recaptured at up to 25%, and gains may owe capital-gains tax (a 1031 exchange can defer both). Figures are a year-1 estimate at your 24.0% rate — not tax advice; consult a CPA.
Schools (NCES district)
- District
- Austin ISD
- NCES district ID
- 4808940
- Math proficiency
- 33% ▼ -19.00%
- Reading proficiency
- 44% ▼ -7.00%
- Median HH income
- $54,627
- Composite
- 33.65/100
- National rank
- #5397
- State rank
- #431 of 826 in TX
Livability — Austin
- Score
- 82/100
- State rank
- #16
- US rank
- #1208
Category grades
Schools grade is shown separately in the Schools card above.
Census & demographics
- Census place
- Austin, TX
- County
- Travis County · 1,299,254 people
- City population
- 1,066,854
- Metro
- Austin-Round Rock-Georgetown, TX
- Population (ZIP)
- 11,824
- Household income
- $162,168
- Rent vs Own
- Severe rent burden
- 678.0
Population outlook (Travis County) Hauer SSP2
- Today (2025)
- 1,545,133 people
- By 2030
- 1,729,269 · +11.9%
- By 2040
- 2,097,596 · +35.8%
- By 2050
- 2,463,890 · +59.5%
- By 2075
- 3,249,374 · +110.3%
- By 2100
- 3,801,868 · +146.1%
Race, ethnicity, and origin ACS 2023
- Neighborhood character
- Predominantly White (68%)
- Race & ethnicity
- White 68% Hispanic / Latino 17% Two or more races 12% Asian 6% Black 3%
- Hispanic origin (detail)
- Mexican 10%
- Common ancestry
- Lithuanian 4% Romanian 4% Slovak 3%
- Foreign-born
- 13% · Canada, China, Dominican Republic
- Languages at home
- 83% English-only · Spanish 10% Other Indo-European 3% Chinese 1%
Political lean MEDSL · Travis
- 2024 margin
- Solid D (+39.3) · D 68.8% · R 29.4% · Other 1.8%
- 2008→2024 swing
- +9.9pp toward D · 2008: 29.4pp · 2024: 39.3pp
- All cycles
- 2024: D+39.3 2020: D+45.0 2016: D+38.9 2012: D+23.9 2008: D+29.4
Not yet ingested
- Civics
- —
Market trends
- HPI YoY
- ▼ -0.46%
- Current HPI
- 183.8877
- Rent YoY
- ▲ 2.54%
- Metro
- Austin-Round Rock-Georgetown, TX
- State GDP YoY
- ▲ 3.95%
- F500 in state
- 110
Industry mix (Fortune 500 HQ in TX)
| Industry | F500 HQs | Revenue |
|---|---|---|
| Energy | 16 | $1,198B |
|
||
| Technology | 5 | $198B |
|
||
| Engineering / Construction | 4 | $72B |
|
||
| Energy Services | 3 | $60B |
|
||
| Utilities | 3 | $41B |
|
||
| Healthcare | 2 | $330B |
|
||
Price history
-16.8% since first listed5 events — show timeline
- 2026-03-13 Price Changed $416,000 Unlock MLS
- 2026-01-20 Price Changed $396,200 Unlock MLS
- 2026-01-10 Price Changed $416,010 Unlock MLS
- 2025-12-18 Price Changed $396,200 Unlock MLS
- 2025-10-31 Listed $500,000 Unlock MLS
Cash-flow waterfall
monthlySold comps — $/sqft
last 12 mo · ≤1 miLoading sold comps…