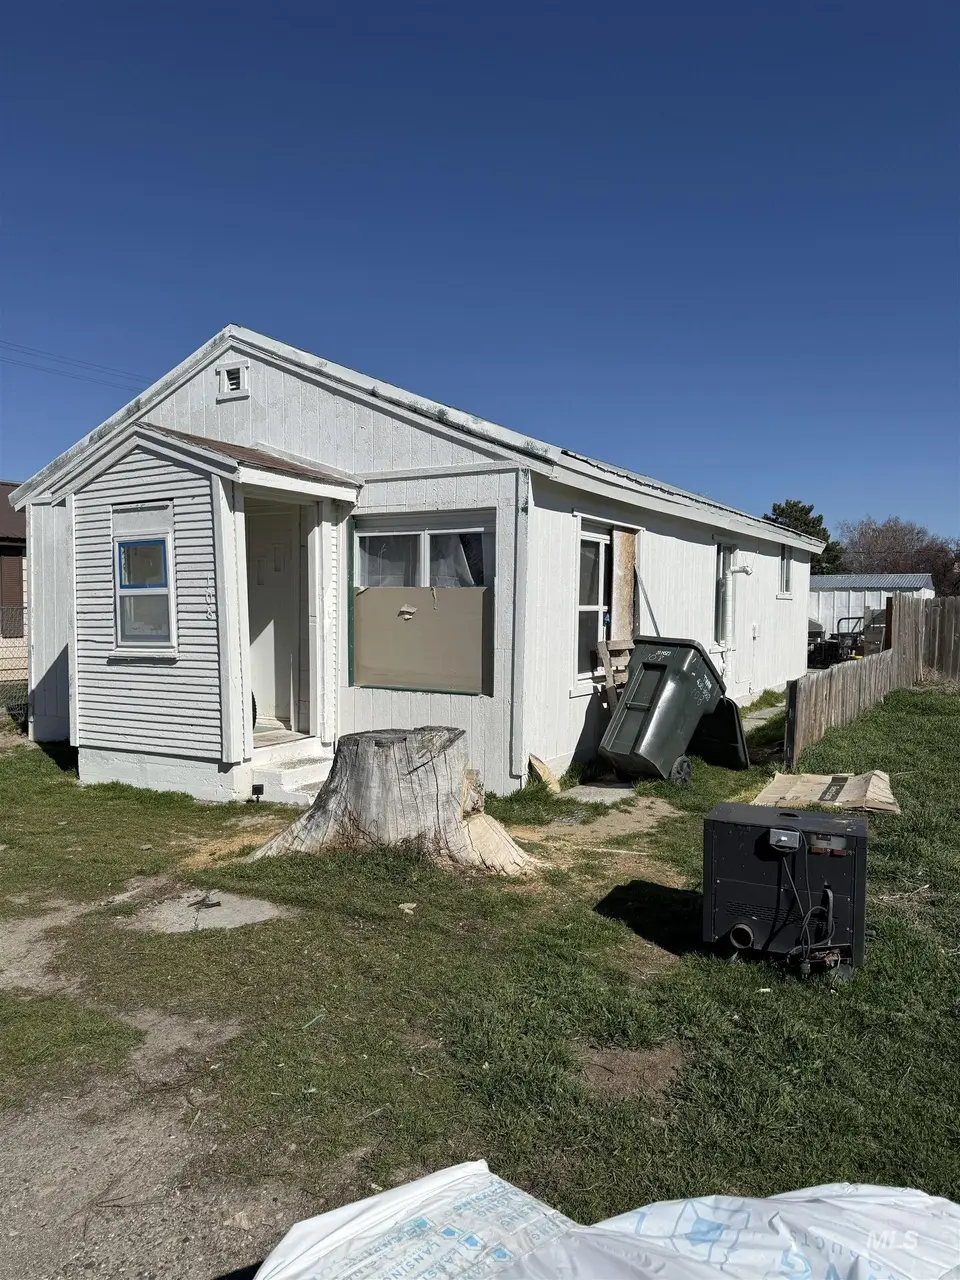
108 N 3rd St E · Paul, ID
Flood risk 1/10 · Minimal
- FEMA flood zone
- —
- Chance of flooding over 30 yrs
- 0.0%
- Est. flood insurance / yr
- —
Fire risk 1/10 · Minimal
- Est. fire insurance / yr
- $584 – $1,086
Heat risk 3/10 · Minor
- Hot days now (above 93°F)
- 7 days/yr
- Hot days in 30 yrs
- 19 days/yr
Wind risk 1/10 · Minimal
- Chance of severe wind over 30 yrs
- —
Air-quality risk 7/10 · Major
- Unhealthy air days now
- 14 days/yr
- Unhealthy air days in 30 yrs
- 15 days/yr
Risk factors via First Street. Map © Google.
Why this score? — see what drove the D grade
The composite is a weighted blend of 9 inputs, each scored 0–100. Each bar is that input's sub-score; the figure is the points it added to the 100-point composite (weight × sub-score).
- ARV discount +15.0/15.0
- Cash flow +12.0/30.0
- DSCR +3.6/10.0
- Livability +3.4/5.0
- Schools +2.6/10.0
- Rent growth +2.5/5.0
- Condition / age +2.5/5.0
- 1% rule +2.2/10.0
- Appreciation +0.0/10.0
$120,000
🖨 Deal sheet (PDF) 📄 Offer letter ✓ Due diligence
Listing remarks MLS
* * SHOWING WINDOW WILL BE APRIL 11, 2026 FROM 11AM - 3PM ONLY * * Investor special with serious potential! This property is ready for someone to bring it back to life and capitalize on the upside. With solid bones and a layout that lends itself well to a modern refresh, this is the perfect opportunity for a flip, rental, or value-add project. Whether you’re looking for your next project or a chance to build equity, this is a property you won’t want to miss.
Key facts
- 5,227 sq ft lot
- Garage
- Built 1944
Neighborhood map
What this means for you Summary
Snapshot
- This is a 2-bed/1.0-bath single-family listed at $120k.
Deal economics
- At list price, monthly cash flow is $-28 ($-332/yr) — negative.
- To cash-flow at today's rent, offer at most $115k (4.1% below list).
- To meet the 1% rule (rent ≥ 1% of price), the offer needs to be $87k (27.9% below list).
- Recommended offer: $87k (27.9% below list) — sets the bar for 1% rule.
Location & tenants
- Location reads 68/100 on livability (#80 in ID) — a middle-class / working-renter tenant base. Strengths: crime A+, cost of living A+, housing A+; Watch: health & safety C-, amenities F, commute F.
- Minidoka County Joint District (town): math 24% / reading 38% proficiency, ranked #85 of 92 in ID (top 92%) — families likely to look elsewhere, expect single-tenant / working-renter base with shorter leases; 66% free/reduced lunch — lower-income household profile, screen leases tightly.
- Zoned schools: Paul Elementary School (math 32% / reading 46%, grade F, #247 of 357 statewide, top 70%, 502 students, 53% FRL); West Minico Middle School (math 22% / reading 36%, grade F, #95 of 109 statewide, top 88%, 529 students, 55% FRL); Minico Senior High School (math 25% / reading 43%, grade F, #115 of 169 statewide, top 68%, 1,211 students, 49% FRL).
- Market conditions: 17 active listings in the ZIP; 144 units permitted in Minidoka County in 2024 (0 in 5+ unit buildings).
Forward outlook
- Local home prices are declining (-3.0%/yr); year-one equity from $830 of loan paydown is wiped out by about $4k of value loss. Plan a longer hold.
- Minidoka County population projected at +7% by 2050 — modest demand growth; plan on rents tracking national, not racing it.
Negotiation context
- It's been on market 53 days — a 3% lower offer ($116k) is reasonable based on typical stale-listing flexibility.
- 3 sale attempts since 7y ago; this cycle's ask has dropped $10k (8%) from the opening price — seller is motivated, your offer sets the floor, not the list.
Risks & watch-outs
- Watch-outs: built in 1944 — expect roof / HVAC / electrical / plumbing capex.
Questions for the listing agent
- What do current leases actually rent for vs. the listed asking? Can we see a recent rent roll and the last 12 months of T-12 income?
- It's been on market 53 days. Have you received any prior offers? Is the seller open to a 28% concession, seller financing, or rate buy-down credit?
- Built in 1944 — when were the roof, HVAC, electrical panel, plumbing, and water heater last replaced?
- Is there a deadline driving the sale (1031 exchange, divorce, estate, relocation)? That informs how much negotiation room exists.
- Schools are F-rated, which usually means shorter tenancies and higher turnover. Who's the typical renter profile here, and what's been the actual vacancy rate?
- The area grade is low — what's the realistic commute time and amenity access for the typical tenant pool here? Any planned neighborhood developments (good or bad) we should know about?
- What's the average days-on-market for RENTAL listings here right now (not sales)? A rising rental-DOM trend means longer vacancies and softer asking-rent achievability than the comps imply.
- What's the recent tenant-quality profile in this submarket — average credit score on applications, eviction rate, late-payment / NSF rate, and stable-employment percentage? A property-management company in the area should have these aggregated.
- How much new for-sale + rental construction is in the pipeline within 1–3 miles? Heavy new supply typically softens prices + rents 12–24 months out; constrained supply supports both.
Investment metrics
- 1% rule
- 0.72% ✗
- Cap rate
- 6.02%
- Cash-on-cash
- -0.99%
- DSCR
- 0.96
- GRM
- 11.6
CMA / ARV
- ARV (median comp)
- $201,796
- List price
- $120,000
- Delta
- -40.53%
- Verdict
- UNDERPRICED
- Comps
- 12 within 1.0 mi
Show comp detail 3 sales within ~0.75 mi
| Address | Dist | Beds/Ba | Sqft | Sold | Price | $/sf | Match |
|---|---|---|---|---|---|---|---|
| 204 E Idaho St | 0.12mi | 2/1.0 | 896 (+0%) | 2mo | $235,000 | $262 | 92 |
| 203 E Idaho St | 0.15mi | 2/1.0 | 880 (-2%) | 2mo | $225,000 | $256 | 89 |
| 222 E Clark St | 0.04mi | 2/1.0 | 1,026 (+15%) | 10mo | $172,500 | $168 | 65 |
Match score weights: distance 35% · size 25% · config 20% · recency 20%. Top-matched comps best support the ARV.
Projected returns pro-forma
-3.0% appreciation · 3.0% rent growth · sell at horizon
- IRR
- -18.0%
- Equity multiple
- 0.37×
- Total profit
- $-21,267
- Equity at exit
- $17,892
- IRR
- -10.3%
- Equity multiple
- 0.37×
- Total profit
- $-21,030
- Equity at exit
- $10,375
Cash invested: $33,600 (down + closing). Projections, not guarantees.
Landlord ↔ Tenant lean methodology
- Overall (STATE)
- 91 Strongly Landlord-Friendly
- State Idaho
- 91 Strongly Landlord-Friendly · R+18
- County
- — inherits STATE
- City
- — inherits STATE
ZIP-level market 83347
- Home prices YoY
- -17.0%
- Active inventory
- 17
- Price-to-rent
- 11.6×
Monthly cashflow live
- Estimated rent
- $865 medium interval (Pro) →
- Mortgage (P&I)
- −$629
- Tax from tax record
- −$32 /mo · $381/yr
- Insurance
- −$50
- HOA
- −$0
- Vacancy / Maint / Mgmt
- −$182
- Net cashflow
- $-28
Break-even live
Sensitivity live
| Price | -10% $40 | -5% $6 | +0% $-28 | +5% $-62 | +10% $-96 |
|---|---|---|---|---|---|
| Rent | -10% $-96 | -5% $-62 | +0% $-28 | +5% $7 | +10% $41 |
| Rate | -1.0pp $33 | -0.5pp $3 | base $-28 | +0.5pp $-59 | +1.0pp $-90 |
UW: 25.0% down · 7.5% · 30yr · 1.5% tax · 5.0% vac · 8.0% maint · 8.0% mgmt
Financing live
Cash to close
- Down payment
- $30,000
- Closing costs
- $3,600
- Reserves months
- —
- Total cash needed
- —
Loan-product check · same deal, 3 products live
Conventional
25% down · 7.5% · 30yr
- Down + closing
- —
- Monthly P&I
- —
- Monthly cashflow
- —
- DSCR
- —
- Eligible?
- —
Personal DTI + credit; lowest rate.
DSCR
20% down · 8.5% · 30yr
- Down + closing
- —
- Monthly P&I
- —
- Monthly cashflow
- —
- DSCR
- —
- Eligible?
- —
No personal income docs; deal must DSCR.
Hard money
10% down · 12.0% · 12mo
- Down + closing
- —
- Monthly P&I
- —
- Monthly cashflow
- —
- DSCR
- —
- Eligible?
- —
Short-term bridge; refi at stabilization.
Listing history 9 events
-
2026-04-21price $120,000 477-char remark
Show marketing remark (477 chars)
* * SHOWING WINDOW WILL BE APRIL 11, 2026 FROM 11AM - 3PM ONLY * * Investor special with serious potential! This property is ready for someone to bring it back to life and capitalize on the upside. With solid bones and a layout that lends itself well to a modern refresh, this is the perfect opportunity for a flip, rental, or value-add project. Whether you’re looking for your next project or a chance to build equity, this is a property you won’t want to miss.
-
2026-04-03$130,000 Active 477-char remark
Show marketing remark (477 chars)
* * SHOWING WINDOW WILL BE APRIL 11, 2026 FROM 11AM - 3PM ONLY * * Investor special with serious potential! This property is ready for someone to bring it back to life and capitalize on the upside. With solid bones and a layout that lends itself well to a modern refresh, this is the perfect opportunity for a flip, rental, or value-add project. Whether you’re looking for your next project or a chance to build equity, this is a property you won’t want to miss.
-
2023-06-08soldstatus
-
2023-06-07soldstatus Sold 168-char remark
Show marketing remark (168 chars)
Fixer upper in Paul! Bring your vision and sweat equity to this one, or add to your portfolio as it is currently being used as a rental. Call your agent to take a look!
-
2023-04-25status Pending 168-char remark
Show marketing remark (168 chars)
Fixer upper in Paul! Bring your vision and sweat equity to this one, or add to your portfolio as it is currently being used as a rental. Call your agent to take a look!
-
2023-02-21price $125,000 168-char remark
Show marketing remark (168 chars)
Fixer upper in Paul! Bring your vision and sweat equity to this one, or add to your portfolio as it is currently being used as a rental. Call your agent to take a look!
-
2022-12-02$130,000 Active 168-char remark
Show marketing remark (168 chars)
Fixer upper in Paul! Bring your vision and sweat equity to this one, or add to your portfolio as it is currently being used as a rental. Call your agent to take a look!
-
2019-09-17$80,000
-
2000-06-13soldstatus
ⓘ Source: listings_history table (triggers on properties + properties_extension) + one-shot
backfill from property_details.listing_events for pre-trigger history.
Tax reassessment forecast ID · Resets to sale price
- Current annual tax
- $381 · $32/mo
- Projected year-2 tax
- $828 · $69/mo
- Expected delta
- +$447/yr (+$37/mo · 117.1%)
ⓘ Screening estimate from a state-policy table — verify with the county assessor before closing.
Climate risk First Street
- Flood 1/10 Low 0% chance over 30 yrs
- Wildfire 1/10 Low
- Heat 3/10 Moderate 7 d/yr ≥93°F today · 19 d/yr by 30 yrs out
- Wind 1/10 Low
- Air quality 7/10 Severe 14 unhealthy d/yr today · 15 by 30 yrs out
Nearby sold comps map
Loading sold comps map…
Walkable amenities ~0.75 mi
Loading nearby amenities…
Taxation est. · year 1
- Rental income
- $10,381
- − Mortgage interest
- −$6,722
- − Property taxes
- −$381
- − Insurance
- −$600
- − Repairs & maintenance
- −$830
- − Management
- −$830
- − Depreciation
- −$3,491
- Taxable loss
- −$2,474
- Est. tax savings @ 24.0%
- +$594
- After-tax cash flow
- $262/yr
For passive investors: Depreciation is non-cash, so a rental often shows a tax loss while cash-flowing — sheltering income. Rental losses are passive: they offset passive income freely, and up to $25,000/yr can offset ordinary (W-2) income if you actively participate and your MAGI is under $100k (phasing out to $0 by $150k); unused losses carry forward. On sale, claimed depreciation is recaptured at up to 25%, and gains may owe capital-gains tax (a 1031 exchange can defer both). Figures are a year-1 estimate at your 24.0% rate — not tax advice; consult a CPA.
Schools (NCES district)
- District
- Minidoka County Joint District
- NCES district ID
- 1602190
- Math proficiency
- 24% ▼ -8.00%
- Reading proficiency
- 38% ▼ -5.00%
- Median HH income
- $44,551
- Composite
- 26.46/100
- National rank
- #7216
- State rank
- #85 of 92 in ID
Livability — Paul
- Score
- 68/100
- State rank
- #80
- US rank
- #9643
Category grades
Schools grade is shown separately in the Schools card above.
Census & demographics
- Census place
- Paul, ID
- Population (ZIP)
- 3,284
Population outlook (Minidoka County) Hauer SSP2
- Today (2025)
- 21,113 people
- By 2030
- 21,432 · +1.5%
- By 2040
- 22,104 · +4.7%
- By 2050
- 22,684 · +7.4%
- By 2075
- 24,485 · +16.0%
- By 2100
- 24,787 · +17.4%
Race, ethnicity, and origin ACS 2023
- Neighborhood character
- Majority White (64%)
- Race & ethnicity
- White 64% Hispanic / Latino 32% Two or more races 15%
- Hispanic origin (detail)
- Mexican 30% Puerto Rican 2%
- Common ancestry
- Italian 2% Portuguese 1% Romanian 1%
- Foreign-born
- 11% · Canada
- Languages at home
- 78% English-only · Spanish 21% French/Haitian/Cajun 1%
Political lean MEDSL · Minidoka
- 2024 margin
- Solid R (+63.3) · D 17.3% · R 80.5% · Other 2.2%
- 2008→2024 swing
- -13.1pp toward R · 2008: -50.2pp · 2024: -63.3pp
- All cycles
- 2024: R+63.3 2020: R+59.0 2016: R+54.1 2012: R+58.1 2008: R+50.2
Not yet ingested
- Civics
- —
Market trends
- HPI YoY
- ▼ -51.30%
- Current HPI
- 249.8245
- Rent YoY
- —
- Metro
- —
- State GDP YoY
- ▲ 4.51%
- F500 in state
- 6
Industry mix (Fortune 500 HQ in ID)
| Industry | F500 HQs | Revenue |
|---|---|---|
| Retail | 1 | $79B |
|
||
| Technology | 1 | $25B |
|
||
| Food / Agriculture | 1 | $6B |
|
||
Price history
+50.0% since first listed9 events — show timeline
- 2026-04-21 Price Changed $120,000 IMLS
- 2026-04-03 Listed $130,000 IMLS
- 2023-06-08 Sold (Public Records) — Public Records
- 2023-06-07 Sold (MLS) — IMLS
- 2023-04-25 Pending — IMLS
- 2023-02-21 Price Changed $125,000 IMLS
- 2022-12-02 Listed $130,000 IMLS
- 2019-09-17 Listed $80,000 IMLS
- 2000-06-13 Sold (Public Records) — Public Records
Property tax history
-2.3%/yrLatest (2025): $381 · -2.4% YoY. Source: county tax records.
Cash-flow waterfall
monthlySold comps — $/sqft
last 12 mo · ≤1 miLoading sold comps…