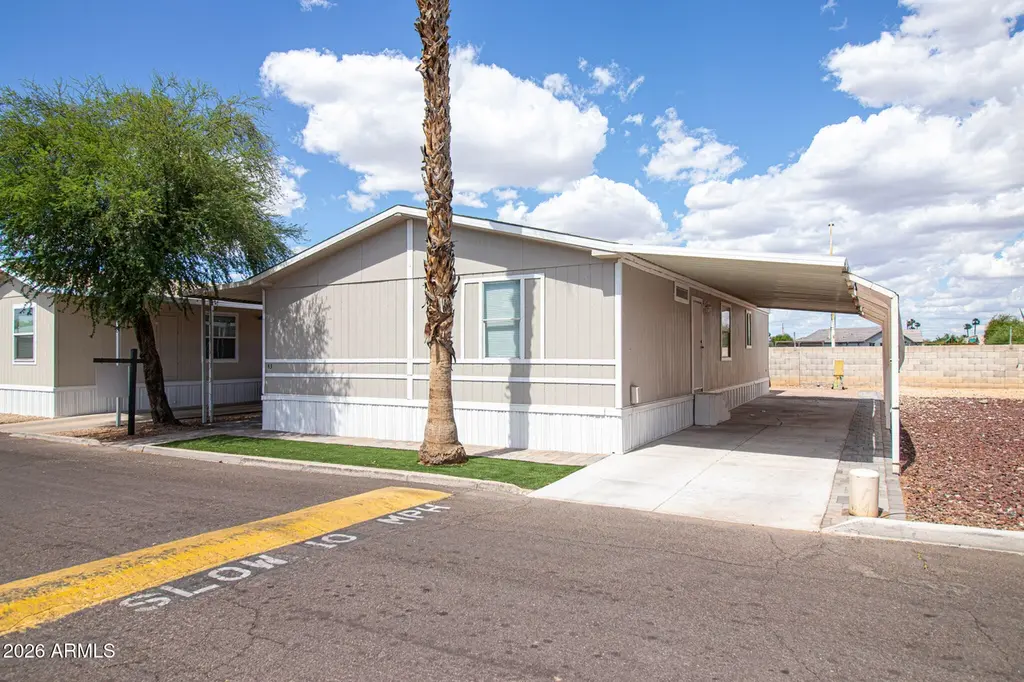
8601 N 71st Ave #43 · Glendale, AZ
Flood risk 1/10 · Minimal
- FEMA flood zone
- X (shaded)
- Chance of flooding over 30 yrs
- 0.0%
- Est. flood insurance / yr
- $507 – $1,088
Fire risk 2/10 · Minimal
- Est. fire insurance / yr
- $610 – $1,132
Heat risk 9/10 · Severe
- Hot days now (above 112°F)
- 6 days/yr
- Hot days in 30 yrs
- 17 days/yr
Wind risk 1/10 · Minimal
- Chance of severe wind over 30 yrs
- —
Air-quality risk 3/10 · Minor
- Unhealthy air days now
- 3 days/yr
- Unhealthy air days in 30 yrs
- 3 days/yr
Risk factors via First Street. Map © Google.
Why this score? — see what drove the C+ grade
The composite is a weighted blend of 9 inputs, each scored 0–100. Each bar is that input's sub-score; the figure is the points it added to the 100-point composite (weight × sub-score).
- Cash flow +30.0/30.0
- 1% rule +10.0/10.0
- DSCR +10.0/10.0
- Livability +3.8/5.0
- Condition / age +3.8/5.0
- Schools +2.3/10.0
- Rent growth +1.8/5.0
- ARV discount +0.0/15.0
- Appreciation +0.0/10.0
$129,000
🖨 Deal sheet (PDF) 📄 Offer letter ✓ Due diligence
Listing remarks MLS
Remodeled! Tile floor. Stunning 4 BED HOME. Spacious, with a backyard, storage, and lots of potential. Wonderful all-age community with pool, kiddie pool, basketball court, and RV storage. Pet friendly. Priced for quick sale. Must be approved by the park. Land lease $810/month. Serial #:13513207A&B. Size: 28X56. Manufacturer: Redman Homes Inc. Year: 1993.
Key facts
- Tile throughout
- Deck for relaxing
- Community with pool
Tags
Property features AI
Finance
- HOA & community: Community pool; Playground; No association fees; Association rules prohibit visible trucks, trailers, RVs, and boats
Exterior
- Parking: 2 covered parking spaces; 2 carport spaces
- Utilities: City water; Public sewer; Electric service with 220 volts in kitchen
- Home design: Manufactured/Mobile home; Leasehold ownership
- Construction: Steel frame and wood frame construction; Painted exterior
- Exterior features: Shed(s); Chain-link fencing; Dirt backyard; Synthetic grass in front yard; Composition roof
Interior
- Kitchen: Built-in microwave; Pantry; 220-volt outlet in kitchen
- Bedrooms: Up to 4 possible bedrooms
- Flooring: Tile
- Bathrooms: 2 full bathrooms
- Heating & cooling: Electric heating; Central air; Ceiling fans
- Interior features: High-speed internet; Granite counters; Laminate counters; No interior steps; Full bathroom in primary bedroom; Dual-pane windows
- Laundry & utility: Inside laundry; Refrigerator; Dishwasher; Garbage disposal
Neighborhood map
What this means for you Summary
Snapshot
- This is a 4-bed/2.0-bath manufactured listed at $129k. Condition is rated good.
Deal economics
- At list price, monthly cash flow is $709 ($9k/yr) — positive.
- The deal already cash-flows at list — no discount required.
- Meets the 1% rule at list price ($2k rent vs $129k).
- Recommended offer: $121k (6.0% below list) — sets the bar for market timing.
- Cap rate 12.9% vs local median 3.5% in Glendale — top-decile yield for the area; either an underpriced asset or a hidden risk that comps aren't pricing in. Stress-test before assuming the spread holds.
Location & tenants
- Location reads 76/100 on livability (#12 in AZ, #3,235 nationally) — a middle-class / working-renter tenant base. Strengths: commute A+, housing A+, amenities B; Watch: health & safety D+, crime F.
- Glendale Union High School District (4285) (urban): math 23% / reading 31% proficiency, ranked #130 of 249 in AZ (top 52%) — low school quality limits family demand, transient renter base, plan for 1-2y turnover.
- Zoned schools: Glendale High School (math 13% / reading 22%, grade F, #245 of 381 statewide, top 65%, 1,816 students, 76% FRL).
- Market conditions: Rents soft (-3.0%/yr); 220 active listings in the ZIP; 36 comparable units currently listed for rent nearby; rentals at typical pace (median 19d on market — plan ~3-4 weeks tenant-placement turnaround); 36,011 units permitted in Maricopa County in 2024 (12,801 in 5+ unit buildings).
- At $2,026/mo this rent would consume 45% of the median local household income ($54k/yr) (locally 3741% of renters already pay >50% of income on rent) — very limited rent-growth headroom before tenants either downsize or default.
Forward outlook
- Local home prices are declining (-3.0%/yr); year-one equity from $892 of loan paydown is wiped out by about $4k of value loss. Plan a longer hold.
- Maricopa County population projected at +38% by 2050 — long-run rental-demand tailwind backs the buy-and-hold thesis.
- At projected returns (-3.0% appreciation + 0.0% rent growth), your $36k cash investment doubles in ~7 years — after that, you're playing with house money.
Negotiation context
- It's been on market 82 days — a 6% lower offer ($121k) is reasonable based on typical stale-listing flexibility.
- 2 sale attempts; this cycle's ask has dropped $10k (7%) from the opening price — seller is motivated, your offer sets the floor, not the list.
- Current owner paid $100k; 29% above their basis — modest negotiation headroom, anchor on the comps not their cost.
Risks & watch-outs
- Climate carrying-cost: extreme-heat days projected 6→17/yr by 2055 (HVAC capex compounding) — expect insurance premiums to compound above CPI over the hold.
Questions for the listing agent
- It's been on market 82 days. Have you received any prior offers? Is the seller open to a 6% concession, seller financing, or rate buy-down credit?
- Why hasn't it sold? Are there any deal-killer items the seller is aware of (foundation, flood, title, zoning, code violations)?
- Is there a deadline driving the sale (1031 exchange, divorce, estate, relocation)? That informs how much negotiation room exists.
- Crime grade is F in this area — have there been break-ins, vandalism, or insurance claims at this property in the last 3 years? What carrier currently insures it and at what premium?
- What's the average days-on-market for RENTAL listings here right now (not sales)? A rising rental-DOM trend means longer vacancies and softer asking-rent achievability than the comps imply.
- What's the recent tenant-quality profile in this submarket — average credit score on applications, eviction rate, late-payment / NSF rate, and stable-employment percentage? A property-management company in the area should have these aggregated.
- How much new for-sale + rental construction is in the pipeline within 1–3 miles? Heavy new supply typically softens prices + rents 12–24 months out; constrained supply supports both.
Investment metrics
- 1% rule
- 1.57% ✓
- Cap rate
- 12.89%
- Cash-on-cash
- 23.55%
- DSCR
- 2.05
- GRM
- 5.3
CMA / ARV
- ARV (on-the-fly)
- $110,400
- Comps found
- 10
Show comp detail 10 sales within ~0.75 mi
| Address | Dist | Beds/Ba | Sqft | Sold | Price | $/sf | Match |
|---|---|---|---|---|---|---|---|
| 8601 N 71st Ave #56 | 0.00mi | 4/2.0 | 1,560 (-2%) | 20mo | $101,000 | $65 | 79 |
| 8601 N 71st Ave #89 | 0.00mi | 3/2.0 (-1) | 1,456 (-9%) | 11mo | $145,000 | $100 | 71 |
| 8601 N 71st Ave #17 | 0.00mi | 3/2.0 (-1) | 1,474 (-8%) | 14mo | $150,000 | $102 | 70 |
| 8601 N 71st Ave #55 | 0.00mi | 4/2.0 | 1,440 (-10%) | 18mo | $97,000 | $67 | 69 |
| 6960 W Peoria Ave #231 | 0.26mi | 3/2.0 (-1) | 1,536 (-4%) | 14mo | $56,700 | $37 | 65 |
| 8601 N 71st Ave #128 | 0.00mi | 3/2.0 (-1) | 1,440 (-10%) | 20mo | $100,000 | $69 | 61 |
| 6960 W Peoria Ave #15 | 0.26mi | 3/1.5 (-1) | 1,392 (-13%) | 0mo | $40,000 | $29 | 59 |
| 8401 N 67th Ave #83 | 0.56mi | 3/2.0 (-1) | 1,536 (-4%) | 23mo | $106,650 | $69 | 43 |
| 6601 W Eva St | 0.72mi | 4/3.0 | 1,460 (-9%) | 7mo | $240,000 | $164 | 42 |
| 8401 N 67th Ave #273 | 0.56mi | 3/2.0 (-1) | 1,456 (-9%) | 24mo | $85,000 | $58 | 34 |
Match score weights: distance 35% · size 25% · config 20% · recency 20%. Top-matched comps best support the ARV.
Projected returns pro-forma
-3.0% appreciation · 0.0% rent growth · sell at horizon
- IRR
- 13.2%
- Equity multiple
- 1.51×
- Total profit
- $18,337
- Equity at exit
- $19,234
- IRR
- 19.6%
- Equity multiple
- 2.42×
- Total profit
- $51,283
- Equity at exit
- $11,154
Cash invested: $36,120 (down + closing). Projections, not guarantees.
Landlord ↔ Tenant lean methodology
- Overall (STATE)
- 87 Strongly Landlord-Friendly
- State Arizona
- 87 Strongly Landlord-Friendly · R+3
- County
- — inherits STATE
- City
- — inherits STATE
ZIP-level market 85301
- Home prices YoY
- -10.6%
- Rents YoY
- -3.0%
- Active inventory
- 220
- Price-to-rent
- 5.3×
Monthly cashflow live
- Estimated rent
- $2,026 high interval (Pro) →
- Mortgage (P&I)
- −$676
- Tax est. 1.5%
- −$161 /mo · $1,935/yr
- Insurance
- −$54
- HOA
- −$0
- Vacancy / Maint / Mgmt
- −$425
- Net cashflow
- $709
Break-even live
Sensitivity live
| Price | -10% $798 | -5% $753 | +0% $709 | +5% $664 | +10% $620 |
|---|---|---|---|---|---|
| Rent | -10% $549 | -5% $629 | +0% $709 | +5% $789 | +10% $869 |
| Rate | -1.0pp $774 | -0.5pp $742 | base $709 | +0.5pp $675 | +1.0pp $641 |
UW: 25.0% down · 7.5% · 30yr · 1.5% tax · 5.0% vac · 8.0% maint · 8.0% mgmt
Financing live
Cash to close
- Down payment
- $32,250
- Closing costs
- $3,870
- Reserves months
- —
- Total cash needed
- —
Loan-product check · same deal, 3 products live
Conventional
25% down · 7.5% · 30yr
- Down + closing
- —
- Monthly P&I
- —
- Monthly cashflow
- —
- DSCR
- —
- Eligible?
- —
Personal DTI + credit; lowest rate.
DSCR
20% down · 8.5% · 30yr
- Down + closing
- —
- Monthly P&I
- —
- Monthly cashflow
- —
- DSCR
- —
- Eligible?
- —
No personal income docs; deal must DSCR.
Hard money
10% down · 12.0% · 12mo
- Down + closing
- —
- Monthly P&I
- —
- Monthly cashflow
- —
- DSCR
- —
- Eligible?
- —
Short-term bridge; refi at stabilization.
Rent comps 36 comps
| Address | Beds | Baths | Sqft | Rent | $/sqft | DOM | Units | Dist |
|---|---|---|---|---|---|---|---|---|
| 7217 W Golden Ln Peoria, AZ | 3.0 | 3.0 | 1986 | $2,275 | $1.15 | 19d | 1 | 0.26mi |
| 7217 W Golden Ln Peoria, AZ | 3.0 | 3.0 | 1986 | $2,235 | $1.13 | 6d | 1 | 0.26mi |
| 8772 N 67th Ave Glendale, AZ | 1.0–3.0 | 1.0–2.0 | 937 | $2,009 | $2.14 | 2d | 24 | 0.35mi |
| 6619 W Golden Ln Glendale, AZ | 4.0 | 2.0 | 1768 | $2,029 | $1.15 | 2d | 1 | 0.59mi |
| 6619 W Golden Ln Glendale, AZ | 4.0 | 2.0 | 1768 | $1,979 | $1.12 | 11d | 1 | 0.59mi |
| 7102 W Carol Ave Peoria, AZ | 3.0 | 2.0 | 1288 | $1,970 | $1.53 | 6d | 1 | 0.66mi |
| 7027 W Palo Verde Ave Peoria, AZ | 3.0 | 2.0 | 1500 | $1,999 | $1.33 | 44d | 1 | 0.73mi |
| 8938 N 64th Ln Glendale, AZ | 3.0 | 2.0 | 1256 | $2,095 | $1.67 | 2d | 1 | 0.75mi |
| 7102 W Palo Verde Ave Peoria, AZ | 3.0 | 2.0 | 1360 | $2,000 | $1.47 | 44d | 1 | 0.76mi |
| 6353 W Mission Ln Glendale, AZ | 3.0 | 2.0 | 1780 | $2,200 | $1.24 | 44d | 1 | 0.97mi |
| 9914 N 73rd Ave Peoria, AZ | 3.0 | 1.5 | 1312 | $1,716 | $1.31 | 44d | 1 | 0.97mi |
| 9022 N 63rd Dr Glendale, AZ | 3.0 | 2.0 | 1401 | $2,195 | $1.57 | 13d | 1 | 0.98mi |
| 9819 N 67th Dr Peoria, AZ | 3.0 | 2.0 | 1648 | $2,500 | $1.52 | 25d | 1 | 0.99mi |
| 6421 W Carol Ave Glendale, AZ | 3.0 | 2.0 | 1243 | $1,799 | $1.45 | 19d | 1 | 1.02mi |
| 7009 W Brown St Peoria, AZ | 4.0 | 2.0 | 1790 | $2,195 | $1.23 | 13d | 1 | 1.04mi |
| 6204 W Evergreen Rd Glendale, AZ | 3.0 | 2.0 | 1895 | $2,066 | $1.09 | 25d | 1 | 1.05mi |
| 9459 N 64th Dr Glendale, AZ | 3.0 | 2.0 | 1531 | $2,600 | $1.70 | 16d | 1 | 1.07mi |
| 6513 W Turquoise Ave Glendale, AZ | 3.0 | 2.5 | 1961 | $2,160 | $1.10 | 44d | 1 | 1.10mi |
| 10013 N 66th Ln Glendale, AZ | 3.0 | 2.0 | 1063 | $1,999 | $1.88 | 25d | 1 | 1.13mi |
| 7542 W Cinnabar Ave Peoria, AZ | 3.0 | 2.5 | 1947 | $1,895 | $0.97 | 44d | 1 | 1.17mi |
| 9903 N 77th Ave Peoria, AZ | 3.0 | 2.0 | 1446 | $1,895 | $1.31 | 5d | 1 | 1.21mi |
| 6337 W Turquoise Ave Glendale, AZ | 3.0 | 3.0 | 1938 | $2,095 | $1.08 | 23d | 1 | 1.23mi |
| 8014 W Eva St Peoria, AZ | 4.0 | 2.0 | 1659 | $2,085 | $1.26 | 44d | 1 | 1.24mi |
| 7332 N 70th Dr Glendale, AZ | 3.0 | 2.0 | 1262 | $1,700 | $1.35 | 2d | 1 | 1.29mi |
| 8622 N 59th Ave Glendale, AZ | 2.0–3.0 | 2.0 | 1232 | $1,899 | $1.54 | 2d | 6 | 1.31mi |
| 7321 N 69th Ave Glendale, AZ | 4.0 | 2.5 | 1645 | $1,999 | $1.22 | 2d | 1 | 1.33mi |
| 7951 W Whitney Dr Peoria, AZ | 2.0–4.0 | 2.0–2.5 | 1411 | $2,918 | $2.07 | 2d | 30 | 1.36mi |
| 7552 W State Ave Glendale, AZ | 3.0 | 2.0 | 1875 | $2,061 | $1.10 | 25d | 1 | 1.37mi |
| 8450 N 59th Ave Glendale, AZ | 1.0–3.0 | 1.0–2.0 | 919 | $2,250 | $2.45 | 6d | 1 | 1.38mi |
| 7022 W Cesar St Peoria, AZ | 3.0 | 2.5 | 1514 | $1,895 | $1.25 | 44d | 1 | 1.40mi |
| 7861 N 80th Ave Glendale, AZ | 4.0 | 2.0 | 1614 | $2,250 | $1.39 | 8d | 1 | 1.40mi |
| 7812 N 79th Dr Glendale, AZ | 4.0 | 2.0 | 1682 | $2,250 | $1.34 | 2d | 1 | 1.40mi |
| 7034 W McMahon Way Peoria, AZ | 3.0 | 2.5 | 1606 | $1,895 | $1.18 | 21d | 1 | 1.43mi |
| 9519 N 81st Dr Peoria, AZ | 3.0 | 2.5 | 1752 | $1,940 | $1.11 | 25d | 1 | 1.45mi |
| 7216 N 72nd Dr Glendale, AZ | 5.0 | 2.5 | 2136 | $2,250 | $1.05 | 19d | 1 | 1.47mi |
| 7063 W Palmaire Ave Glendale, AZ | 3.0 | 2.0 | 1300 | $1,900 | $1.46 | 2d | 1 | 1.50mi |
Listing history 20 events
-
2026-06-21days on market $129,000 Active 82 DOM
-
2026-06-18days on market $129,000 Active 79 DOM
-
2026-06-17days on market $129,000 Active 78 DOM
-
2026-06-16days on market $129,000 Active 77 DOM
-
2026-06-15days on market $129,000 Active 76 DOM
-
2026-06-13days on market $129,000 Active 74 DOM
-
2026-06-13days on market $129,000 Active 73 DOM
-
2026-06-09days on market $129,000 Active 70 DOM
-
2026-06-08days on market $129,000 Active 69 DOM
-
2026-06-07days on market $129,000 Active 68 DOM
-
2026-06-04days on market $129,000 Active 65 DOM
-
2026-06-03days on market $129,000 Active 64 DOM
-
2026-06-02days on market $129,000 Active 63 DOM
-
2026-06-01days on market $129,000 Active 62 DOM
-
2026-05-31days on market $129,000 Active 61 DOM
-
2026-04-17price $129,000
-
2026-03-24$139,000 Active
-
2025-06-11soldstatus $100,000 Closed 361-char remark
Show marketing remark (361 chars)
Remodeled! Tile floor. Stunning 4 BED HOME. Spacious, with a backyard, storage, and lots of potential. Wonderful all-age community with pool, kiddie pool, basketball court, and RV storage. Pet friendly. Priced for quick sale. Must be approved by the park. Land lease $810/month. Serial #:13513207A&B. Size: 28X56. Manufacturer: Redman Homes Inc. Year: 1993.
-
2025-05-21status Pending 361-char remark
Show marketing remark (361 chars)
Remodeled! Tile floor. Stunning 4 BED HOME. Spacious, with a backyard, storage, and lots of potential. Wonderful all-age community with pool, kiddie pool, basketball court, and RV storage. Pet friendly. Priced for quick sale. Must be approved by the park. Land lease $810/month. Serial #:13513207A&B. Size: 28X56. Manufacturer: Redman Homes Inc. Year: 1993.
-
2025-05-13$115,000 Active 361-char remark
Show marketing remark (361 chars)
Remodeled! Tile floor. Stunning 4 BED HOME. Spacious, with a backyard, storage, and lots of potential. Wonderful all-age community with pool, kiddie pool, basketball court, and RV storage. Pet friendly. Priced for quick sale. Must be approved by the park. Land lease $810/month. Serial #:13513207A&B. Size: 28X56. Manufacturer: Redman Homes Inc. Year: 1993.
ⓘ Source: listings_history table (triggers on properties + properties_extension) + one-shot
backfill from property_details.listing_events for pre-trigger history.
Climate risk First Street
- Flood 1/10 Low FEMA zone X (shaded) · 0% chance over 30 yrs
- Wildfire 2/10 Low
- Heat 9/10 Extreme 6 d/yr ≥112°F today · 17 d/yr by 30 yrs out
- Wind 1/10 Low
- Air quality 3/10 Moderate 3 unhealthy d/yr today · 3 by 30 yrs out
Nearby sold comps map
Loading sold comps map…
Walkable amenities ~0.75 mi
Loading nearby amenities…
Taxation est. · year 1
- Rental income
- $24,309
- − Mortgage interest
- −$7,226
- − Property taxes
- −$1,935
- − Insurance
- −$645
- − Repairs & maintenance
- −$1,945
- − Management
- −$1,945
- − Depreciation
- −$3,753
- Taxable income
- $6,861
- Est. tax owed @ 24.0%
- −$1,647
- After-tax cash flow
- $6,860/yr
For passive investors: Depreciation is non-cash, so a rental often shows a tax loss while cash-flowing — sheltering income. Rental losses are passive: they offset passive income freely, and up to $25,000/yr can offset ordinary (W-2) income if you actively participate and your MAGI is under $100k (phasing out to $0 by $150k); unused losses carry forward. On sale, claimed depreciation is recaptured at up to 25%, and gains may owe capital-gains tax (a 1031 exchange can defer both). Figures are a year-1 estimate at your 24.0% rate — not tax advice; consult a CPA.
Condition & rehab AI · 12 photos
This well-maintained mobile home is in good condition with recent updates, making it a solid investment for both resale and rental.
Value-add opportunities
- Both painting — fresh paint enhances curb appeal and interior aesthetics
- Both landscaping — improved landscaping can increase curb appeal and property value
- Both upgrading window treatments — modern window treatments can improve energy efficiency and aesthetics
Renovation cost estimate screening
Value-add ROI direction
- Both painting — fresh paint enhances curb appeal and interior aesthetics ↑
- Both landscaping — improved landscaping can increase curb appeal and property value ↑
- Both upgrading window treatments — modern window treatments can improve energy efficiency and aesthetics ↑
ⓘ Cost ranges are severity-bucket heuristics (US national rule-of-thumb). Get contractor quotes + a written scope before underwriting a rehab budget.
Schools (NCES district)
- District
- Glendale Union High School District (4285)
- NCES district ID
- 0403450
- Math proficiency
- 23% ▼ -38.00%
- Reading proficiency
- 31% ▼ -19.00%
- Median HH income
- $40,846
- Composite
- 22.81/100
- National rank
- #8020
- State rank
- #130 of 249 in AZ
Livability — Glendale
- Score
- 76/100
- State rank
- #12
- US rank
- #3235
Category grades
Schools grade is shown separately in the Schools card above.
Census & demographics
- Census place
- Glendale, AZ
- County
- Maricopa County · 4,537,380 people
- City population
- 294,586
- Metro
- Phoenix-Mesa-Chandler, AZ
- Population (ZIP)
- 68,178
- Household income
- $53,827
- Rent vs Own
- Severe rent burden
- 3741.0
Population outlook (Maricopa County) Hauer SSP2
- Today (2025)
- 4,979,203 people
- By 2030
- 5,378,229 · +8.0%
- By 2040
- 6,156,598 · +23.6%
- By 2050
- 6,872,376 · +38.0%
- By 2075
- 8,401,270 · +68.7%
- By 2100
- 9,247,439 · +85.7%
Race, ethnicity, and origin ACS 2023
- Neighborhood character
- Majority Hispanic (63%)
- Race & ethnicity
- Hispanic / Latino 63% Two or more races 37% White 22% Black 8% Asian 2% Native American 2%
- Hispanic origin (detail)
- Mexican 57% Cuban 1%
- Common ancestry
- Slovak 1% Italian 1%
- Foreign-born
- 26% · Canada, Vietnam, Philippines
- Languages at home
- 46% English-only · Spanish 48% Arabic 1% Other Indo-European 1%
Political lean MEDSL · Maricopa
- 2024 margin
- Toss-up / Even · D 47.7% · R 51.2% · Other 1.1%
- 2008→2024 swing
- +7.1pp toward D · 2008: -10.6pp · 2024: -3.5pp
- All cycles
- 2024: R+3.5 2020: D+2.2 2016: R+3.5 2012: R+12.0 2008: R+10.6
Not yet ingested
- Civics
- —
Market trends
- HPI YoY
- ▼ -50.49%
- Current HPI
- 427.3069
- Rent YoY
- ▼ -2.98%
- Metro
- Phoenix-Mesa-Chandler, AZ
- State GDP YoY
- ▲ 4.54%
- F500 in state
- 20
Industry mix (Fortune 500 HQ in AZ)
| Industry | F500 HQs | Revenue |
|---|---|---|
| Technology | 2 | $13B |
|
||
| Mining / Metals | 1 | $23B |
|
||
| Environmental Services | 1 | $16B |
|
||
| Metals / Steel | 1 | $14B |
|
||
| Technology Distribution | 1 | $9B |
|
||
| Homebuilding | 1 | $8B |
|
||
Price history
+12.2% since first listed5 events — show timeline
- 2026-04-17 Price Changed $129,000 ARMLS
- 2026-03-24 Listed $139,000 ARMLS
- 2025-06-11 Sold (MLS) $100,000 ARMLS
- 2025-05-21 Pending — ARMLS
- 2025-05-13 Listed $115,000 ARMLS
Cash-flow waterfall
monthlySold comps — $/sqft
last 12 mo · ≤1 miLoading sold comps…