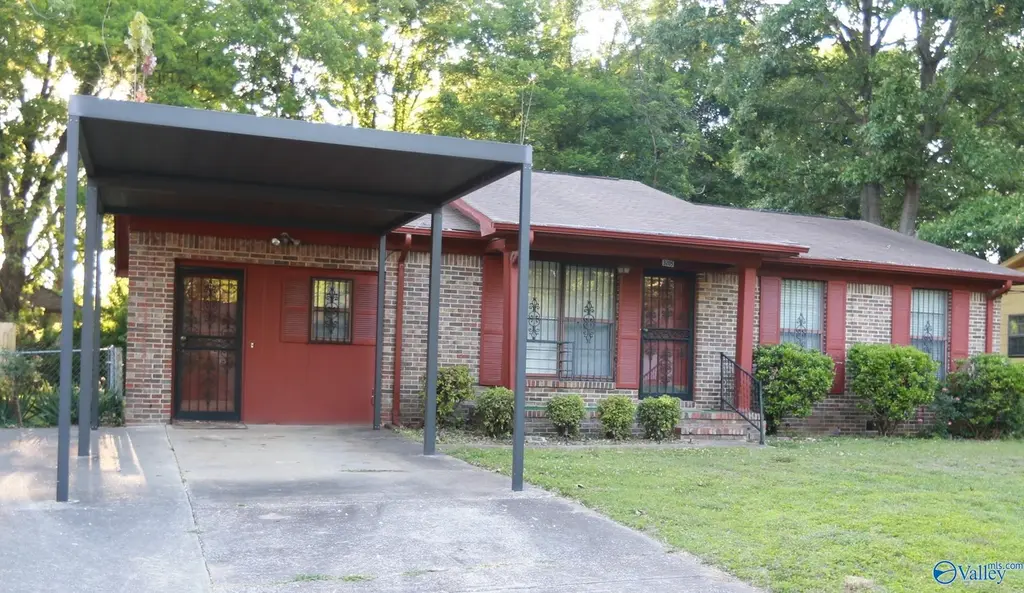
3205 Delicado Dr · Huntsville, AL
Flood risk 6/10 · Moderate
- FEMA flood zone
- X (unshaded)
- Chance of flooding over 30 yrs
- 0.71%
- Est. flood insurance / yr
- $507 – $1,088
Fire risk 1/10 · Minimal
- Est. fire insurance / yr
- $916 – $1,700
Heat risk 5/10 · Moderate
- Hot days now (above 105°F)
- 7 days/yr
- Hot days in 30 yrs
- 19 days/yr
Wind risk 4/10 · Minor
- Chance of severe wind over 30 yrs
- 16.0%
Air-quality risk 2/10 · Minimal
- Unhealthy air days now
- 1 days/yr
- Unhealthy air days in 30 yrs
- 1 days/yr
Risk factors via First Street. Map © Google.
Why this score? — see what drove the D+ grade
The composite is a weighted blend of 9 inputs, each scored 0–100. Each bar is that input's sub-score; the figure is the points it added to the 100-point composite (weight × sub-score).
- ARV discount +15.0/15.0
- Cash flow +13.4/30.0
- Livability +4.1/5.0
- DSCR +4.0/10.0
- 1% rule +3.8/10.0
- Schools +2.9/10.0
- Rent growth +2.5/5.0
- Condition / age +2.5/5.0
- Appreciation +0.0/10.0
$179,900
🖨 Deal sheet 📄 Offer letter ✓ Due diligence
Listing remarks
Welcome home to this charming full-brick property offering 1,440 square feet of comfortable living space! Featuring 3 bedrooms and 2 full baths, this home is perfect for a first-time home buyer or anyone looking for a great investment opportunity in a convenient location and great neighborhood. The property is being sold “As-Is” to include Paragraph 4(a), with no repairs to be made by the seller. Seller is not aware of any known defects or problems. Enjoy being located in a nice area close to shopping, restaurants, and everyday conveniences. With solid construction and great potential, this home is ready for its next owner to make it their own! Schedule your showing today!
Key facts
- Close to restaurants
- Solid construction
- Full-brick property
Tags
Property features AI
Finance
- HOA & community: No homeowners association
Exterior
- Parking: Concrete driveway
- Utilities: Public sewer
- Home design: Single-family residence; One-story; Built in 1968
- Construction: Brick construction
- Exterior features: Lot in the Grove Park subdivision
Interior
- Bathrooms: 2 full bathrooms
- Heating & cooling: Central heating; Central cooling
- Interior features: Crawl space basement
Neighborhood map
What this means for you Summary
Snapshot
- This is a 3-bed/2.0-bath single-family listed at $180k.
Deal economics
- At list price, monthly cash flow is $3 ($30/yr) — positive.
- The deal already cash-flows at list — no discount required.
- To meet the 1% rule (rent ≥ 1% of price), the offer needs to be $158k (12.3% below list).
- Recommended offer: $158k (12.3% below list) — sets the bar for 1% rule.
- Cap rate 6.3% vs local median 3.8% in Huntsville — top-decile yield for the area; either an underpriced asset or a hidden risk that comps aren't pricing in. Stress-test before assuming the spread holds.
Location & tenants
- Location reads 82/100 on livability (#3 in AL, #1,082 nationally) — a professional / high-income tenant draw. Strengths: commute A+, cost of living A+, housing A+; Watch: crime F.
- Huntsville City (urban): math 21% / reading 46% proficiency, ranked #48 of 129 in AL (top 37%) — families likely to look elsewhere, expect single-tenant / working-renter base with shorter leases.
- Zoned schools: Highlands Elementary School (math 2% / reading 27%, grade F, #508 of 627 statewide, top 84%, 371 students, 83% FRL); Jemison High School (math 12% / reading 12%, grade F, #242 of 305 statewide, top 80%, 843 students, 64% FRL) — zoned schools average 74% FRL vs 46% district-wide (28 pts higher); higher-poverty schools than district average — tighter screening recommended.
- Zoned-school proficiency averages 13% at this address vs 34% district-wide (-20 pts) — the specific schools serving this property underperform the Huntsville City average; the district grade overstates school quality for this exact location.
- Market conditions: Rents soft (-0.1%/yr); 337 active listings in the ZIP; 26 comparable units currently listed for rent nearby; rentals lingering (median 44d on market — plan ~5-8 weeks vacancy on turnover, expect pricing pressure); 54% of comp listings sitting > 30 days — soft ceiling on asking rent; 4,709 units permitted in Madison County in 2024 (1,186 in 5+ unit buildings).
- This rent runs 37% of the median local income ($51k/yr) — at the standard rent-burdened threshold; future hikes will face affordability resistance.
Forward outlook
- Local home prices are declining (-3.0%/yr); year-one equity from $1k of loan paydown is wiped out by about $5k of value loss. Plan a longer hold.
- Madison County population projected at +18% by 2050 — long-run rental-demand tailwind backs the buy-and-hold thesis.
Negotiation context
- It's been on market 22 days — a 2% lower offer ($177k) is reasonable based on typical stale-listing flexibility.
Risks & watch-outs
- Climate carrying-cost: major flood risk; extreme-heat days projected 7→19/yr by 2055 (HVAC capex compounding) — expect insurance premiums to compound above CPI over the hold.
Questions for the listing agent
- Built in 1968 — when were the roof, HVAC, electrical panel, plumbing, and water heater last replaced?
- Is there a deadline driving the sale (1031 exchange, divorce, estate, relocation)? That informs how much negotiation room exists.
- Crime grade is F in this area — have there been break-ins, vandalism, or insurance claims at this property in the last 3 years? What carrier currently insures it and at what premium?
- The area grade is low — what's the realistic commute time and amenity access for the typical tenant pool here? Any planned neighborhood developments (good or bad) we should know about?
- What's the average days-on-market for RENTAL listings here right now (not sales)? A rising rental-DOM trend means longer vacancies and softer asking-rent achievability than the comps imply.
- What's the recent tenant-quality profile in this submarket — average credit score on applications, eviction rate, late-payment / NSF rate, and stable-employment percentage? A property-management company in the area should have these aggregated.
- How much new for-sale + rental construction is in the pipeline within 1–3 miles? Heavy new supply typically softens prices + rents 12–24 months out; constrained supply supports both.
Investment metrics
- 1% rule
- 0.88% ✗
- Cap rate
- 6.31%
- Cash-on-cash
- 0.06%
- DSCR
- 1.00
- GRM
- 9.5
CMA / ARV
- ARV (on-the-fly)
- $220,320
- Comps found
- 12
Show comp detail 12 sales within ~0.75 mi
| Address | Dist | Beds/Ba | Sqft | Sold | Price | $/sf | Match |
|---|---|---|---|---|---|---|---|
| 3112 Delia Ln NW | 0.15mi | 4/2.0 (+1) | 1,458 (+1%) | 2mo | $223,000 | $153 | 84 |
| 3315 Delia Ln NW | 0.21mi | 3/2.0 | 1,442 (+0%) | 14mo | $171,000 | $119 | 78 |
| 3207 NW Delicado Dr | 0.01mi | 3/1.5 | 1,327 (-8%) | 14mo | $159,900 | $120 | 73 |
| 2705 Trail Ridge Rd | 0.49mi | 3/2.0 | 1,408 (-2%) | 8mo | $151,000 | $107 | 67 |
| 2709 Trail Ridge Rd | 0.47mi | 3/2.0 | 1,450 (+1%) | 15mo | $229,000 | $158 | 65 |
| 3314 Clifford Rd NW | 0.33mi | 3/2.0 | 1,323 (-8%) | 10mo | $199,000 | $150 | 63 |
| 2622 Dry Creek Dr | 0.55mi | 3/2.0 | 1,414 (-2%) | 11mo | $220,000 | $156 | 63 |
| 3116 Gayhart Dr NW | 0.56mi | 3/2.0 | 1,370 (-5%) | 9mo | $145,000 | $106 | 58 |
| 3304 NW Watson Dr | 0.39mi | 3/1.5 | 1,291 (-10%) | 6mo | $190,700 | $148 | 57 |
| 3502 Lucretia NW | 0.56mi | 3/1.5 | 1,537 (+7%) | 15mo | $240,000 | $156 | 48 |
| 3606 Maggie Ave NW | 0.70mi | 3/2.0 | 1,556 (+8%) | 16mo | $239,900 | $154 | 41 |
| 3520 Maggie Ave | 0.55mi | 4/2.5 (+1) | 1,620 (+12%) | 13mo | $255,000 | $157 | 36 |
Match score weights: distance 35% · size 25% · config 20% · recency 20%. Top-matched comps best support the ARV.
Projected returns pro-forma
-3.0% appreciation · 0.0% rent growth · sell at horizon
- IRR
- -19.6%
- Equity multiple
- 0.33×
- Total profit
- $-33,589
- Equity at exit
- $26,824
- IRR
- -20.5%
- Equity multiple
- 0.07×
- Total profit
- $-46,805
- Equity at exit
- $15,554
Cash invested: $50,372 (down + closing). Projections, not guarantees.
Landlord ↔ Tenant lean methodology
- Overall (STATE)
- 90 Strongly Landlord-Friendly
- State Alabama
- 90 Strongly Landlord-Friendly · R+15
- County
- — inherits STATE
- City
- — inherits STATE
ZIP-level market 35810
- Home prices YoY
- -23.5%
- Rents YoY
- -0.1%
- Active inventory
- 337
- Price-to-rent
- 9.5×
Monthly cashflow live
- Estimated rent
- $1,577 high interval (Pro) →
- Mortgage (P&I)
- −$943
- Tax est. 1.5%
- −$225 /mo · $2,698/yr
- Insurance
- −$75
- HOA
- −$0
- Vacancy / Maint / Mgmt
- −$331
- Net cashflow
- $3
Break-even live
UW: 25.0% down · 7.5% · 30yr · 1.5% tax · 5.0% vac · 8.0% maint · 8.0% mgmt
Financing live
Cash to close
- Down payment
- $44,975
- Closing costs
- $5,397
- Reserves months
- —
- Total cash needed
- —
Loan-product check · same deal, 3 products live
Conventional
25% down · 7.5% · 30yr
- Down + closing
- —
- Monthly P&I
- —
- Monthly cashflow
- —
- DSCR
- —
- Eligible?
- —
Personal DTI + credit; lowest rate.
DSCR
20% down · 8.5% · 30yr
- Down + closing
- —
- Monthly P&I
- —
- Monthly cashflow
- —
- DSCR
- —
- Eligible?
- —
No personal income docs; deal must DSCR.
Hard money
10% down · 12.0% · 12mo
- Down + closing
- —
- Monthly P&I
- —
- Monthly cashflow
- —
- DSCR
- —
- Eligible?
- —
Short-term bridge; refi at stabilization.
Rent comps 26 comps
| Address | Beds | Baths | Sqft | Rent | $/sqft | DOM | Units | Dist |
|---|---|---|---|---|---|---|---|---|
| 3304 Buttrey Dr NW Huntsville, AL | 4.0 | 2.0 | 1656 | $1,681 | $1.02 | 23d | 1 | 0.34mi |
| 3100 Gayhart Dr NW Huntsville, AL | 3.0 | 1.0 | 1050 | $1,298 | $1.24 | 43d | 1 | 0.55mi |
| 3423 Rosedale Dr NW Huntsville, AL | 3.0 | 1.0 | 1145 | $1,000 | $0.87 | 43d | 1 | 0.62mi |
| 6008 Ellington Rd NW Huntsville, AL | 4.0 | 2.5 | 1845 | $1,595 | $0.86 | 43d | 1 | 0.63mi |
| 2505 Piney Branch Rd NW Huntsville, AL | 3.0 | 1.5 | 1222 | $1,300 | $1.06 | 23d | 1 | 0.77mi |
| 2508 Piney Branch Rd NW Huntsville, AL | 3.0 | 1.5 | 1205 | $1,385 | $1.15 | 43d | 1 | 0.78mi |
| 4700 Sparkman Dr NW Huntsville, AL | 3.0 | 1.5 | 1554 | $1,350 | $0.87 | 23d | 1 | 0.78mi |
| 4214 Fortson Ln NW Huntsville, AL | 3.0 | 2.0 | 1308 | $1,395 | $1.07 | 43d | 1 | 1.00mi |
| 3210 Caywood Dr NW Huntsville, AL | 3.0 | 1.0 | 1005 | $1,475 | $1.47 | 14d | 1 | 1.04mi |
| 3304 Caywood Dr NW Huntsville, AL | 3.0 | 1.5 | 1300 | $1,475 | $1.13 | 23d | 1 | 1.06mi |
| 4706 Whitehall Dr NW Huntsville, AL | 3.0 | 2.0 | 1469 | $1,550 | $1.06 | 21d | 1 | 1.06mi |
| 3415 Mimosa Ln NW Huntsville, AL | 3.0 | 2.0 | 1320 | $1,590 | $1.20 | 43d | 1 | 1.09mi |
| 3210 Tucker Dr NW Huntsville, AL | 3.0 | 1.0 | 1005 | $1,475 | $1.47 | 14d | 1 | 1.19mi |
| 2215 Shady Lane Dr NW Huntsville, AL | 4.0 | 1.0 | 1450 | $1,500 | $1.03 | 43d | 1 | 1.20mi |
| 1725 Millican Pl NW Huntsville, AL | 3.0 | 2.0 | 1200 | $1,295 | $1.08 | 43d | 1 | 1.24mi |
| 4216 Chalet Cir NW Huntsville, AL | 3.0 | 2.0 | 1296 | $1,500 | $1.16 | 23d | 1 | 1.27mi |
| 3803 Mastin Lake Rd NW Huntsville, AL | 3.0 | 1.0 | 1103 | $1,295 | $1.17 | 43d | 1 | 1.29mi |
| 2201 Shady Lane Dr NW Huntsville, AL | 3.0 | 1.5 | 1472 | $3,000 | $2.04 | 43d | 1 | 1.31mi |
| 3203 Dyas Dr NW Huntsville, AL | 3.0 | 2.0 | 1346 | $2,100 | $1.56 | 23d | 1 | 1.31mi |
| 3614 Wilbur Ave NW Huntsville, AL | 3.0 | 1.5 | 1196 | $1,420 | $1.19 | 23d | 1 | 1.35mi |
| 3721 Broadmor Rd NW Huntsville, AL | 3.0 | 1.5 | 1423 | $1,450 | $1.02 | 43d | 1 | 1.38mi |
| 3616 Hester Ln NW Huntsville, AL | 4.0 | 2.0 | 1650 | $1,350 | $0.82 | 43d | 1 | 1.39mi |
| 1801 Carson Ln NW Huntsville, AL | 3.0 | 3.0 | 1405 | $2,000 | $1.42 | 14d | 1 | 1.41mi |
| 1601 Sparkman Dr NW Unit 108 Huntsville, AL | 2.0 | 2.0 | 1072 | $950 | $0.89 | 43d | 1 | 1.47mi |
| 5001 7 Pine Cir Unit 1 Huntsville, AL | 2.0 | 2.0 | 1060 | $1,400 | $1.32 | 43d | 1 | 1.48mi |
| 3306 Reynolds Dr NW Huntsville, AL | 3.0 | 2.0 | 1636 | $1,800 | $1.10 | 23d | 1 | 1.50mi |
Listing history 15 events
-
2026-06-18days on market $179,900 Active 22 DOM
-
2026-06-17days on market $179,900 Active 21 DOM
-
2026-06-16days on market $179,900 Active 20 DOM
-
2026-06-15days on market $179,900 Active 19 DOM
-
2026-06-14days on market $179,900 Active 17 DOM
-
2026-06-10days on market $179,900 Active 14 DOM
-
2026-06-09days on market $179,900 Active 13 DOM
-
2026-06-08days on market $179,900 Active 12 DOM
-
2026-06-07days on market $179,900 Active 11 DOM
-
2026-06-03days on market $179,900 Active 7 DOM
-
2026-06-02days on market $179,900 Active 6 DOM
-
2026-06-01days on market $179,900 Active 5 DOM
-
2026-05-31days on market $179,900 Active 4 DOM
-
2026-05-30days on market $179,900 Active 3 DOM
-
2026-05-27$179,900 Active
ⓘ Source: listings_history table (triggers on properties + properties_extension) + one-shot
backfill from property_details.listing_events for pre-trigger history.
Climate risk First Street
- Flood 6/10 Major FEMA zone X (unshaded) · 71% chance over 30 yrs
- Wildfire 1/10 Low
- Heat 5/10 Major 7 d/yr ≥105°F today · 19 d/yr by 30 yrs out
- Wind 4/10 Moderate 16% chance of damaging wind over 30 yrs
- Air quality 2/10 Low 1 unhealthy d/yr today · 1 by 30 yrs out
Nearby sold comps map
Loading sold comps map…
Walkable amenities ~0.75 mi
Loading nearby amenities…
Taxation est. · year 1
- Rental income
- $18,923
- − Mortgage interest
- −$10,077
- − Property taxes
- −$2,698
- − Insurance
- −$900
- − Repairs & maintenance
- −$1,514
- − Management
- −$1,514
- − Depreciation
- −$5,233
- Taxable loss
- −$3,013
- Est. tax savings @ 24.0%
- +$723
- After-tax cash flow
- $753/yr
For passive investors: Depreciation is non-cash, so a rental often shows a tax loss while cash-flowing — sheltering income. Rental losses are passive: they offset passive income freely, and up to $25,000/yr can offset ordinary (W-2) income if you actively participate and your MAGI is under $100k (phasing out to $0 by $150k); unused losses carry forward. On sale, claimed depreciation is recaptured at up to 25%, and gains may owe capital-gains tax (a 1031 exchange can defer both). Figures are a year-1 estimate at your 24.0% rate — not tax advice; consult a CPA.
Schools (NCES district)
- District
- Huntsville City
- NCES district ID
- 0101800
- Math proficiency
- 21% ▼ -23.00%
- Reading proficiency
- 46% ▬ 0.00%
- Median HH income
- $48,264
- Composite
- 28.84/100
- National rank
- #6647
- State rank
- #48 of 129 in AL
Livability — Huntsville
- Score
- 82/100
- State rank
- #3
- US rank
- #1082
Category grades
Schools grade is shown separately in the Schools card above.
Census & demographics
- Census place
- Huntsville, AL
- County
- Madison County · 380,832 people
- City population
- 220,435
- Metro
- Huntsville, AL
- Population (ZIP)
- 32,843
- Household income
- $51,233
- Rent vs Own
- Severe rent burden
- 1223.0
Population outlook (Madison County) Hauer SSP2
- Today (2025)
- 392,086 people
- By 2030
- 409,788 · +4.5%
- By 2040
- 440,557 · +12.4%
- By 2050
- 460,990 · +17.6%
- By 2075
- 502,872 · +28.3%
- By 2100
- 513,623 · +31.0%
Race, ethnicity, and origin ACS 2023
- Neighborhood character
- Predominantly Black (69%)
- Race & ethnicity
- Black 69% White 18% Hispanic / Latino 9% Two or more races 5%
- Hispanic origin (detail)
- Mexican 3% Puerto Rican 2% Dominican 2%
- Common ancestry
- Italian 2% Lithuanian 0%
- Foreign-born
- 6% · Canada
- Languages at home
- 92% English-only · Spanish 7%
Political lean MEDSL · Madison
- 2024 margin
- Lean R (+9.0) · D 44.7% · R 53.7% · Other 1.6%
- 2008→2024 swing
- +6.0pp toward D · 2008: -14.9pp · 2024: -9.0pp
- All cycles
- 2024: R+9.0 2020: R+8.0 2016: R+16.8 2012: R+18.7 2008: R+14.9
Not yet ingested
- Civics
- —
Market trends
- HPI YoY
- ▼ -61.00%
- Current HPI
- 198.9629
- Rent YoY
- ▬ -0.05%
- Metro
- Huntsville, AL
- State GDP YoY
- ▲ 2.94%
- F500 in state
- 4
Industry mix (Fortune 500 HQ in AL)
| Industry | F500 HQs | Revenue |
|---|---|---|
| Financial Services | 1 | $8B |
|
||
| Healthcare | 1 | $5B |
|
||
Price history
1 event — show timeline
- 2026-05-27 Listed $179,900 VMLS
Cash-flow waterfall
monthlySold comps — $/sqft
last 12 mo · ≤1 miLoading sold comps…