 Duplex
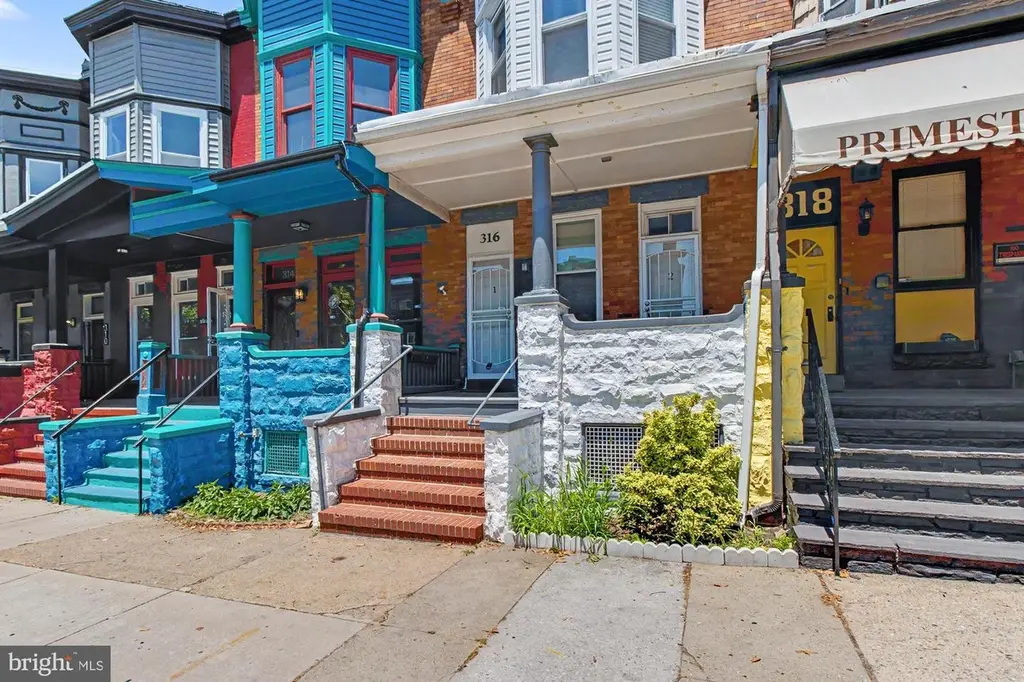
316 E 25th St · Baltimore, MD
Flood risk 4/10 · Minor
- FEMA flood zone
- X (unshaded)
- Chance of flooding over 30 yrs
- 0.22%
- Est. flood insurance / yr
- $473 – $860
Fire risk 1/10 · Minimal
- Est. fire insurance / yr
- $755 – $1,403
Heat risk 7/10 · Major
- Hot days now (above 103°F)
- 7 days/yr
- Hot days in 30 yrs
- 15 days/yr
Wind risk 6/10 · Moderate
- Chance of severe wind over 30 yrs
- 27.0%
Air-quality risk 4/10 · Minor
- Unhealthy air days now
- 6 days/yr
- Unhealthy air days in 30 yrs
- 7 days/yr
Risk factors via First Street. Map © Google.
Why this score? — see what drove the D grade
The composite is a weighted blend of 9 inputs, each scored 0–100. Each bar is that input's sub-score; the figure is the points it added to the 100-point composite (weight × sub-score).
- Cash flow +16.0/30.0
- ARV discount +7.5/15.0
- DSCR +4.9/10.0
- 1% rule +3.9/10.0
- Livability +3.8/5.0
- Rent growth +2.9/5.0
- Condition / age +2.5/5.0
- Schools +1.0/10.0
- Appreciation +0.0/10.0
$289,000
🖨 Deal sheet 📄 Offer letter ✓ Due diligence
Multi-family units
County records classify this as Multi-Family (2-4 Unit). Listing-text estimate: 2 units. confirmed
Listing remarks MLS
Exceptional investment opportunity or ideal owner-occupant property in the heart of Lower Charles Village! This beautifully renovated duplex offers two separate living spaces and has been extensively updated with new HVAC systems, upgraded plumbing, and updated electrical throughout. Conveniently located near Penn Station, Johns Hopkins University, MICA, Union Memorial Hospital, restaurants, shopping, and major commuter routes, this property combines modern updates with an unbeatable location. The main-level unit welcomes you through a charming covered front porch and features stylish wood flooring throughout, a spacious living room, and an updated kitchen complete with granite countertops, stainless steel appliances, and ample cabinet space. The generously sized bedroom offers direct access to the rear yard, while the renovated full bath showcases attractive tile finishes. An unfinished basement provides abundant storage space and includes a newer stackable front-loading washer and dryer. The upper-level unit features its own private entrance and offers a bright, open layout with wood flooring throughout. The spacious living area leads to a large primary bedroom highlighted by recessed lighting and bay windows that fill the space with natural light. A second room provides the perfect setup for a home office, guest room, or den. The updated full bath features a tiled shower, and the unit also includes its own stackable washer and dryer for added convenience. The upper-level unit is currently tenant occupied, generating $1,200 per month in rental income with a lease in place through March 2027, providing immediate cash flow for investors. Whether you're looking to live in one unit while offsetting your mortgage with rental income, expand your investment portfolio, or create a flexible multigenerational living arrangement, this turnkey property offers outstanding value and versatility in one of Baltimore City's most desirable neighborhoods.
Key facts
- Covered front porch
- Updated electrical
- Renovated duplex
Tags
Neighborhood map
What this means for you Summary
Snapshot
- This is a 2 × 1-bed/1.0-bath units multifamily listed at $289k.
Deal economics
- At list price, monthly cash flow is $142 ($2k/yr) — positive. Per door: $71/mo.
- The deal already cash-flows at list — no discount required.
- To meet the 1% rule (rent ≥ 1% of price), the offer needs to be $257k (11.0% below list).
- Recommended offer: $257k (11.0% below list) — sets the bar for 1% rule.
Location & tenants
- Location reads 76/100 on livability (#90 in MD, #3,396 nationally) — a middle-class / working-renter tenant base. Strengths: amenities A+, commute A+, housing A+; Watch: schools D, crime F.
- Baltimore City Public Schools (urban): math 7% / reading 16% proficiency, ranked #24 of 24 in MD (top 100%) — low school quality limits family demand, transient renter base, plan for 1-2y turnover; 79% free/reduced lunch — lower-income household profile, screen leases tightly.
- Market conditions: Rents rising (+1.6%/yr); 325 active listings in the ZIP; 40 comparable units currently listed for rent nearby; rentals at typical pace (median 24d on market — plan ~3-4 weeks tenant-placement turnaround); 1,273 units permitted in Baltimore city in 2024 (1,104 in 5+ unit buildings).
- At $2,573/mo this rent would consume 49% of the median local household income ($62k/yr) (locally 2564% of renters already pay >50% of income on rent) — very limited rent-growth headroom before tenants either downsize or default.
Forward outlook
- Local home prices are declining (-3.0%/yr); year-one equity from $2k of loan paydown is wiped out by about $9k of value loss. Plan a longer hold.
- Baltimore County population projected to shrink 4% by 2050 — rents likely to lag national; underwrite the cash flow, not the appreciation.
Negotiation context
- Only 12 days on market — expect competitive offers; lowballing is unlikely to land.
- 9 sale attempts since 15y ago with the ask held roughly flat each time — persistent listings suggest the price (not the market) is what's stuck; bring a comps-based counter.
- Current owner paid $248k; 17% above their basis — modest negotiation headroom, anchor on the comps not their cost.
Risks & watch-outs
- Watch-outs: built in 1900 — expect roof / HVAC / electrical / plumbing capex.
- Climate carrying-cost: major wind risk, 27% chance of damaging wind over 30y; extreme-heat days projected 7→15/yr by 2055 (HVAC capex compounding) — expect insurance premiums to compound above CPI over the hold.
Questions for the listing agent
- Can we see the unit-by-unit rent roll, current vacancy, and any below-market leases? What's the average tenancy length?
- What capital expenditures (roof, boiler, parking lot, exteriors) have been made in the last 5 years, and what's planned in the next 2?
- Built in 1900 — when were the roof, HVAC, electrical panel, plumbing, and water heater last replaced?
- Is there a deadline driving the sale (1031 exchange, divorce, estate, relocation)? That informs how much negotiation room exists.
- Schools are D-rated, which usually means shorter tenancies and higher turnover. Who's the typical renter profile here, and what's been the actual vacancy rate?
- Crime grade is F in this area — have there been break-ins, vandalism, or insurance claims at this property in the last 3 years? What carrier currently insures it and at what premium?
- The area grade is low — what's the realistic commute time and amenity access for the typical tenant pool here? Any planned neighborhood developments (good or bad) we should know about?
- What's the average days-on-market for RENTAL listings here right now (not sales)? A rising rental-DOM trend means longer vacancies and softer asking-rent achievability than the comps imply.
- What's the recent tenant-quality profile in this submarket — average credit score on applications, eviction rate, late-payment / NSF rate, and stable-employment percentage? A property-management company in the area should have these aggregated.
- How much new apartment / multifamily construction is in the pipeline within 1–3 miles? Heavy new supply (>2% of stock underway) typically softens rents 12–24 months out; light construction supports rent growth.
Investment metrics
- 1% rule
- 0.89% ✗
- Cap rate
- 6.88%
- Cash-on-cash
- 2.10%
- DSCR
- 1.09
- GRM
- 9.4
CMA / ARV
No comps found within radius.
Projected returns pro-forma
-3.0% appreciation · 1.63% rent growth · sell at horizon
- IRR
- -14.5%
- Equity multiple
- 0.49×
- Total profit
- $-41,342
- Equity at exit
- $43,091
- IRR
- -8.0%
- Equity multiple
- 0.52×
- Total profit
- $-38,469
- Equity at exit
- $24,987
Cash invested: $80,920 (down + closing). Projections, not guarantees.
Landlord ↔ Tenant lean methodology
- Overall (CITY)
- 12 Strongly Tenant-Friendly
- State Maryland
- 27 Tenant-Leaning · D+14
- County
- — inherits STATE
- City Baltimore
- 12 Strongly Tenant-Friendly · D+58
ZIP-level market 21218
- Rents YoY
- 1.6%
- Active inventory
- 325
- Price-to-rent
- 18.7×
Monthly cashflow live
- Estimated rent
- $2,573 high interval (Pro) →
- Mortgage (P&I)
- −$1,516
- Tax from tax record
- −$255 /mo · $3,062/yr
- Insurance
- −$120
- HOA
- −$0
- Vacancy / Maint / Mgmt
- −$540
- Net cashflow
- $142
Break-even live
2-unit breakdown (identical units grouped — click to expand)
| Units | Beds | Baths | Est. rent |
|---|---|---|---|
| 2× units | 1 | 1 | $2,574 |
| #1 | 1 | 1 | $1,287 |
| #2 | 1 | 1 | $1,287 |
| Total (2 units) | $2,573 | ||
UW: 25.0% down · 7.5% · 30yr · 1.5% tax · 5.0% vac · 8.0% maint · 8.0% mgmt
Financing live
Cash to close
- Down payment
- $72,250
- Closing costs
- $8,670
- Reserves months
- —
- Total cash needed
- —
Loan-product check · same deal, 3 products live
Conventional
25% down · 7.5% · 30yr
- Down + closing
- —
- Monthly P&I
- —
- Monthly cashflow
- —
- DSCR
- —
- Eligible?
- —
Personal DTI + credit; lowest rate.
DSCR
20% down · 8.5% · 30yr
- Down + closing
- —
- Monthly P&I
- —
- Monthly cashflow
- —
- DSCR
- —
- Eligible?
- —
No personal income docs; deal must DSCR.
Hard money
10% down · 12.0% · 12mo
- Down + closing
- —
- Monthly P&I
- —
- Monthly cashflow
- —
- DSCR
- —
- Eligible?
- —
Short-term bridge; refi at stabilization.
Rent comps 40 comps
| Address | Beds | Baths | Sqft | Rent | $/sqft | DOM | Units | Dist |
|---|---|---|---|---|---|---|---|---|
| 312 E 25th St Baltimore, MD | 4.0 | 3.5 | 1960 | $2,800 | $1.43 | 43d | 1 | 0.03mi |
| 411 E Lorraine Ave Baltimore, MD | 3.0 | 1.5 | 1344 | $2,200 | $1.64 | 24d | 1 | 0.15mi |
| 400 E Lorraine Ave Baltimore, MD | 3.0 | 1.0 | 1500 | $1,800 | $1.20 | 20d | 1 | 0.16mi |
| 324 E 23rd St Baltimore, MD | 3.0 | 1.5 | 2018 | $2,200 | $1.09 | 24d | 1 | 0.16mi |
| 428 E Lorraine Ave Baltimore, MD | 3.0 | 2.0 | 1344 | $1,875 | $1.40 | 24d | 1 | 0.18mi |
| 428 E Lorraine Ave Unit 1 Baltimore, MD | 3.0 | 1.5 | 1344 | $1,875 | $1.40 | 43d | 1 | 0.18mi |
| 450 E Lorraine Ave Baltimore, MD | 3.0 | 1.0 | 1344 | $1,695 | $1.26 | 43d | 1 | 0.19mi |
| 534 E 23rd St Baltimore, MD | 3.0 | 2.5 | 1700 | $2,350 | $1.38 | 43d | 1 | 0.25mi |
| 402 E 28th St Baltimore, MD | 3.0 | 1.0 | 1436 | $2,200 | $1.53 | 43d | 1 | 0.31mi |
| 420 E 28th St Unit 1 Baltimore, MD | 5.0 | 2.5 | 1600 | $2,600 | $1.62 | 4d | 1 | 0.31mi |
| 7 W 24th St Unit 1 Baltimore, MD | 5.0 | 2.5 | 1443 | $2,395 | $1.66 | 20d | 1 | 0.32mi |
| 519 E 28th St Baltimore, MD | 3.0 | 2.0 | 1500 | $2,000 | $1.33 | 4d | 1 | 0.34mi |
| 424 Ilchester Ave Baltimore, MD | 3.0 | 3.0 | 1976 | $1,800 | $0.91 | 14d | 1 | 0.35mi |
| 2641 N Howard St Baltimore, MD | 4.0 | 3.5 | 1344 | $2,800 | $2.08 | 24d | 1 | 0.44mi |
| 719 E 20th St Baltimore, MD | 5.0 | 3.0 | 2060 | $2,400 | $1.17 | 2d | 1 | 0.45mi |
| 719 E 20th St Baltimore, MD | 5.0 | 3.5 | 2060 | $3,000 | $1.46 | 24d | 1 | 0.45mi |
| 3010 Guilford Ave Baltimore, MD | 5.0 | 2.5 | 2174 | $3,980 | $1.83 | 11d | 1 | 0.49mi |
| 325 W Lorraine Ave Baltimore, MD | 3.0 | 1.0 | 1470 | $3,150 | $2.14 | 4d | 1 | 0.49mi |
| 1827 Guilford Ave Unit G-1809 Baltimore, MD | 3.0 | 3.5 | 1920 | $2,750 | $1.43 | 24d | 1 | 0.51mi |
| 1823 Guilford Ave Unit G-1823 Baltimore, MD | 3.0 | 3.5 | 1920 | $2,750 | $1.43 | 43d | 1 | 0.52mi |
| 1813 Guilford Ave Unit G-1813 Baltimore, MD | 3.0 | 3.5 | 1920 | $2,750 | $1.43 | 43d | 1 | 0.53mi |
| 1809 Guilford Ave Unit G-1809 Baltimore, MD | 3.0 | 3.5 | 1920 | $2,750 | $1.43 | 43d | 1 | 0.53mi |
| 1807 Guilford Ave Unit G-1807 Baltimore, MD | 3.0 | 3.5 | 1920 | $2,750 | $1.43 | 43d | 1 | 0.53mi |
| 1801 Guilford Ave Baltimore, MD | 3.0 | 3.5 | 1921 | $2,595 | $1.35 | 24d | 3 | 0.54mi |
| 412 E Lanvale St Baltimore, MD | 3.0 | 2.0 | 1600 | $3,100 | $1.94 | 4d | 1 | 0.62mi |
| 616 Montpelier St Baltimore, MD | 3.0 | 1.0 | 1150 | $1,750 | $1.52 | 11d | 1 | 0.62mi |
| 315 W 30th St Baltimore, MD | 3.0 | 3.0 | 1250 | $2,450 | $1.96 | 16d | 1 | 0.69mi |
| 315 W 30th St Baltimore, MD | 3.0 | 3.0 | 1200 | $2,450 | $2.04 | 18d | 1 | 0.69mi |
| 348 E University Pkwy Baltimore, MD | 4.0 | 2.0 | 1809 | $2,400 | $1.33 | 43d | 1 | 0.75mi |
| 305 W 31st St Baltimore, MD | 4.0 | 2.0 | 1500 | $2,499 | $1.67 | 43d | 1 | 0.75mi |
| 1333 E North Ave Baltimore, MD | 4.0 | 2.5 | 1860 | $2,200 | $1.18 | 24d | 1 | 0.79mi |
| 3222 Ellerslie Ave Baltimore, MD | 4.0 | 1.5 | 1550 | $1,950 | $1.26 | 43d | 1 | 0.80mi |
| 3501 Saint Paul St Baltimore, MD | 3.0 | 1.0–2.5 | 916 | $2,700 | $2.95 | 1d | 172 | 0.84mi |
| 3421 University Pl Baltimore, MD | 5.0 | 2.0 | 1960 | $3,500 | $1.79 | 24d | 1 | 0.84mi |
| 1243 E Lanvale St Baltimore, MD | 3.0 | 1.5 | 1281 | $1,750 | $1.37 | 2d | 1 | 0.85mi |
| 1243 E Lanvale St Baltimore, MD | 3.0 | 1.5 | 1281 | $1,750 | $1.37 | 16d | 1 | 0.85mi |
| 103 E Mt Royal Ave Baltimore, MD | 1.0–3.0 | 1.0–2.0 | 850 | $2,624 | $3.09 | 1d | 17 | 0.88mi |
| 1607 Cliftview Ave Baltimore, MD | 3.0 | 1.0 | 1200 | $1,475 | $1.23 | 43d | 1 | 0.90mi |
| 1301 Saint Paul St Baltimore, MD | 3.0 | 1.0–3.0 | 1050 | $2,399 | $2.28 | 43d | 1 | 0.92mi |
| 1512 E Lafayette Ave Baltimore, MD | 3.0 | 2.5 | 1476 | $1,950 | $1.32 | 43d | 1 | 0.92mi |
Listing history 9 events
-
2026-06-18days on market $289,000 Active 12 DOM
-
2026-06-17days on market $289,000 Active 11 DOM
-
2026-06-16days on market $289,000 Active 10 DOM
-
2026-06-15days on market $289,000 Active 9 DOM
-
2026-06-13days on market $289,000 Active 7 DOM
-
2026-06-09days on market $289,000 Active 3 DOM
-
2026-06-08days on market $289,000 Active 2 DOM
-
2026-06-07remarks 699-char remark
-
2026-06-07$289,000 Active 1 DOM
ⓘ Source: listings_history table (triggers on properties + properties_extension) + one-shot
backfill from property_details.listing_events for pre-trigger history.
Tax reassessment forecast MD · Partial reset (capped growth)
- Current annual tax
- $3,062 · $255/mo
- Projected year-2 tax
- $3,106 · $259/mo
- Expected delta
- +$44/yr (+$4/mo · 1.4%)
ⓘ Screening estimate from a state-policy table — verify with the county assessor before closing.
Climate risk First Street
- Flood 4/10 Moderate FEMA zone X (unshaded) · 22% chance over 30 yrs
- Wildfire 1/10 Low
- Heat 7/10 Severe 7 d/yr ≥103°F today · 15 d/yr by 30 yrs out
- Wind 6/10 Major 27% chance of damaging wind over 30 yrs
- Air quality 4/10 Moderate 6 unhealthy d/yr today · 7 by 30 yrs out
Nearby sold comps map
Loading sold comps map…
Walkable amenities ~0.75 mi
Loading nearby amenities…
Taxation est. · year 1
- Rental income
- $30,876
- − Mortgage interest
- −$16,188
- − Property taxes
- −$3,062
- − Insurance
- −$1,445
- − Repairs & maintenance
- −$2,470
- − Management
- −$2,470
- − Depreciation
- −$8,407
- Taxable loss
- −$3,167
- Est. tax savings @ 24.0%
- +$760
- After-tax cash flow
- $2,458/yr
For passive investors: Depreciation is non-cash, so a rental often shows a tax loss while cash-flowing — sheltering income. Rental losses are passive: they offset passive income freely, and up to $25,000/yr can offset ordinary (W-2) income if you actively participate and your MAGI is under $100k (phasing out to $0 by $150k); unused losses carry forward. On sale, claimed depreciation is recaptured at up to 25%, and gains may owe capital-gains tax (a 1031 exchange can defer both). Figures are a year-1 estimate at your 24.0% rate — not tax advice; consult a CPA.
Schools (NCES district)
- District
- Baltimore City Public Schools
- NCES district ID
- 2400090
- Math proficiency
- 7% ▼ -9.00%
- Reading proficiency
- 16% ▼ -5.00%
- Median HH income
- $42,108
- Composite
- 10.08/100
- National rank
- #9805
- State rank
- #24 of 24 in MD
Livability — Baltimore
- Score
- 76/100
- State rank
- #90
- US rank
- #3396
Category grades
Schools grade is shown separately in the Schools card above.
Census & demographics
- Census place
- Baltimore, MD
- County
- Baltimore City · 558,601 people
- City population
- 588,727
- Metro
- Baltimore-Columbia-Towson, MD
- Population (ZIP)
- 44,014
- Household income
- $62,488
- Rent vs Own
- Severe rent burden
- 2564.0
Population outlook (Baltimore County) Hauer SSP2
- Today (2025)
- 624,249 people
- By 2030
- 621,541 · -0.4%
- By 2040
- 609,756 · -2.3%
- By 2050
- 597,249 · -4.3%
- By 2075
- 552,236 · -11.5%
- By 2100
- 513,934 · -17.7%
Race, ethnicity, and origin ACS 2023
- Neighborhood character
- Diverse neighborhood (Simpson 0.58)
- Race & ethnicity
- Black 60% White 26% Two or more races 6% Hispanic / Latino 5% Asian 5%
- Hispanic origin (detail)
- Common ancestry
- Romanian 2% Italian 1% Scotch-Irish 1%
- Foreign-born
- 10% · Canada, China, South Korea
- Languages at home
- 87% English-only · Spanish 4% French/Haitian/Cajun 2% Chinese 2%
Political lean MEDSL · Baltimore
- 2024 margin
- Solid D (+73.0) · D 85.2% · R 12.2% · Other 2.6%
- 2008→2024 swing
- -2.5pp toward R · 2008: 75.5pp · 2024: 73.0pp
- All cycles
- 2024: D+73.0 2020: D+76.6 2016: D+74.6 2012: D+76.4 2008: D+75.5
Not yet ingested
- Civics
- —
Market trends
- HPI YoY
- ▼ -463.14%
- Current HPI
- 292.3986
- Rent YoY
- ▲ 1.63%
- Metro
- Baltimore-Columbia-Towson, MD
- State GDP YoY
- ▲ 2.97%
- F500 in state
- 12
Industry mix (Fortune 500 HQ in MD)
| Industry | F500 HQs | Revenue |
|---|---|---|
| Aerospace / Defense | 1 | $71B |
|
||
| Utilities | 1 | $25B |
|
||
| Hotels | 1 | $24B |
|
||
| Consumer Goods | 1 | $7B |
|
||
| Real Estate | 1 | $6B |
|
||
| Chemicals | 1 | $2B |
|
||
Price history
+313.4% since first listed24 events — show timeline
- 2026-06-06 Listed $289,000 BRIGHT MLS
- 2020-07-01 Sold (Public Records) $248,000 Public Records
- 2020-04-27 Sold (MLS) $248,000 BRIGHT MLS
- 2020-03-24 Pending — BRIGHT MLS
- 2020-03-16 Listed $248,000 BRIGHT MLS
- 2019-04-17 Sold (MLS) $92,784 BRIGHT MLS
- 2019-04-10 Pending — BRIGHT MLS
- 2019-03-27 Contingent — BRIGHT MLS
- 2019-03-26 Relisted — BRIGHT MLS
- 2019-03-21 Contingent — BRIGHT MLS
- 2019-03-11 Listed $109,000 BRIGHT MLS
- 2013-09-05 Delisted — MRIS
- 2013-09-05 Listing Removed — BRIGHT MLS
- 2012-05-22 Listed — MRIS
- 2012-05-22 Listed $139,999 BRIGHT MLS
- 2011-10-18 Sold (Public Records) $60,000 Public Records
- 2011-08-01 Delisted — MRIS
- 2011-08-01 Listing Removed — BRIGHT MLS
- 2011-06-07 Price Changed — MRIS
- 2011-05-06 Price Changed — MRIS
- 2011-04-08 Relisted — MRIS
- 2011-04-01 Delisted — MRIS
- 2011-01-10 Listed — MRIS
- 2011-01-10 Listed $69,900 BRIGHT MLS
Property tax history
+0.5%/yrLatest (2025): $3,062 · +5.7% YoY. Source: county tax records.
Cash-flow waterfall
monthlySold comps — $/sqft
last 12 mo · ≤1 miLoading sold comps…