 Multi-family
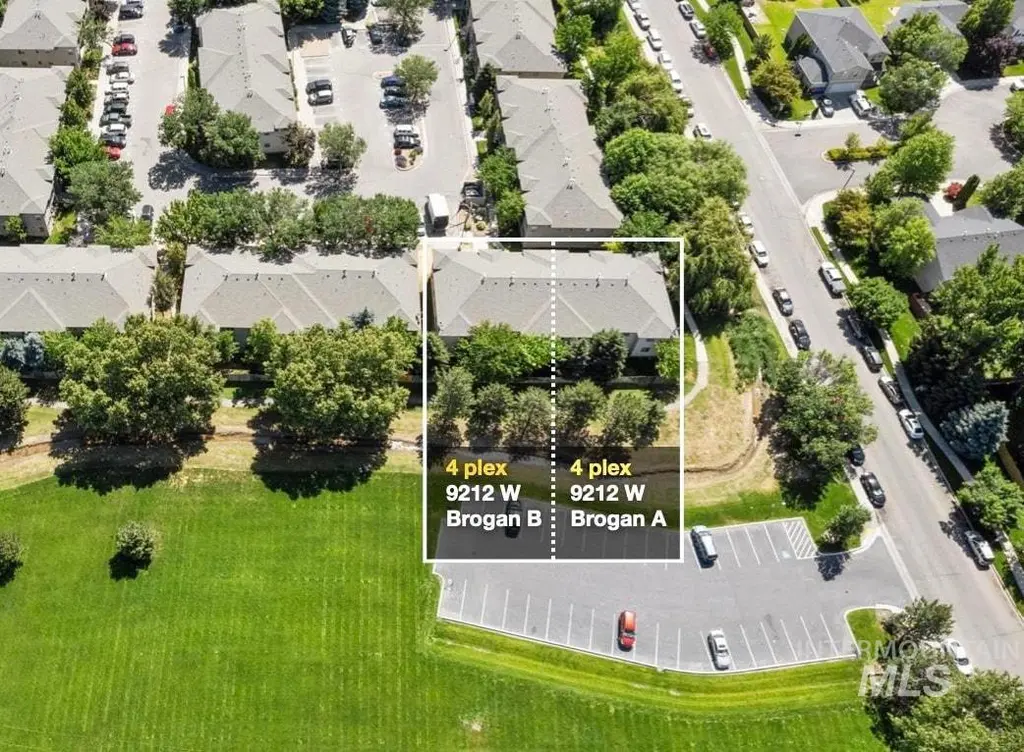
9212 W Brogan Dr A & B · Boise City, ID
Flood risk 6/10 · Moderate
- FEMA flood zone
- X (unshaded)
- Chance of flooding over 30 yrs
- 0.67%
- Est. flood insurance / yr
- $507 – $1,088
Fire risk 7/10 · Major
- Est. fire insurance / yr
- $584 – $1,086
Heat risk 4/10 · Minor
- Hot days now (above 96°F)
- 7 days/yr
- Hot days in 30 yrs
- 18 days/yr
Wind risk 1/10 · Minimal
- Chance of severe wind over 30 yrs
- —
Air-quality risk 7/10 · Major
- Unhealthy air days now
- 12 days/yr
- Unhealthy air days in 30 yrs
- 15 days/yr
Risk factors via First Street. Map © Google.
Why this score? — see what drove the D grade
The composite is a weighted blend of 9 inputs, each scored 0–100. Each bar is that input's sub-score; the figure is the points it added to the 100-point composite (weight × sub-score).
- Cash flow +12.9/30.0
- ARV discount +7.4/15.0
- Schools +5.2/10.0
- 1% rule +4.3/10.0
- Condition / age +4.0/5.0
- DSCR +3.8/10.0
- Rent growth +3.6/5.0
- Livability +2.5/5.0
- Appreciation +0.0/10.0
$1,700,000
🖨 Deal sheet (PDF) 📄 Offer letter ✓ Due diligence
Multi-family units
County records classify this as Multi-Family (2-4 Unit). Listing-text estimate: 1 unit. estimate disagrees with records
Listing remarks
Exceptional Investment Opportunity in South Boise – 8 unit bldg (two 4-Plex) w Strong Returns Discover this well-maintained 8 units bldg in the highly desirable South Boise area, surrounded by established single-family homes. Each of the four units boasts a spacious * * 3-bedroom, 2-bathroom layout * * , making it a sought-after choice for tenants and ensuring consistent occupancy. An additional 8 unit bldg is also available (two 4 plexs) With a * * 5.7% CAP rate * * and a stable rent history, this property offers reliable cash flow for savvy investors. Exterior maintenance is * * handled by the owners' association * * , making it incredibly easy to manage and ideal for th
Key facts
- Prime neighborhood
- Close to amenities
- Spacious layout
Tags
Property features AI
Finance
- Other: Current use listed as 2-4 units (zoning/use detail present)
- Financial info: Annual taxes listed (not included per instructions)
- HOA & community: Monthly association fee of $860
Exterior
- Parking: Total of 8 parking spaces
- Utilities: City water service; Sewer connected; Cable connected; Separate electric and gas meters for each unit
- Home design: Apartment building; Built in 2006
- Construction: Stucco and synthetic exterior
- Exterior features: Composition roof; Irrigation; Sidewalks
Interior
- Kitchen: All units include a stove/range; All units include a refrigerator; All units include a disposal
- Bedrooms: Total of 24 bedrooms across the property
- Flooring: Laminate flooring; Vinyl flooring
- Bathrooms: Total of 16 bathrooms across the property
- Heating & cooling: Forced air heating (natural gas); Central air conditioning serving all units
- Interior features: Apartment property with 8 total units; All units have central air
- Laundry & utility: Each unit has separate electric and gas meters
Neighborhood map
What this means for you Summary
Snapshot
- This is a 24-bed/16.0-bath multifamily listed at $1.70M. Condition is rated good.
Deal economics
- At list price, monthly cash flow is $-139 ($-2k/yr) — negative.
- To cash-flow at today's rent, offer at most $1.68M (1.2% below list).
- To meet the 1% rule (rent ≥ 1% of price), the offer needs to be $1.58M (7.2% below list).
- Recommended offer: $1.58M (7.2% below list) — sets the bar for 1% rule.
- Cap rate 6.2% vs local median 2.6% in Boise City — top-decile yield for the area; either an underpriced asset or a hidden risk that comps aren't pricing in. Stress-test before assuming the spread holds.
Location & tenants
- Location reads: area grade D — affects rentability + tenant quality, not the cash-flow math above.
- Joint School District No. 2 (suburban): math 53% / reading 67% proficiency, ranked #11 of 92 in ID (top 12%) — acceptable for families but not a draw, mixed tenant base, ~2y average lease.
- Zoned schools: Eliza Hart Spalding Stem Academy (math 65% / reading 65%, grade B+, #41 of 357 statewide, top 12%, 678 students, 17% FRL); Lake Hazel Middle School (math 46% / reading 64%, grade B-, #17 of 109 statewide, top 16%, 1,065 students, 29% FRL); Mountain View High School (math 42% / reading 72%, grade C, #21 of 169 statewide, top 13%, 2,462 students, 16% FRL) — zoned schools at 21% FRL track the district average.
- Market conditions: Rents rising fast (+4.3%/yr); 306 active listings in the ZIP; solid renter incomes; 5,129 units permitted in Ada County in 2024 (414 in 5+ unit buildings).
- At $15,784/mo this rent would consume 204% of the median local household income ($93k/yr) (locally 569% of renters already pay >50% of income on rent) — very limited rent-growth headroom before tenants either downsize or default.
Forward outlook
- Local home prices are declining (-3.0%/yr); year-one equity from $12k of loan paydown is wiped out by about $51k of value loss. Plan a longer hold.
- Ada County population projected at +45% by 2050 — long-run rental-demand tailwind backs the buy-and-hold thesis.
Negotiation context
- It's been on market 28 days — a 2% lower offer ($1.67M) is reasonable based on typical stale-listing flexibility.
- 8 sale attempts since 16y ago with the ask held roughly flat each time — persistent listings suggest the price (not the market) is what's stuck; bring a comps-based counter.
Risks & watch-outs
- Climate carrying-cost: major flood risk; major wildfire risk — expect insurance premiums to compound above CPI over the hold.
Questions for the listing agent
- What do current leases actually rent for vs. the listed asking? Can we see a recent rent roll and the last 12 months of T-12 income?
- What does the HOA fee cover, when was the last increase, and are there any pending special assessments or reserve-fund shortfalls?
- Is there a deadline driving the sale (1031 exchange, divorce, estate, relocation)? That informs how much negotiation room exists.
- The area grade is low — what's the realistic commute time and amenity access for the typical tenant pool here? Any planned neighborhood developments (good or bad) we should know about?
- What's the average days-on-market for RENTAL listings here right now (not sales)? A rising rental-DOM trend means longer vacancies and softer asking-rent achievability than the comps imply.
- What's the recent tenant-quality profile in this submarket — average credit score on applications, eviction rate, late-payment / NSF rate, and stable-employment percentage? A property-management company in the area should have these aggregated.
- How much new apartment / multifamily construction is in the pipeline within 1–3 miles? Heavy new supply (>2% of stock underway) typically softens rents 12–24 months out; light construction supports rent growth.
Investment metrics
- 1% rule
- 0.93% ✗
- Cap rate
- 6.19%
- Cash-on-cash
- -0.35%
- DSCR
- 0.98
- GRM
- 9.0
CMA / ARV
- ARV (on-the-fly)
- $1,696,320
- Comps found
- 1
Show comp detail 1 sale within ~0.75 mi
| Address | Dist | Beds/Ba | Sqft | Sold | Price | $/sf | Match |
|---|---|---|---|---|---|---|---|
| 9200 W Brogan Dr A & B | 0.03mi | 24/16.0 | 9,424 (0%) | 8mo | $1,700,000 | $180 | 92 |
Match score weights: distance 35% · size 25% · config 20% · recency 20%. Top-matched comps best support the ARV.
Projected returns pro-forma
-3.0% appreciation · 4.26% rent growth · sell at horizon
- IRR
- -15.3%
- Equity multiple
- 0.45×
- Total profit
- $-263,296
- Equity at exit
- $253,476
- IRR
- -4.6%
- Equity multiple
- 0.68×
- Total profit
- $-152,252
- Equity at exit
- $146,985
Cash invested: $476,000 (down + closing). Projections, not guarantees.
Landlord ↔ Tenant lean methodology
- Overall (STATE)
- 91 Strongly Landlord-Friendly
- State Idaho
- 91 Strongly Landlord-Friendly · R+18
- County
- — inherits STATE
- City
- — inherits STATE
ZIP-level market 83709
- Rents YoY
- 4.3%
- Active inventory
- 306
- Price-to-rent
- 71.8×
Monthly cashflow live
- Estimated rent
- $15,784 high interval (Pro) →
- Mortgage (P&I)
- −$8,915
- Tax est. 1.5%
- −$2,125 /mo · $25,500/yr
- Insurance
- −$708
- HOA
- −$860
- Vacancy / Maint / Mgmt
- −$3,315
- Net cashflow
- $-139
Break-even live
Sensitivity live
| Price | -10% $1,036 | -5% $448 | +0% $-139 | +5% $-726 | +10% $-1,314 |
|---|---|---|---|---|---|
| Rent | -10% $-1,386 | -5% $-762 | +0% $-139 | +5% $485 | +10% $1,108 |
| Rate | -1.0pp $717 | -0.5pp $293 | base $-139 | +0.5pp $-579 | +1.0pp $-1,028 |
8-unit breakdown (identical units grouped — click to expand)
| Units | Beds | Baths | Est. rent |
|---|---|---|---|
| 8× units | 3 | 2 | $15,784 |
| #1 | 3 | 2 | $1,973 |
| #2 | 3 | 2 | $1,973 |
| #3 | 3 | 2 | $1,973 |
| #4 | 3 | 2 | $1,973 |
| #5 | 3 | 2 | $1,973 |
| #6 | 3 | 2 | $1,973 |
| #7 | 3 | 2 | $1,973 |
| #8 | 3 | 2 | $1,973 |
| Total (8 units) | $15,784 | ||
UW: 25.0% down · 7.5% · 30yr · 1.5% tax · 5.0% vac · 8.0% maint · 8.0% mgmt
Financing live
Cash to close
- Down payment
- $425,000
- Closing costs
- $51,000
- Reserves months
- —
- Total cash needed
- —
Loan-product check · same deal, 3 products live
Conventional
25% down · 7.5% · 30yr
- Down + closing
- —
- Monthly P&I
- —
- Monthly cashflow
- —
- DSCR
- —
- Eligible?
- —
Personal DTI + credit; lowest rate.
DSCR
20% down · 8.5% · 30yr
- Down + closing
- —
- Monthly P&I
- —
- Monthly cashflow
- —
- DSCR
- —
- Eligible?
- —
No personal income docs; deal must DSCR.
Hard money
10% down · 12.0% · 12mo
- Down + closing
- —
- Monthly P&I
- —
- Monthly cashflow
- —
- DSCR
- —
- Eligible?
- —
Short-term bridge; refi at stabilization.
HOA detail
- Monthly dues
- $860 · $10,320/yr
- Likely covers
- exterior maint.
Listing history 26 events
-
2026-06-16statusdays on market $1,700,000 Pending 28 DOM
-
2026-06-15days on market $1,700,000 Active 27 DOM
-
2026-06-13days on market $1,700,000 Active 25 DOM
-
2026-06-10days on market $1,700,000 Active 22 DOM
-
2026-06-09days on market $1,700,000 Active 21 DOM
-
2026-06-08days on market $1,700,000 Active 20 DOM
-
2026-06-07days on market $1,700,000 Active 19 DOM
-
2026-06-03days on market $1,700,000 Active 15 DOM
-
2026-06-03days on market $1,700,000 Active 14 DOM
-
2026-06-01days on market $1,700,000 Active 13 DOM
-
2026-05-31days on market $1,700,000 Active 12 DOM
-
2026-05-19$1,700,000 Active
-
2026-04-11historical
-
2026-04-11historical
-
2025-09-25$1,700,000 Active
-
2025-09-25$850,000 Active
-
2024-08-02historical
-
2024-06-18$875,000 Active
-
2024-04-28historical
-
2024-04-28historical
-
2024-04-18status Pending
-
2024-04-18status Pending
-
2024-03-06$950,000 Active
-
2024-03-06$950,000 Active
-
2010-04-23$360,000
-
2010-04-23$360,000
ⓘ Source: listings_history table (triggers on properties + properties_extension) + one-shot
backfill from property_details.listing_events for pre-trigger history.
Climate risk First Street
- Flood 6/10 Major FEMA zone X (unshaded) · 67% chance over 30 yrs
- Wildfire 7/10 Severe
- Heat 4/10 Moderate 7 d/yr ≥96°F today · 18 d/yr by 30 yrs out
- Wind 1/10 Low
- Air quality 7/10 Severe 12 unhealthy d/yr today · 15 by 30 yrs out
Nearby sold comps map
Loading sold comps map…
Walkable amenities ~0.75 mi
Loading nearby amenities…
Taxation est. · year 1
- Rental income
- $189,408
- − Mortgage interest
- −$95,226
- − Property taxes
- −$25,500
- − Insurance
- −$8,500
- − Repairs & maintenance
- −$15,153
- − Management
- −$15,153
- − HOA
- −$10,320
- − Depreciation
- −$49,455
- Taxable loss
- −$29,898
- Est. tax savings @ 24.0%
- +$7,176
- After-tax cash flow
- $5,508/yr
For passive investors: Depreciation is non-cash, so a rental often shows a tax loss while cash-flowing — sheltering income. Rental losses are passive: they offset passive income freely, and up to $25,000/yr can offset ordinary (W-2) income if you actively participate and your MAGI is under $100k (phasing out to $0 by $150k); unused losses carry forward. On sale, claimed depreciation is recaptured at up to 25%, and gains may owe capital-gains tax (a 1031 exchange can defer both). Figures are a year-1 estimate at your 24.0% rate — not tax advice; consult a CPA.
Condition & rehab AI · 12 photos
This well-maintained 8-unit building offers a good investment opportunity with minimal repairs needed. Fresh paint and updated fixtures would significantly enhance its value.
Repairs flagged
- Minor Kitchen cabinets — Worn appearance
- Minor Bathroom fixtures — Signs of wear
Value-add opportunities
- Both Paint interior walls — Fresh paint enhances curb appeal and interior aesthetics
- Both Replace worn kitchen cabinets — New cabinets improve functionality and appearance
- Both Replace worn bathroom fixtures — New fixtures improve functionality and appearance
Renovation cost estimate screening
| Repair item | Severity | Est. cost |
|---|---|---|
| Kitchen cabinets · Worn appearance | Minor | $500–3,000 |
| Bathroom fixtures · Signs of wear | Minor | $500–3,000 |
| Total estimated repair cost · 2 items | $1,000–6,000 |
Value-add ROI direction
- Both Paint interior walls — Fresh paint enhances curb appeal and interior aesthetics ↑
- Both Replace worn kitchen cabinets — New cabinets improve functionality and appearance ↑
- Both Replace worn bathroom fixtures — New fixtures improve functionality and appearance ↑
ⓘ Cost ranges are severity-bucket heuristics (US national rule-of-thumb). Get contractor quotes + a written scope before underwriting a rehab budget.
Schools (NCES district)
- District
- Joint School District No. 2
- NCES district ID
- 1602100
- Math proficiency
- 53% ▼ -6.00%
- Reading proficiency
- 67% ▼ -1.00%
- Median HH income
- $64,573
- Composite
- 52.42/100
- National rank
- #1576
- State rank
- #11 of 92 in ID
Livability — Boise City
No livability data for this city. (Only ~50 U.S. cities are tracked.)
Census & demographics
- County
- Ada County · 522,161 people
- City population
- 152,689
- Metro
- Boise City, ID
- Population (ZIP)
- 58,928
- Household income
- $92,786
- Rent vs Own
- Severe rent burden
- 569.0
Population outlook (Ada County) Hauer SSP2
- Today (2025)
- 535,818 people
- By 2030
- 585,751 · +9.3%
- By 2040
- 682,435 · +27.4%
- By 2050
- 775,818 · +44.8%
- By 2075
- 994,458 · +85.6%
- By 2100
- 1,148,884 · +114.4%
Race, ethnicity, and origin ACS 2023
- Neighborhood character
- Predominantly White (82%)
- Race & ethnicity
- White 82% Hispanic / Latino 8% Two or more races 7% Asian 3% Black 2%
- Hispanic origin (detail)
- Mexican 5%
- Common ancestry
- Portuguese 4% Slovak 3% Lithuanian 3%
- Foreign-born
- 7% · Canada, China, Vietnam
- Languages at home
- 90% English-only · Spanish 3% Russian/Polish/Slavic 1% Other Indo-European 1%
Political lean MEDSL · Ada
- 2024 margin
- R (+10.3) · D 43.4% · R 53.8% · Other 2.8%
- 2008→2024 swing
- -4.2pp toward R · 2008: -6.2pp · 2024: -10.3pp
- All cycles
- 2024: R+10.3 2020: R+3.9 2016: R+9.2 2012: R+11.3 2008: R+6.2
Not yet ingested
- Civics
- —
Market trends
- HPI YoY
- ▼ -379.92%
- Current HPI
- 358.8386
- Rent YoY
- ▲ 4.26%
- Metro
- Boise City, ID
- State GDP YoY
- ▲ 4.51%
- F500 in state
- 6
Industry mix (Fortune 500 HQ in ID)
| Industry | F500 HQs | Revenue |
|---|---|---|
| Retail | 1 | $79B |
|
||
| Technology | 1 | $25B |
|
||
| Food / Agriculture | 1 | $6B |
|
||
Price history
+372.2% since first listed15 events — show timeline
- 2026-05-19 Listed $1,700,000 IMLS
- 2026-04-11 Listing Removed — IMLS
- 2026-04-11 Listing Removed — IMLS
- 2025-09-25 Listed $850,000 IMLS
- 2025-09-25 Listed $1,700,000 IMLS
- 2024-08-02 Listing Removed — IMLS
- 2024-06-18 Listed $875,000 IMLS
- 2024-04-28 Listing Removed — IMLS
- 2024-04-28 Listing Removed — IMLS
- 2024-04-18 Pending — IMLS
- 2024-04-18 Pending — IMLS
- 2024-03-06 Listed $950,000 IMLS
- 2024-03-06 Listed $950,000 IMLS
- 2010-04-23 Listed $360,000 IMLS
- 2010-04-23 Listed $360,000 IMLS
Cash-flow waterfall
monthlySold comps — $/sqft
last 12 mo · ≤1 miLoading sold comps…