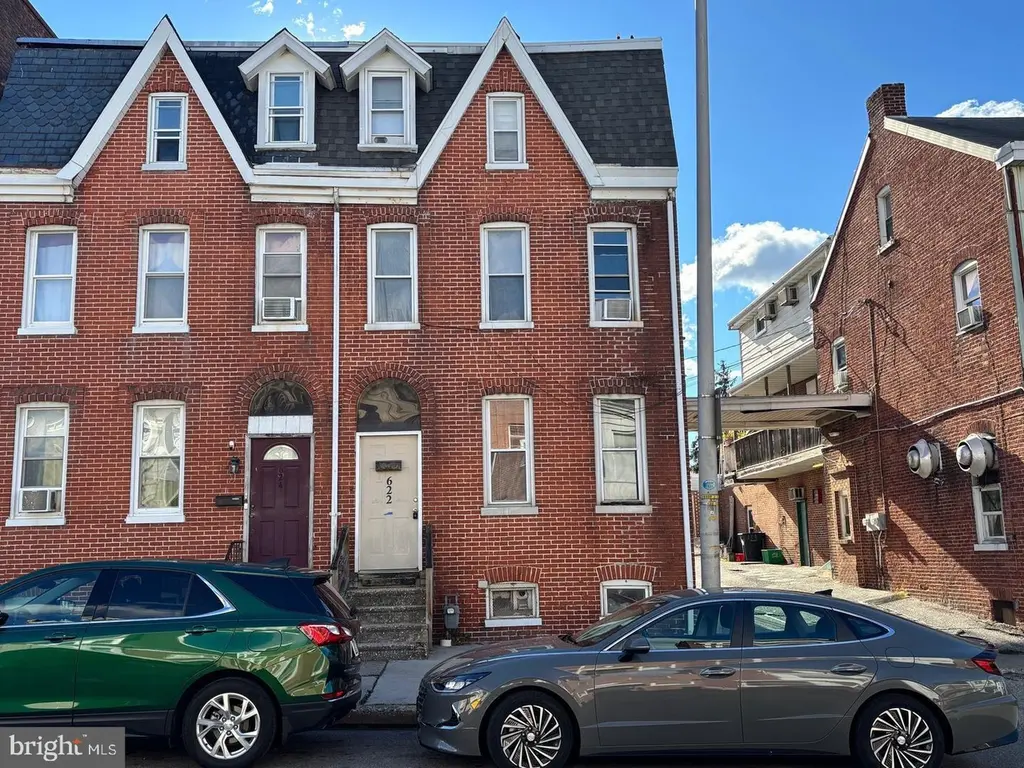
622 E Market St · York, PA
Flood risk 1/10 · Minimal
- FEMA flood zone
- X (unshaded)
- Chance of flooding over 30 yrs
- 0.0%
- Est. flood insurance / yr
- $473 – $860
Fire risk 1/10 · Minimal
- Est. fire insurance / yr
- $511 – $949
Heat risk 6/10 · Moderate
- Hot days now (above 102°F)
- 7 days/yr
- Hot days in 30 yrs
- 15 days/yr
Wind risk 4/10 · Minor
- Chance of severe wind over 30 yrs
- 12.0%
Air-quality risk 3/10 · Minor
- Unhealthy air days now
- 3 days/yr
- Unhealthy air days in 30 yrs
- 5 days/yr
Risk factors via First Street. Map © Google.
Why this score? — see what drove the C+ grade
The composite is a weighted blend of 9 inputs, each scored 0–100. Each bar is that input's sub-score; the figure is the points it added to the 100-point composite (weight × sub-score).
- Cash flow +25.9/30.0
- ARV discount +9.8/15.0
- DSCR +8.7/10.0
- 1% rule +6.5/10.0
- Livability +3.8/5.0
- Rent growth +3.6/5.0
- Condition / age +2.5/5.0
- Schools +0.8/10.0
- Appreciation +0.0/10.0
$144,900
🖨 Deal sheet 📄 Offer letter ✓ Due diligence
Listing remarks
Excellent investment opportunity in the heart of York PA. This spacious 5 bedroom and 3 full bath offers a solid return potential and is ideal for investors seeking steady rental income. This home is close to public transportation, schools, shopping, and I83/Rt30. Recent updates and ongoing maintenance ensures your investment performs well in your portfolio. Whether you are looking to expand your rental holdings or start building wealth through real estate, this property presents an attractive and turn key opportunity to generate income from day one!
Key facts
- Close to schools
- Tenant occupied
- Recent updates
Tags
Property features AI
Exterior
- Parking: On-street parking; Off-street parking
- Utilities: Public water; Public sewer
- Home design: End-of-row townhouse; Fee simple ownership
- Construction: Brick construction; Brick/mortar and other foundation details; Above-grade and below-grade structures; Estimated year built
- Exterior features: Not in a federal flood zone
Interior
- Bedrooms: One bedroom on the main level; Three bedrooms on the first upper level; One bedroom on the second upper level
- Bathrooms: Three full bathrooms (one on main level, one on first upper level, one on lower level)
- Heating & cooling: Hot water heating; Central heating; Natural gas fuel; Electric hot water
- Interior features: Estimated living area; Full finished basement (poured concrete)
Neighborhood map
What this means for you Summary
Snapshot
- This is a 5-bed/1.0-bath townhouse listed at $145k.
Deal economics
- At list price, monthly cash flow is $354 ($4k/yr) — positive.
- The deal already cash-flows at list — no discount required.
- Meets the 1% rule at list price ($2k rent vs $145k).
- Cap rate 9.2% vs local median 5.0% in York — top-decile yield for the area; either an underpriced asset or a hidden risk that comps aren't pricing in. Stress-test before assuming the spread holds.
Location & tenants
- Location reads 75/100 on livability (#427 in PA, #3,987 nationally) — a middle-class / working-renter tenant base. Strengths: cost of living A+, health & safety A+, housing A; Watch: amenities D+, crime F, employment F.
- York City SD (urban): math 4% / reading 16% proficiency, ranked #534 of 539 in PA (top 99%) — low school quality limits family demand, transient renter base, plan for 1-2y turnover; 72% free/reduced lunch — lower-income household profile, screen leases tightly.
- Market conditions: Rents rising fast (+4.4%/yr); 213 active listings in the ZIP; 7 comparable units currently listed for rent nearby; rentals at typical pace (median 21d on market — plan ~3-4 weeks tenant-placement turnaround); 43% of comp listings sitting > 30 days — soft ceiling on asking rent; solid renter incomes; 1,328 units permitted in York County in 2024 (338 in 5+ unit buildings).
Forward outlook
- Local home prices are declining (-3.0%/yr); year-one equity from $1k of loan paydown is wiped out by about $4k of value loss. Plan a longer hold.
- At projected returns (-3.0% appreciation + 4.4% rent growth), your $41k cash investment doubles in ~9 years — after that, you're playing with house money.
Negotiation context
- Only 13 days on market — expect competitive offers; lowballing is unlikely to land.
- 7 sale attempts since 7y ago with the ask held roughly flat each time — persistent listings suggest the price (not the market) is what's stuck; bring a comps-based counter.
- Current owner paid $90k; list at $145k implies a 61% gain — meaningful room to come down on a strong offer.
Risks & watch-outs
- Watch-outs: built in 1900 — expect roof / HVAC / electrical / plumbing capex.
- Climate carrying-cost: extreme-heat days projected 7→15/yr by 2055 (HVAC capex compounding) — expect insurance premiums to compound above CPI over the hold.
Questions for the listing agent
- Built in 1900 — when were the roof, HVAC, electrical panel, plumbing, and water heater last replaced?
- Is there a deadline driving the sale (1031 exchange, divorce, estate, relocation)? That informs how much negotiation room exists.
- Crime grade is F in this area — have there been break-ins, vandalism, or insurance claims at this property in the last 3 years? What carrier currently insures it and at what premium?
- What's the average days-on-market for RENTAL listings here right now (not sales)? A rising rental-DOM trend means longer vacancies and softer asking-rent achievability than the comps imply.
- What's the recent tenant-quality profile in this submarket — average credit score on applications, eviction rate, late-payment / NSF rate, and stable-employment percentage? A property-management company in the area should have these aggregated.
- How much new for-sale + rental construction is in the pipeline within 1–3 miles? Heavy new supply typically softens prices + rents 12–24 months out; constrained supply supports both.
Investment metrics
- 1% rule
- 1.15% ✓
- Cap rate
- 9.23%
- Cash-on-cash
- 10.48%
- DSCR
- 1.47
- GRM
- 7.2
CMA / ARV
- ARV (median comp)
- $152,595
- List price
- $144,900
- Delta
- -5.04%
- Verdict
- FAIR
- Comps
- 20 within 1.0 mi
Show comp detail 12 sales within ~0.75 mi
| Address | Dist | Beds/Ba | Sqft | Sold | Price | $/sf | Match |
|---|---|---|---|---|---|---|---|
| 117 S Pine St | 0.42mi | 5/1.0 | 2,040 (-2%) | 2mo | $174,000 | $85 | 77 |
| 316 E King St | 0.39mi | 5/1.5 | 2,124 (+2%) | 3mo | $185,000 | $87 | 73 |
| 830 E Philadelphia St | 0.30mi | 5/1.0 | 1,924 (-7%) | 2mo | $150,000 | $78 | 72 |
| 802 Chestnut St | 0.30mi | 5/1.0 | 1,860 (-10%) | 1mo | $145,000 | $78 | 68 |
| 690 E Philadelphia St | 0.17mi | 6/2.0 (+1) | 1,926 (-7%) | 4mo | $160,000 | $83 | 68 |
| 442 E Prospect St | 0.42mi | 5/1.5 | 1,926 (-7%) | 0mo | $189,000 | $98 | 66 |
| 60 N Tremont St | 0.34mi | 5/1.5 | 1,890 (-9%) | 3mo | $160,000 | $85 | 65 |
| 621 Wallace St | 0.23mi | 4/1.5 (-1) | 1,872 (-10%) | 4mo | $200,000 | $107 | 63 |
| 702 E Chestnut St | 0.28mi | 5/2.5 | 2,264 (+9%) | 6mo | $185,000 | $82 | 61 |
| 23 N Albemarle St | 0.45mi | 5/1.0 | 1,836 (-11%) | 3mo | $182,000 | $99 | 58 |
| 1061 Hay St | 0.66mi | 4/3.5 (-1) | 2,064 (-0%) | 2mo | $255,000 | $124 | 52 |
| 125 N Queen St | 0.53mi | 6/2.0 (+1) | 2,268 (+10%) | 5mo | $70,000 | $31 | 46 |
Match score weights: distance 35% · size 25% · config 20% · recency 20%. Top-matched comps best support the ARV.
Projected returns pro-forma
-3.0% appreciation · 4.43% rent growth · sell at horizon
- IRR
- 1.0%
- Equity multiple
- 1.04×
- Total profit
- $1,524
- Equity at exit
- $21,605
- IRR
- 12.0%
- Equity multiple
- 2.00×
- Total profit
- $40,666
- Equity at exit
- $12,528
Cash invested: $40,572 (down + closing). Projections, not guarantees.
Landlord ↔ Tenant lean methodology
- Overall (STATE)
- 62 Landlord-Friendly
- State Pennsylvania
- 62 Landlord-Friendly · EVEN
- County
- — inherits STATE
- City
- — inherits STATE
ZIP-level market 17403
- Home prices YoY
- -26.9%
- Rents YoY
- 4.4%
- Active inventory
- 213
- Price-to-rent
- 7.2×
Monthly cashflow live
- Estimated rent
- $1,666 high interval (Pro) →
- Mortgage (P&I)
- −$760
- Tax from tax record
- −$141 /mo · $1,695/yr
- Insurance
- −$60
- HOA
- −$0
- Vacancy / Maint / Mgmt
- −$350
- Net cashflow
- $354
Break-even live
UW: 25.0% down · 7.5% · 30yr · 1.5% tax · 5.0% vac · 8.0% maint · 8.0% mgmt
Financing live
Cash to close
- Down payment
- $36,225
- Closing costs
- $4,347
- Reserves months
- —
- Total cash needed
- —
Loan-product check · same deal, 3 products live
Conventional
25% down · 7.5% · 30yr
- Down + closing
- —
- Monthly P&I
- —
- Monthly cashflow
- —
- DSCR
- —
- Eligible?
- —
Personal DTI + credit; lowest rate.
DSCR
20% down · 8.5% · 30yr
- Down + closing
- —
- Monthly P&I
- —
- Monthly cashflow
- —
- DSCR
- —
- Eligible?
- —
No personal income docs; deal must DSCR.
Hard money
10% down · 12.0% · 12mo
- Down + closing
- —
- Monthly P&I
- —
- Monthly cashflow
- —
- DSCR
- —
- Eligible?
- —
Short-term bridge; refi at stabilization.
Rent comps 7 comps
| Address | Beds | Baths | Sqft | Rent | $/sqft | DOM | Units | Dist |
|---|---|---|---|---|---|---|---|---|
| 631 Wallace St Unit 631 York, PA | 4.0 | 1.0 | 1545 | $1,325 | $0.86 | 13d | 1 | 0.20mi |
| 720 Chestnut St Apt 2 York, PA | 4.0 | 1.0 | 1400 | $1,300 | $0.93 | 13d | 1 | 0.26mi |
| 339 E Market St Unit 1 York, PA | 4.0 | 1.5 | 1600 | $1,650 | $1.03 | 21d | 1 | 0.33mi |
| 289 Union St York, PA | 4.0 | 1.0 | 1450 | $1,600 | $1.10 | 43d | 1 | 1.15mi |
| 213 Kurtz Ave York, PA | 5.0 | 1.0 | 1921 | $1,850 | $0.96 | 13d | 1 | 1.17mi |
| 119 W Jackson St York, PA | 4.0 | 1.0 | 1800 | $1,395 | $0.78 | 43d | 1 | 1.19mi |
| 330 Smyser St York, PA | 5.0 | 1.0 | 1634 | $1,425 | $0.87 | 43d | 1 | 1.20mi |
Listing history 20 events
-
2026-05-15status Pending 556-char remark
-
2026-05-02$144,900 Active 556-char remark
-
2026-04-30historical
-
2026-04-04$1,500
-
2026-04-03historical $1,500
-
2026-04-03$1,500
-
2026-04-02price $144,900
-
2025-11-07$149,900 Active
-
2024-04-30historical
-
2024-04-10price $149,900
-
2024-04-10status Active
-
2024-03-06historical
-
2023-11-20price $129,900
-
2023-11-07price $139,900
-
2023-10-23$149,900 Active
-
2020-01-16soldstatus $89,900
-
2019-11-07historical
-
2019-11-07historical
-
2019-11-07$99,900
-
1990-08-07soldstatus $30,000
ⓘ Source: listings_history table (triggers on properties + properties_extension) + one-shot
backfill from property_details.listing_events for pre-trigger history.
Tax reassessment forecast PA · Partial reset (capped growth)
- Current annual tax
- $1,695 · $141/mo
- Projected year-2 tax
- $1,992 · $166/mo
- Expected delta
- +$297/yr (+$25/mo · 17.5%)
ⓘ Screening estimate from a state-policy table — verify with the county assessor before closing.
Climate risk First Street
- Flood 1/10 Low FEMA zone X (unshaded) · 0% chance over 30 yrs
- Wildfire 1/10 Low
- Heat 6/10 Major 7 d/yr ≥102°F today · 15 d/yr by 30 yrs out
- Wind 4/10 Moderate 12% chance of damaging wind over 30 yrs
- Air quality 3/10 Moderate 3 unhealthy d/yr today · 5 by 30 yrs out
Nearby sold comps map
Loading sold comps map…
Walkable amenities ~0.75 mi
Loading nearby amenities…
Taxation est. · year 1
- Rental income
- $19,989
- − Mortgage interest
- −$8,117
- − Property taxes
- −$1,695
- − Insurance
- −$724
- − Repairs & maintenance
- −$1,599
- − Management
- −$1,599
- − Depreciation
- −$4,215
- Taxable income
- $2,039
- Est. tax owed @ 24.0%
- −$489
- After-tax cash flow
- $3,764/yr
For passive investors: Depreciation is non-cash, so a rental often shows a tax loss while cash-flowing — sheltering income. Rental losses are passive: they offset passive income freely, and up to $25,000/yr can offset ordinary (W-2) income if you actively participate and your MAGI is under $100k (phasing out to $0 by $150k); unused losses carry forward. On sale, claimed depreciation is recaptured at up to 25%, and gains may owe capital-gains tax (a 1031 exchange can defer both). Figures are a year-1 estimate at your 24.0% rate — not tax advice; consult a CPA.
Schools (NCES district)
- District
- York City SD
- NCES district ID
- 4226820
- Math proficiency
- 4% ▼ -7.00%
- Reading proficiency
- 16% ▼ -9.00%
- Median HH income
- $29,470
- Composite
- 7.61/100
- National rank
- #9943
- State rank
- #534 of 539 in PA
Livability — York
- Score
- 75/100
- State rank
- #427
- US rank
- #3987
Category grades
Schools grade is shown separately in the Schools card above.
Census & demographics
- Census place
- York, PA
- County
- York County · 278,806 people
- City population
- 184,764
- Metro
- York-Hanover, PA
- Population (ZIP)
- 40,287
- Household income
- $75,384
- Rent vs Own
- Severe rent burden
- 1305.0
Population outlook (York County) Hauer SSP2
- Today (2025)
- 454,205 people
- By 2030
- 457,407 · +0.7%
- By 2040
- 457,529 · +0.7%
- By 2050
- 448,261 · -1.3%
- By 2075
- 427,388 · -5.9%
- By 2100
- 384,218 · -15.4%
Race, ethnicity, and origin ACS 2023
- Neighborhood character
- Diverse neighborhood (Simpson 0.58)
- Race & ethnicity
- White 60% Hispanic / Latino 20% Black 12% Two or more races 9% Asian 3%
- Hispanic origin (detail)
- Mexican 3% Puerto Rican 10% Dominican 3%
- Common ancestry
- Romanian 3% Lithuanian 1% Slovak 1%
- Foreign-born
- 10% · Canada, Vietnam, Jamaica
- Languages at home
- 81% English-only · Spanish 14% Other Indo-European 1% Arabic 1%
Political lean MEDSL · York
- 2024 margin
- Strong R (+25.3) · D 36.9% · R 62.1%
- 2008→2024 swing
- -11.7pp toward R · 2008: -13.6pp · 2024: -25.3pp
- All cycles
- 2024: R+25.3 2020: R+24.6 2016: R+29.3 2012: R+21.2 2008: R+13.6
Not yet ingested
- Civics
- —
Market trends
- HPI YoY
- ▼ -104.51%
- Current HPI
- 284.0731
- Rent YoY
- ▲ 4.43%
- Metro
- York-Hanover, PA
- State GDP YoY
- ▲ 1.68%
- F500 in state
- 34
Industry mix (Fortune 500 HQ in PA)
| Industry | F500 HQs | Revenue |
|---|---|---|
| Healthcare | 2 | $309B |
|
||
| Insurance | 2 | $27B |
|
||
| Telecommunications / Media | 1 | $124B |
|
||
| Industrial Distribution | 1 | $22B |
|
||
| Financial Services | 1 | $20B |
|
||
| Chemicals / Materials | 1 | $18B |
|
||
Price history
-95.0% since first listed21 events — show timeline
- 2026-05-21 Rental Removed $1,500 APPFOLIO
- 2026-05-15 Pending — BRIGHT MLS
- 2026-05-02 Listed $144,900 BRIGHT MLS
- 2026-04-30 Listing Removed — BRIGHT MLS
- 2026-04-04 Listed for Rent $1,500 APPFOLIO
- 2026-04-03 Rental Removed $1,500 SHOWMOJO
- 2026-04-03 Listed for Rent $1,500 SHOWMOJO
- 2026-04-02 Price Changed $144,900 BRIGHT MLS
- 2025-11-07 Listed $149,900 BRIGHT MLS
- 2024-04-30 Listing Removed — BRIGHT MLS
- 2024-04-10 Price Changed $149,900 BRIGHT MLS
- 2024-04-10 Relisted — BRIGHT MLS
- 2024-03-06 Listing Removed — BRIGHT MLS
- 2023-11-20 Price Changed $129,900 BRIGHT MLS
- 2023-11-07 Price Changed $139,900 BRIGHT MLS
- 2023-10-23 Listed $149,900 BRIGHT MLS
- 2020-01-16 Sold (Public Records) $89,900 Public Records
- 2019-11-07 Listed $99,900 BRIGHT MLS
- 2019-11-07 Listing Removed — BRIGHT MLS
- 2019-11-07 Listing Removed — BRIGHT MLS
- 1990-08-07 Sold (Public Records) $30,000 Public Records
Property tax history
-4.8%/yrLatest (2026): $1,695 · +1.6% YoY. Source: county tax records.
Cash-flow waterfall
monthlySold comps — $/sqft
last 12 mo · ≤1 miLoading sold comps…