120 N Main St · Verden, OK
Flood risk No data
- FEMA flood zone
- —
- Chance of flooding over 30 yrs
- —
- Est. flood insurance / yr
- —
Fire risk No data
- Est. fire insurance / yr
- —
Heat risk 6/10 · Moderate
- Hot days now (above threshold)
- 7 days/yr
- Hot days in 30 yrs
- 19 days/yr
Wind risk No data
- Chance of severe wind over 30 yrs
- —
Air-quality risk 2/10 · Minimal
- Unhealthy air days now
- 0 days/yr
- Unhealthy air days in 30 yrs
- 1 days/yr
Risk factors via First Street. Map © Google.
Why this score? — see what drove the B+ grade
The composite is a weighted blend of 9 inputs, each scored 0–100. Each bar is that input's sub-score; the figure is the points it added to the 100-point composite (weight × sub-score).
- Cash flow +30.0/30.0
- 1% rule +10.0/10.0
- DSCR +10.0/10.0
- ARV discount +7.5/15.0
- Appreciation +7.5/10.0
- Condition / age +3.8/5.0
- Livability +3.1/5.0
- Schools +2.7/10.0
- Rent growth +2.5/5.0
$51,000
🖨 Deal sheet 📄 Offer letter ✓ Due diligence
Listing remarks
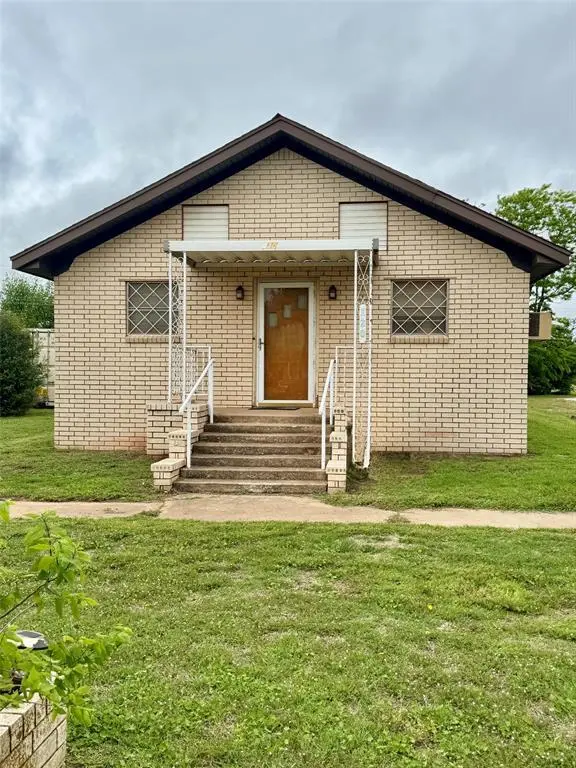
This unique property featuring a brick veneer exterior and versatile layout with endless possibilities. Whether you’re looking for a residence, investment property, small business location, or creative live/work space, this one is worth a look. Major updates have already been completed, including new sewer line to the main, new gas lines throughout, new PEX water lines, a new electric meter, new breaker box, and some updated wiring. The property also features an on-demand electric hot water system and a recently installed ventless wall heater. Inside plenty of room to customize to your needs. Accessibility is enhanced with a concrete ramp to the rear entrance. Outside, a large Connex
Key facts
- 0.29 acre lot
- Built 1960
- Listed 51 days
Property features AI
Finance
- Other: Located on a 0.29-acre lot; Living area approximately 1,100 (assessor); Located on a corner in the Verden addition; No storm shelter; Directions: Head West on Hwy 62 to Verden, turn N on Main St to the home.
- Financial info: Not assumable; Does not qualify for loan (per listing)
- HOA & community: No mandatory association dues
Exterior
- Home design: Single family residence; One level; Existing property
- Construction: Brick and frame construction; Composition roof; Post-tension foundation; Handicap accessible
- Exterior features: Covered porch; Corner lot
Interior
- Bedrooms: 2 bedrooms
- Bathrooms: 1 full bathroom
- Heating & cooling: Other heating; Window unit cooling
- Interior features: Accessible entrance; No fireplace; One living area
Neighborhood map
What this means for you Summary
Snapshot
- This is a 1-bed/1.0-bath single-family listed at $51k. Condition is rated good.
Deal economics
- At list price, monthly cash flow is $403 ($5k/yr) — positive.
- The deal already cash-flows at list — no discount required.
- Meets the 1% rule at list price ($922 rent vs $51k).
- Recommended offer: $49k (3.0% below list) — sets the bar for market timing.
Location & tenants
- Location reads 61/100 on livability (#283 in OK) — a middle-class / working-renter tenant base. Strengths: cost of living A+, housing A+, crime B+; Watch: employment D+, amenities F, commute F.
- Verden (rural): math 30% / reading 25% proficiency, ranked #290 of 513 in OK (top 56%) — low school quality limits family demand, transient renter base, plan for 1-2y turnover; 63% free/reduced lunch — lower-income household profile, screen leases tightly.
- Zoned schools: Verden Es (math 22% / reading 22%, grade F, #413 of 845 statewide, top 54%, 248 students, 0% FRL); Verden Hs (math 10% / reading 10%, grade F, #361 of 447 statewide, top 94%, 106 students, 0% FRL) — zoned schools average 0% FRL vs 63% district-wide (63 pts lower); this property's tenant base skews higher-income than the district average.
- Market conditions: 2 active listings in the ZIP; 224 units permitted in Grady County in 2024 (0 in 5+ unit buildings).
Forward outlook
- In year one you build about $3k of equity ($353 loan paydown + $3k appreciation (5.0% local appreciation)).
- Grady County population projected at +20% by 2050 — long-run rental-demand tailwind backs the buy-and-hold thesis.
- At projected returns (5.0% appreciation + 3.0% rent growth), your $14k cash investment doubles in ~2 years — after that, you're playing with house money.
Negotiation context
- It's been on market 51 days — a 3% lower offer ($49k) is reasonable based on typical stale-listing flexibility.
Risks & watch-outs
- Climate carrying-cost: extreme-heat days projected 7→19/yr by 2055 (HVAC capex compounding) — expect insurance premiums to compound above CPI over the hold.
Questions for the listing agent
- It's been on market 51 days. Have you received any prior offers? Is the seller open to a 3% concession, seller financing, or rate buy-down credit?
- Built in 1960 — when were the roof, HVAC, electrical panel, plumbing, and water heater last replaced?
- Is there a deadline driving the sale (1031 exchange, divorce, estate, relocation)? That informs how much negotiation room exists.
- Schools are F-rated, which usually means shorter tenancies and higher turnover. Who's the typical renter profile here, and what's been the actual vacancy rate?
- What's the average days-on-market for RENTAL listings here right now (not sales)? A rising rental-DOM trend means longer vacancies and softer asking-rent achievability than the comps imply.
- What's the recent tenant-quality profile in this submarket — average credit score on applications, eviction rate, late-payment / NSF rate, and stable-employment percentage? A property-management company in the area should have these aggregated.
- How much new for-sale + rental construction is in the pipeline within 1–3 miles? Heavy new supply typically softens prices + rents 12–24 months out; constrained supply supports both.
Investment metrics
- 1% rule
- 1.81% ✓
- Cap rate
- 15.77%
- Cash-on-cash
- 33.85%
- DSCR
- 2.51
- GRM
- 4.6
CMA / ARV
- ARV (on-the-fly)
- $102,300
- Comps found
- 1
Show comp detail 1 sale within ~0.75 mi
| Address | Dist | Beds/Ba | Sqft | Sold | Price | $/sf | Match |
|---|---|---|---|---|---|---|---|
| 220 Highway 62 | 0.14mi | 2/1.5 (+1) | 1,133 (+3%) | 21mo | $105,000 | $93 | 64 |
Match score weights: distance 35% · size 25% · config 20% · recency 20%. Top-matched comps best support the ARV.
Projected returns pro-forma
5.03% appreciation · 3.0% rent growth · sell at horizon
- IRR
- 42.7%
- Equity multiple
- 3.63×
- Total profit
- $37,493
- Equity at exit
- $28,994
- IRR
- 40.7%
- Equity multiple
- 7.38×
- Total profit
- $91,127
- Equity at exit
- $50,116
Cash invested: $14,280 (down + closing). Projections, not guarantees.
Landlord ↔ Tenant lean methodology
- Overall (STATE)
- 83 Strongly Landlord-Friendly
- State Oklahoma
- 83 Strongly Landlord-Friendly · R+20
- County
- — inherits STATE
- City
- — inherits STATE
ZIP-level market 73092
- Home prices YoY
- 1.3%
- Active inventory
- 2
- Price-to-rent
- 4.6×
Monthly cashflow live
- Estimated rent
- $922 medium interval (Pro) →
- Mortgage (P&I)
- −$267
- Tax from tax record
- −$37 /mo · $441/yr
- Insurance
- −$21
- HOA
- −$0
- Vacancy / Maint / Mgmt
- −$194
- Net cashflow
- $403
Break-even live
UW: 25.0% down · 7.5% · 30yr · 1.5% tax · 5.0% vac · 8.0% maint · 8.0% mgmt
Financing live
Cash to close
- Down payment
- $12,750
- Closing costs
- $1,530
- Reserves months
- —
- Total cash needed
- —
Loan-product check · same deal, 3 products live
Conventional
25% down · 7.5% · 30yr
- Down + closing
- —
- Monthly P&I
- —
- Monthly cashflow
- —
- DSCR
- —
- Eligible?
- —
Personal DTI + credit; lowest rate.
DSCR
20% down · 8.5% · 30yr
- Down + closing
- —
- Monthly P&I
- —
- Monthly cashflow
- —
- DSCR
- —
- Eligible?
- —
No personal income docs; deal must DSCR.
Hard money
10% down · 12.0% · 12mo
- Down + closing
- —
- Monthly P&I
- —
- Monthly cashflow
- —
- DSCR
- —
- Eligible?
- —
Short-term bridge; refi at stabilization.
Listing history 15 events
-
2026-06-18days on market $51,000 Active 51 DOM
-
2026-06-17days on market $51,000 Active 50 DOM
-
2026-06-16days on market $51,000 Active 49 DOM
-
2026-06-15days on market $51,000 Active 48 DOM
-
2026-06-13days on market $51,000 Active 46 DOM
-
2026-06-13days on market $51,000 Active 45 DOM
-
2026-06-09days on market $51,000 Active 42 DOM
-
2026-06-08days on market $51,000 Active 41 DOM
-
2026-06-07days on market $51,000 Active 40 DOM
-
2026-06-03days on market $51,000 Active 36 DOM
-
2026-06-02days on market $51,000 Active 35 DOM
-
2026-06-01days on market $51,000 Active 34 DOM
-
2026-05-31days on market $51,000 Active 33 DOM
-
2026-05-16price $51,000
-
2026-04-28$59,000 Active
ⓘ Source: listings_history table (triggers on properties + properties_extension) + one-shot
backfill from property_details.listing_events for pre-trigger history.
Tax reassessment forecast OK · Resets to sale price
- Current annual tax
- $441 · $37/mo
- Projected year-2 tax
- $459 · $38/mo
- Expected delta
- +$18/yr (+$1/mo · 4.1%)
ⓘ Screening estimate from a state-policy table — verify with the county assessor before closing.
Climate risk First Street
- Heat 6/10 Major
- Air quality 2/10 Low 0 unhealthy d/yr today · 1 by 30 yrs out
Nearby sold comps map
Loading sold comps map…
Walkable amenities ~0.75 mi
Loading nearby amenities…
Taxation est. · year 1
- Rental income
- $11,062
- − Mortgage interest
- −$2,857
- − Property taxes
- −$441
- − Insurance
- −$255
- − Repairs & maintenance
- −$885
- − Management
- −$885
- − Depreciation
- −$1,484
- Taxable income
- $4,256
- Est. tax owed @ 24.0%
- −$1,021
- After-tax cash flow
- $3,812/yr
For passive investors: Depreciation is non-cash, so a rental often shows a tax loss while cash-flowing — sheltering income. Rental losses are passive: they offset passive income freely, and up to $25,000/yr can offset ordinary (W-2) income if you actively participate and your MAGI is under $100k (phasing out to $0 by $150k); unused losses carry forward. On sale, claimed depreciation is recaptured at up to 25%, and gains may owe capital-gains tax (a 1031 exchange can defer both). Figures are a year-1 estimate at your 24.0% rate — not tax advice; consult a CPA.
Condition & rehab AI · 3 photos
This single-family home has a good condition with minimal repairs needed. It's move-in ready with cosmetic updates that can significantly increase its value.
Value-add opportunities
- Both Paint exterior — Enhances curb appeal and value
- Both Landscaping — Improves curb appeal and enhances property value
Renovation cost estimate screening
Value-add ROI direction
- Both Paint exterior — Enhances curb appeal and value ↑
- Both Landscaping — Improves curb appeal and enhances property value ↑
ⓘ Cost ranges are severity-bucket heuristics (US national rule-of-thumb). Get contractor quotes + a written scope before underwriting a rehab budget.
Schools (NCES district)
- District
- Verden
- NCES district ID
- 4031080
- Math proficiency
- 30% ▲ 10.00%
- Reading proficiency
- 25% ▬ 0.00%
- Median HH income
- $46,720
- Composite
- 26.76/100
- National rank
- #12559
- State rank
- #290 of 513 in OK
Livability — Verden
- Score
- 61/100
- State rank
- #283
- US rank
- #17489
Category grades
Schools grade is shown separately in the Schools card above.
Census & demographics
- Census place
- Verden, OK
- Population (ZIP)
- 688
Population outlook (Grady County) Hauer SSP2
- Today (2025)
- 59,962 people
- By 2030
- 62,513 · +4.3%
- By 2040
- 67,338 · +12.3%
- By 2050
- 71,719 · +19.6%
- By 2075
- 82,684 · +37.9%
- By 2100
- 89,387 · +49.1%
Race, ethnicity, and origin ACS 2023
- Neighborhood character
- Predominantly White (78%)
- Race & ethnicity
- White 78% Native American 7% Two or more races 6% Hispanic / Latino 3% Black 3%
- Common ancestry
- Italian 3% Serbian 1% Scotch-Irish 1%
- Foreign-born
- 4% · Canada
- Languages at home
- 97% English-only · Spanish 1%
Political lean MEDSL · Grady
- 2024 margin
- Solid R (+62.7) · D 17.9% · R 80.6% · Other 1.5%
- 2008→2024 swing
- -16.0pp toward R · 2008: -46.7pp · 2024: -62.7pp
- All cycles
- 2024: R+62.7 2020: R+62.3 2016: R+60.3 2012: R+51.2 2008: R+46.7
Not yet ingested
- Civics
- —
Market trends
- HPI YoY
- ▲ 5.03%
- Current HPI
- 380.0136
- Rent YoY
- —
- Metro
- —
- State GDP YoY
- ▲ 1.55%
- F500 in state
- 6
Industry mix (Fortune 500 HQ in OK)
| Industry | F500 HQs | Revenue |
|---|---|---|
| Energy | 3 | $48B |
|
||
Price history
-13.6% since first listed2 events — show timeline
- 2026-05-16 Price Changed $51,000 MLSOK
- 2026-04-28 Listed $59,000 MLSOK
Property tax history
+21.6%/yrLatest (2025): $441 · +41.8% YoY. Source: county tax records.
Cash-flow waterfall
monthlySold comps — $/sqft
last 12 mo · ≤1 miLoading sold comps…