18455 Pine Ridge Dr · Citronelle, AL
Flood risk 1/10 · Minimal
- FEMA flood zone
- X (unshaded)
- Chance of flooding over 30 yrs
- 0.0%
- Est. flood insurance / yr
- $507 – $1,088
Fire risk 7/10 · Major
- Est. fire insurance / yr
- $916 – $1,700
Heat risk 8/10 · Major
- Hot days now (above 107°F)
- 7 days/yr
- Hot days in 30 yrs
- 20 days/yr
Wind risk 9/10 · Severe
- Chance of severe wind over 30 yrs
- 99.0%
Air-quality risk 1/10 · Minimal
- Unhealthy air days now
- 0 days/yr
- Unhealthy air days in 30 yrs
- 0 days/yr
Risk factors via First Street. Map © Google.
Why this score? — see what drove the B+ grade
The composite is a weighted blend of 9 inputs, each scored 0–100. Each bar is that input's sub-score; the figure is the points it added to the 100-point composite (weight × sub-score).
- Cash flow +30.0/30.0
- 1% rule +10.0/10.0
- DSCR +10.0/10.0
- Appreciation +10.0/10.0
- ARV discount +7.5/15.0
- Livability +3.1/5.0
- Rent growth +2.5/5.0
- Condition / age +2.5/5.0
- Schools +2.3/10.0
$65,000
🖨 Deal sheet 📄 Offer letter ✓ Due diligence
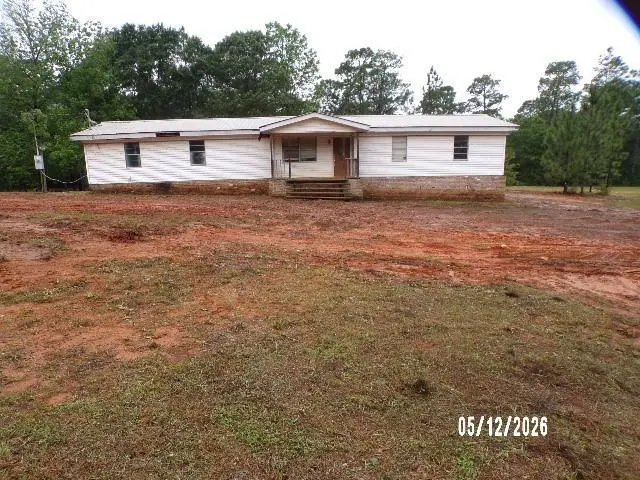
Listing remarks
Large home situated on almost 1 full acre! Bring your skills - this four bedroom home has great potential. One of the two bathrooms is incomplete and many additional repairs will be necessary to make this a great home again. The front living room opens to the kitchen and is adjacent to a large family room. There is plenty of space in this home to spread out. Offering plenty of space for outbuildings or outdoor activities, come take a look and make this house your home. This home is not a foreclosure, however, it is being sold in current "AS IS" condition. The seller will not activate utilities or perform any repairs. Call your favorite realtor to take a look. * Caution - do not tr
Key facts
- 0.99 acre lot
- 4 parking spots
- Built 1990
Property features AI
Finance
- Other: Not a land lease
- Financial info: No additional financial details provided
- HOA & community: Located in Pine Ridge subdivision
Exterior
- Parking: Driveway with space for 4 vehicles
- Security: No specific security features listed
- Utilities: Septic tank sewer; No electric utility specified; No other utilities listed
- Home design: Single family residence; Residential property
- Construction: Built in 1990; Vinyl siding; Metal roof; Pillar/post/pier foundation
- Exterior features: No exterior features listed; No fencing; View present
Interior
- Kitchen: Cabinets with stain finish; Laminate countertops; Electric range
- Bedrooms: 4 bedrooms
- Flooring: Vinyl flooring; Other flooring
- Bathrooms: 1 full bathroom; 1 half bathroom
- Heating & cooling: No heating; No cooling
- Interior features: Other interior features
- Laundry & utility: Electric water heater
Neighborhood map
What this means for you Summary
Snapshot
- This is a 5-bed/2.0-bath single-family listed at $65k.
Deal economics
- At list price, monthly cash flow is $715 ($9k/yr) — positive.
- The deal already cash-flows at list — no discount required.
- Meets the 1% rule at list price ($1k rent vs $65k).
- Recommended offer: $64k (1.5% below list) — sets the bar for market timing.
- Cap rate 19.5% vs local median 5.2% in Citronelle — top-decile yield for the area; either an underpriced asset or a hidden risk that comps aren't pricing in. Stress-test before assuming the spread holds.
Location & tenants
- Location reads 61/100 on livability (#254 in AL) — a middle-class / working-renter tenant base. Strengths: crime A+, cost of living A+, housing B+; Watch: employment C-, amenities F, commute F.
- Mobile County (urban): math 15% / reading 39% proficiency, ranked #81 of 129 in AL (top 63%) — low school quality limits family demand, transient renter base, plan for 1-2y turnover; 67% free/reduced lunch — lower-income household profile, screen leases tightly.
- Zoned schools: Citronelle High School (math 8% / reading 8%, grade F, #261 of 305 statewide, top 87%, 719 students, 70% FRL) — zoned schools at 70% FRL track the district average.
- Zoned-school proficiency averages 8% at this address vs 27% district-wide (-20 pts) — the specific schools serving this property underperform the Mobile County average; the district grade overstates school quality for this exact location.
- Market conditions: 63 active listings in the ZIP; 1,678 units permitted in Mobile County in 2024 (264 in 5+ unit buildings).
Forward outlook
- In year one you build about $7k of equity ($449 loan paydown + $6k appreciation (10.0% local appreciation)).
- Mobile County population projected to shrink 8% by 2050 — rents likely to lag national; underwrite the cash flow, not the appreciation.
- At projected returns (10.0% appreciation + 3.0% rent growth), your $18k cash investment doubles in ~2 years — after that, you're playing with house money.
- By year 5, paydown + projected appreciation supports a ~$32k cash-out refi (75% LTV) — recoverable capital for the next deal without selling this one.
Negotiation context
- It's been on market 30 days — a 2% lower offer ($64k) is reasonable based on typical stale-listing flexibility.
Risks & watch-outs
- Climate carrying-cost: severe wind risk, 99% chance of damaging wind over 30y; major wildfire risk; extreme-heat days projected 7→20/yr by 2055 (HVAC capex compounding) — expect insurance premiums to compound above CPI over the hold.
Questions for the listing agent
- Is there a deadline driving the sale (1031 exchange, divorce, estate, relocation)? That informs how much negotiation room exists.
- Schools are F-rated, which usually means shorter tenancies and higher turnover. Who's the typical renter profile here, and what's been the actual vacancy rate?
- What's the average days-on-market for RENTAL listings here right now (not sales)? A rising rental-DOM trend means longer vacancies and softer asking-rent achievability than the comps imply.
- What's the recent tenant-quality profile in this submarket — average credit score on applications, eviction rate, late-payment / NSF rate, and stable-employment percentage? A property-management company in the area should have these aggregated.
- How much new for-sale + rental construction is in the pipeline within 1–3 miles? Heavy new supply typically softens prices + rents 12–24 months out; constrained supply supports both.
Investment metrics
- 1% rule
- 2.30% ✓
- Cap rate
- 19.50%
- Cash-on-cash
- 47.16%
- DSCR
- 3.10
- GRM
- 3.6
CMA / ARV
No comps found within radius.
Projected returns pro-forma
10.0% appreciation · 3.0% rent growth · sell at horizon
- IRR
- 61.2%
- Equity multiple
- 5.45×
- Total profit
- $80,988
- Equity at exit
- $58,557
- IRR
- 54.7%
- Equity multiple
- 12.14×
- Total profit
- $202,737
- Equity at exit
- $126,281
Cash invested: $18,200 (down + closing). Projections, not guarantees.
Landlord ↔ Tenant lean methodology
- Overall (STATE)
- 90 Strongly Landlord-Friendly
- State Alabama
- 90 Strongly Landlord-Friendly · R+15
- County
- — inherits STATE
- City
- — inherits STATE
ZIP-level market 36522
- Home prices YoY
- 11.8%
- Active inventory
- 63
- Price-to-rent
- 3.6×
Monthly cashflow live
- Estimated rent
- $1,495 medium interval (Pro) →
- Mortgage (P&I)
- −$341
- Tax from tax record
- −$97 /mo · $1,170/yr
- Insurance
- −$27
- HOA
- −$0
- Vacancy / Maint / Mgmt
- −$314
- Net cashflow
- $715
Break-even live
UW: 25.0% down · 7.5% · 30yr · 1.5% tax · 5.0% vac · 8.0% maint · 8.0% mgmt
Financing live
Cash to close
- Down payment
- $16,250
- Closing costs
- $1,950
- Reserves months
- —
- Total cash needed
- —
Loan-product check · same deal, 3 products live
Conventional
25% down · 7.5% · 30yr
- Down + closing
- —
- Monthly P&I
- —
- Monthly cashflow
- —
- DSCR
- —
- Eligible?
- —
Personal DTI + credit; lowest rate.
DSCR
20% down · 8.5% · 30yr
- Down + closing
- —
- Monthly P&I
- —
- Monthly cashflow
- —
- DSCR
- —
- Eligible?
- —
No personal income docs; deal must DSCR.
Hard money
10% down · 12.0% · 12mo
- Down + closing
- —
- Monthly P&I
- —
- Monthly cashflow
- —
- DSCR
- —
- Eligible?
- —
Short-term bridge; refi at stabilization.
Listing history 17 events
-
2026-06-18days on market $65,000 Active 30 DOM
-
2026-06-17days on market $65,000 Active 29 DOM
-
2026-06-16days on market $65,000 Active 28 DOM
-
2026-06-15days on market $65,000 Active 27 DOM
-
2026-06-14days on market $65,000 Active 25 DOM
-
2026-06-13days on market $65,000 Active 24 DOM
-
2026-06-10days on market $65,000 Active 22 DOM
-
2026-06-09days on market $65,000 Active 21 DOM
-
2026-06-08days on market $65,000 Active 20 DOM
-
2026-06-07days on market $65,000 Active 19 DOM
-
2026-06-05days on market $65,000 Active 16 DOM
-
2026-06-03days on market $65,000 Active 15 DOM
-
2026-06-02days on market $65,000 Active 14 DOM
-
2026-06-01days on market $65,000 Active 13 DOM
-
2026-05-31days on market $65,000 Active 12 DOM
-
2026-05-30days on market $65,000 Active 11 DOM
-
2026-05-19$65,000 Active
ⓘ Source: listings_history table (triggers on properties + properties_extension) + one-shot
backfill from property_details.listing_events for pre-trigger history.
Tax reassessment forecast AL · Resets to sale price
- Current annual tax
- $1,170 · $97/mo
- Projected year-2 tax
- $1,170 · $97/mo
- Expected delta
- $0/yr ($0/mo · 0.0%)
ⓘ Screening estimate from a state-policy table — verify with the county assessor before closing.
Climate risk First Street
- Flood 1/10 Low FEMA zone X (unshaded) · 0% chance over 30 yrs
- Wildfire 7/10 Severe
- Heat 8/10 Severe 7 d/yr ≥107°F today · 20 d/yr by 30 yrs out
- Wind 9/10 Extreme 99% chance of damaging wind over 30 yrs
- Air quality 1/10 Low 0 unhealthy d/yr today · 0 by 30 yrs out
Nearby sold comps map
Loading sold comps map…
Walkable amenities ~0.75 mi
Loading nearby amenities…
Taxation est. · year 1
- Rental income
- $17,934
- − Mortgage interest
- −$3,641
- − Property taxes
- −$1,170
- − Insurance
- −$325
- − Repairs & maintenance
- −$1,435
- − Management
- −$1,435
- − Depreciation
- −$1,891
- Taxable income
- $8,038
- Est. tax owed @ 24.0%
- −$1,929
- After-tax cash flow
- $6,654/yr
For passive investors: Depreciation is non-cash, so a rental often shows a tax loss while cash-flowing — sheltering income. Rental losses are passive: they offset passive income freely, and up to $25,000/yr can offset ordinary (W-2) income if you actively participate and your MAGI is under $100k (phasing out to $0 by $150k); unused losses carry forward. On sale, claimed depreciation is recaptured at up to 25%, and gains may owe capital-gains tax (a 1031 exchange can defer both). Figures are a year-1 estimate at your 24.0% rate — not tax advice; consult a CPA.
Schools (NCES district)
- District
- Mobile County
- NCES district ID
- 0102370
- Math proficiency
- 15% ▼ -28.00%
- Reading proficiency
- 39% ▬ 0.00%
- Median HH income
- $42,455
- Composite
- 22.9/100
- National rank
- #8002
- State rank
- #81 of 129 in AL
Livability — Citronelle
- Score
- 61/100
- State rank
- #254
- US rank
- #17928
Category grades
Schools grade is shown separately in the Schools card above.
Census & demographics
- Census place
- Citronelle, AL
- City population
- 6,892
- Population (ZIP)
- 6,892
Population outlook (Mobile County) Hauer SSP2
- Today (2025)
- 415,303 people
- By 2030
- 411,755 · -0.9%
- By 2040
- 399,670 · -3.8%
- By 2050
- 382,616 · -7.9%
- By 2075
- 337,353 · -18.8%
- By 2100
- 283,391 · -31.8%
Race, ethnicity, and origin ACS 2023
- Neighborhood character
- Predominantly White (69%)
- Race & ethnicity
- White 69% Black 18% Two or more races 7%
- Common ancestry
- Slovak 3% Lithuanian 3% Italian 2%
- Foreign-born
- 1%
- Languages at home
- 98% English-only · Other Indo-European 1%
Political lean MEDSL · Mobile
- 2024 margin
- R (+16.4) · D 41.3% · R 57.7%
- 2008→2024 swing
- -7.7pp toward R · 2008: -8.7pp · 2024: -16.4pp
- All cycles
- 2024: R+16.4 2020: R+11.9 2016: R+13.9 2012: R+9.3 2008: R+8.7
Not yet ingested
- Civics
- —
Market trends
- HPI YoY
- ▲ 27.55%
- Current HPI
- 260.4914
- Rent YoY
- —
- Metro
- —
- State GDP YoY
- ▲ 2.94%
- F500 in state
- 4
Industry mix (Fortune 500 HQ in AL)
| Industry | F500 HQs | Revenue |
|---|---|---|
| Financial Services | 1 | $8B |
|
||
| Healthcare | 1 | $5B |
|
||
Price history
1 event — show timeline
- 2026-05-19 Listed $65,000 GCMLS AL
Property tax history
+7.4%/yrLatest (2025): $1,170 · +3.7% YoY. Source: county tax records.
Cash-flow waterfall
monthlySold comps — $/sqft
last 12 mo · ≤1 miLoading sold comps…