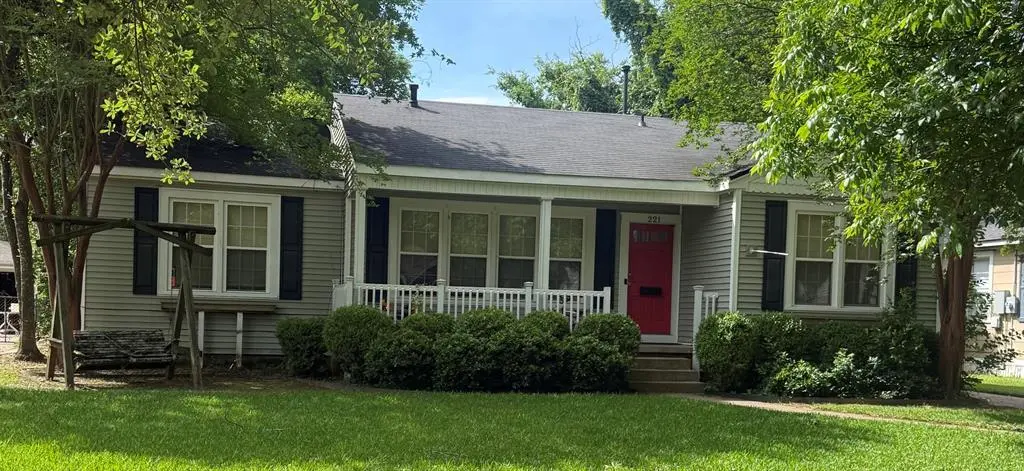
221 Pennsylvania Ave · Shreveport, LA
Flood risk 1/10 · Minimal
- FEMA flood zone
- X
- Chance of flooding over 30 yrs
- 0.0%
- Est. flood insurance / yr
- $507 – $1,088
Fire risk 1/10 · Minimal
- Est. fire insurance / yr
- $1,269 – $2,357
Heat risk 7/10 · Major
- Hot days now (above 110°F)
- 7 days/yr
- Hot days in 30 yrs
- 21 days/yr
Wind risk 6/10 · Moderate
- Chance of severe wind over 30 yrs
- 68.0%
Air-quality risk 2/10 · Minimal
- Unhealthy air days now
- 1 days/yr
- Unhealthy air days in 30 yrs
- 2 days/yr
Risk factors via First Street. Map © Google.
Why this score? — see what drove the D grade
The composite is a weighted blend of 9 inputs, each scored 0–100. Each bar is that input's sub-score; the figure is the points it added to the 100-point composite (weight × sub-score).
- Cash flow +14.0/30.0
- ARV discount +9.6/15.0
- DSCR +4.2/10.0
- 1% rule +3.5/10.0
- Rent growth +3.5/5.0
- Livability +3.0/5.0
- Condition / age +2.5/5.0
- Schools +2.2/10.0
- Appreciation +0.0/10.0
$179,000
🖨 Deal sheet (PDF) 📄 Offer letter ✓ Due diligence
Listing remarks
Excellent investment opportunity in the established Broadmoor Terrace neighborhood! This 3-bedroom, 1-bath home features 1,410 sq ft of living space and is currently tenant occupied with monthly rental income of $1,350. The current lease expires on 10-31-2026, providing immediate income potential for investors. Built in 1955, this property offers classic charm along with strong investment appeal. Conveniently located near shopping, restaurants, and schools, this home is a great option for expanding a rental portfolio or generating steady passive income. Square footage is believed to be accurate but should be verified by the buyer.
Key facts
- Tenant occupied
- 8,960 sq ft lot
- Garage
Tags
Property features AI
Finance
- Other: Property is residential, single-family use; Parcel number available
- Financial info: Treat as clear loan type; No second mortgage
- HOA & community: No association
Exterior
- Parking: Covered parking (1 covered space); Driveway; 1-car garage
- Security: Smoke detector(s)
- Utilities: City water; City sewer; No municipal utility district
- Home design: Single-family residence; One story; Detached (not attached to other properties); Built in 1955
- Construction: Year built 1955
- Exterior features: Lot approximately 0.2057 acres (64 x 140); Subdivision: Broadmoor Terrace; City water; City sewer
Interior
- Kitchen: Dishwasher; Garbage disposal; Gas cooktop; Gas range
- Bedrooms: 3 bedrooms (primary bedroom on main level)
- Flooring: No flooring details provided
- Bathrooms: 1 full bathroom
- Heating & cooling: Central heating (natural gas); Central electric air conditioning
- Interior features: Built-in features; Decorative fireplace; One living area; One dining area; Two total rooms
- Laundry & utility: No specific laundry details provided
Neighborhood map
What this means for you Summary
Snapshot
- This is a 3-bed/1.0-bath single-family listed at $179k.
Deal economics
- At list price, monthly cash flow is $22 ($265/yr) — positive.
- The deal already cash-flows at list — no discount required.
- To meet the 1% rule (rent ≥ 1% of price), the offer needs to be $153k (14.6% below list).
- Recommended offer: $153k (14.6% below list) — sets the bar for 1% rule.
Location & tenants
- Location reads 59/100 on livability (#270 in LA) — a working-class tenant base; expect higher turnover. Strengths: cost of living A+, housing A; Watch: crime F, amenities F, commute F.
- Caddo Parish (urban): math 21% / reading 32% proficiency, ranked #53 of 98 in LA (top 54%) — low school quality limits family demand, transient renter base, plan for 1-2y turnover; 64% free/reduced lunch — lower-income household profile, screen leases tightly.
- Zoned schools: Caddo Parish Middle Magnet School (math 79% / reading 93%, grade A+, #1 of 218 statewide, top 0%, 1,003 students, 23% FRL); Captain Shreve High School (math 25% / reading 41%, grade F, #116 of 265 statewide, top 44%, 1,851 students, 49% FRL) — zoned schools average 36% FRL vs 64% district-wide (28 pts lower); this property's tenant base skews higher-income than the district average.
- Zoned-school proficiency averages 60% at this address vs 26% district-wide (+33 pts) — the actual schools serving this property are materially stronger than the Caddo Parish average implies; a family-tenant draw the district grade alone would hide.
- Market conditions: Rents rising (+3.9%/yr); 148 active listings in the ZIP; 12 comparable units currently listed for rent nearby; rentals at typical pace (median 23d on market — plan ~3-4 weeks tenant-placement turnaround); 42% of comp listings sitting > 30 days — soft ceiling on asking rent; 221 units permitted in Caddo Parish in 2024 (0 in 5+ unit buildings).
Forward outlook
- Local home prices are declining (-3.0%/yr); year-one equity from $1k of loan paydown is wiped out by about $5k of value loss. Plan a longer hold.
- Caddo County population projected at -15% by 2050 — secular population decline; favor cash flow + early exit over multi-decade hold.
Negotiation context
- It's been on market 40 days — a 3% lower offer ($174k) is reasonable based on typical stale-listing flexibility.
- Current owner paid $148k; 21% above their basis — modest negotiation headroom, anchor on the comps not their cost.
Risks & watch-outs
- Watch-outs: built in 1955 — expect roof / HVAC / electrical / plumbing capex.
- Climate carrying-cost: major wind risk, 68% chance of damaging wind over 30y; extreme-heat days projected 7→21/yr by 2055 (HVAC capex compounding) — expect insurance premiums to compound above CPI over the hold.
Questions for the listing agent
- It's been on market 40 days. Have you received any prior offers? Is the seller open to a 15% concession, seller financing, or rate buy-down credit?
- Built in 1955 — when were the roof, HVAC, electrical panel, plumbing, and water heater last replaced?
- Is there a deadline driving the sale (1031 exchange, divorce, estate, relocation)? That informs how much negotiation room exists.
- Schools are D-rated, which usually means shorter tenancies and higher turnover. Who's the typical renter profile here, and what's been the actual vacancy rate?
- Crime grade is F in this area — have there been break-ins, vandalism, or insurance claims at this property in the last 3 years? What carrier currently insures it and at what premium?
- The area grade is low — what's the realistic commute time and amenity access for the typical tenant pool here? Any planned neighborhood developments (good or bad) we should know about?
- What's the average days-on-market for RENTAL listings here right now (not sales)? A rising rental-DOM trend means longer vacancies and softer asking-rent achievability than the comps imply.
- What's the recent tenant-quality profile in this submarket — average credit score on applications, eviction rate, late-payment / NSF rate, and stable-employment percentage? A property-management company in the area should have these aggregated.
- How much new for-sale + rental construction is in the pipeline within 1–3 miles? Heavy new supply typically softens prices + rents 12–24 months out; constrained supply supports both.
Investment metrics
- 1% rule
- 0.85% ✗
- Cap rate
- 6.44%
- Cash-on-cash
- 0.53%
- DSCR
- 1.02
- GRM
- 9.8
CMA / ARV
- ARV (median comp)
- $187,889
- List price
- $179,000
- Delta
- -4.73%
- Verdict
- FAIR
- Comps
- 20 within 1.0 mi
Show comp detail 12 sales within ~0.75 mi
| Address | Dist | Beds/Ba | Sqft | Sold | Price | $/sf | Match |
|---|---|---|---|---|---|---|---|
| 174 Lynn Ave | 0.20mi | 3/2.0 | 1,550 (+6%) | 1mo | $199,000 | $128 | 76 |
| 258 Carrollton Ave | 0.23mi | 3/2.0 | 1,592 (+8%) | 1mo | $229,000 | $144 | 71 |
| 180 Charles Ave | 0.28mi | 3/1.0 | 1,606 (+9%) | 2mo | $179,995 | $112 | 70 |
| 172 Fremont St | 0.47mi | 2/1.0 (-1) | 1,535 (+4%) | 2mo | $74,900 | $49 | 64 |
| 309 E Southfield Rd | 0.71mi | 3/2.0 | 1,416 (-4%) | 1mo | $165,000 | $117 | 56 |
| 4350 Finley Dr | 0.64mi | 3/2.0 | 1,608 (+10%) | 1mo | $200,000 | $124 | 49 |
| 271 Ockley Dr | 0.52mi | 3/2.0 | 1,669 (+14%) | 0mo | $229,900 | $138 | 49 |
| 166 Albert Ave #1 | 0.73mi | 2/2.0 (-1) | 1,391 (-5%) | 0mo | $173,000 | $124 | 48 |
| 326 Albany Ave | 0.70mi | 2/1.0 (-1) | 1,355 (-8%) | 2mo | $189,000 | $139 | 48 |
| 2025 Horton Ave | 0.72mi | 3/2.0 | 1,655 (+13%) | 0mo | $135,000 | $82 | 41 |
| 313 Fontaine St | 0.74mi | 3/2.0 | 1,268 (-14%) | 0mo | $198,900 | $157 | 38 |
| 4524 Clingman Dr | 0.68mi | 2/2.0 (-1) | 1,664 (+13%) | 1mo | $207,500 | $125 | 36 |
Match score weights: distance 35% · size 25% · config 20% · recency 20%. Top-matched comps best support the ARV.
Projected returns pro-forma
-3.0% appreciation · 3.93% rent growth · sell at horizon
- IRR
- -14.5%
- Equity multiple
- 0.48×
- Total profit
- $-26,166
- Equity at exit
- $26,689
- IRR
- -4.4%
- Equity multiple
- 0.70×
- Total profit
- $-14,973
- Equity at exit
- $15,477
Cash invested: $50,120 (down + closing). Projections, not guarantees.
Landlord ↔ Tenant lean methodology
- Overall (STATE)
- 90 Strongly Landlord-Friendly
- State Louisiana
- 90 Strongly Landlord-Friendly · R+12
- County
- — inherits STATE
- City
- — inherits STATE
ZIP-level market 71105
- Rents YoY
- 3.9%
- Active inventory
- 148
- Price-to-rent
- 9.8×
Monthly cashflow live
- Estimated rent
- $1,529 high interval (Pro) →
- Mortgage (P&I)
- −$939
- Tax from tax record
- −$172 /mo · $2,068/yr
- Insurance
- −$75
- HOA
- −$0
- Vacancy / Maint / Mgmt
- −$321
- Net cashflow
- $22
Break-even live
Sensitivity live
| Price | -10% $123 | -5% $73 | +0% $22 | +5% $-29 | +10% $-79 |
|---|---|---|---|---|---|
| Rent | -10% $-99 | -5% $-38 | +0% $22 | +5% $82 | +10% $143 |
| Rate | -1.0pp $112 | -0.5pp $68 | base $22 | +0.5pp $-24 | +1.0pp $-72 |
UW: 25.0% down · 7.5% · 30yr · 1.5% tax · 5.0% vac · 8.0% maint · 8.0% mgmt
Financing live
Cash to close
- Down payment
- $44,750
- Closing costs
- $5,370
- Reserves months
- —
- Total cash needed
- —
Loan-product check · same deal, 3 products live
Conventional
25% down · 7.5% · 30yr
- Down + closing
- —
- Monthly P&I
- —
- Monthly cashflow
- —
- DSCR
- —
- Eligible?
- —
Personal DTI + credit; lowest rate.
DSCR
20% down · 8.5% · 30yr
- Down + closing
- —
- Monthly P&I
- —
- Monthly cashflow
- —
- DSCR
- —
- Eligible?
- —
No personal income docs; deal must DSCR.
Hard money
10% down · 12.0% · 12mo
- Down + closing
- —
- Monthly P&I
- —
- Monthly cashflow
- —
- DSCR
- —
- Eligible?
- —
Short-term bridge; refi at stabilization.
Rent comps 12 comps
| Address | Beds | Baths | Sqft | Rent | $/sqft | DOM | Units | Dist |
|---|---|---|---|---|---|---|---|---|
| 216 Pennsylvania Ave Shreveport, LA | 3.0 | 1.0 | 1199 | $1,250 | $1.04 | 23d | 1 | 0.03mi |
| 204 Leo Ave Shreveport, LA | 4.0 | 2.0 | 1846 | $2,000 | $1.08 | 15d | 1 | 0.20mi |
| 243 Justin Ave Shreveport, LA | 3.0 | 1.0 | 1236 | $1,400 | $1.13 | 45d | 1 | 0.26mi |
| 186 Charles Ave Shreveport, LA | 3.0 | 1.0 | 1320 | $1,675 | $1.27 | 23d | 1 | 0.29mi |
| 119 Charles Ave Shreveport, LA | 3.0 | 2.0 | 1518 | $1,800 | $1.19 | 45d | 1 | 0.43mi |
| 154 Southfield Rd Shreveport, LA | 3.0 | 1.0 | 1258 | $1,395 | $1.11 | 45d | 1 | 0.45mi |
| 2033 Horton Ave Shreveport, LA | 3.0 | 2.0 | 1681 | $1,750 | $1.04 | 23d | 1 | 0.72mi |
| 4024 Reily Ln Shreveport, LA | 3.0 | 1.0 | 1220 | $1,275 | $1.05 | 23d | 1 | 0.92mi |
| 219 E Slattery Blvd Shreveport, LA | 2.0 | 1.0 | 1047 | $1,000 | $0.96 | 45d | 1 | 1.16mi |
| 715 Camilla Dr Shreveport, LA | 3.0 | 1.0 | 1654 | $1,350 | $0.82 | 45d | 1 | 1.29mi |
| 3516 Alexander Ave Shreveport, LA | 2.0 | 1.0 | 1355 | $1,250 | $0.92 | 15d | 1 | 1.39mi |
| 3201 Knight St Shreveport, LA | 1.0–2.0 | 1.0 | 781 | $900 | $1.15 | 15d | 3 | 1.46mi |
Listing history 24 events
-
2026-06-21days on market $179,000 Active 40 DOM
-
2026-06-18days on market $179,000 Active 37 DOM
-
2026-06-17days on market $179,000 Active 36 DOM
-
2026-06-16days on market $179,000 Active 35 DOM
-
2026-06-15days on market $179,000 Active 34 DOM
-
2026-06-14days on market $179,000 Active 32 DOM
-
2026-06-13days on market $179,000 Active 31 DOM
-
2026-06-10days on market $179,000 Active 29 DOM
-
2026-06-09days on market $179,000 Active 28 DOM
-
2026-06-08days on market $179,000 Active 27 DOM
-
2026-06-07days on market $179,000 Active 26 DOM
-
2026-06-05days on market $179,000 Active 23 DOM
-
2026-06-03days on market $179,000 Active 22 DOM
-
2026-06-02days on market $179,000 Active 21 DOM
-
2026-06-01days on market $179,000 Active 20 DOM
-
2026-05-31days on market $179,000 Active 19 DOM
-
2026-05-30days on market $179,000 Active 18 DOM
-
2026-05-12$179,000 Active 645-char remark
-
2022-02-03price $1,350
-
2018-09-17soldstatus $147,500
-
2014-11-06soldstatus $144,000
-
2007-10-11soldstatus
-
2004-04-29soldstatus
-
1989-06-28soldstatus
ⓘ Source: listings_history table (triggers on properties + properties_extension) + one-shot
backfill from property_details.listing_events for pre-trigger history.
Tax reassessment forecast LA · Resets to sale price
- Current annual tax
- $2,068 · $172/mo
- Projected year-2 tax
- $2,068 · $172/mo
- Expected delta
- $0/yr ($0/mo · 0.0%)
ⓘ Screening estimate from a state-policy table — verify with the county assessor before closing.
Climate risk First Street
- Flood 1/10 Low FEMA zone X · 0% chance over 30 yrs
- Wildfire 1/10 Low
- Heat 7/10 Severe 7 d/yr ≥110°F today · 21 d/yr by 30 yrs out
- Wind 6/10 Major 68% chance of damaging wind over 30 yrs
- Air quality 2/10 Low 1 unhealthy d/yr today · 2 by 30 yrs out
Nearby sold comps map
Loading sold comps map…
Walkable amenities ~0.75 mi
Loading nearby amenities…
Taxation est. · year 1
- Rental income
- $18,345
- − Mortgage interest
- −$10,027
- − Property taxes
- −$2,068
- − Insurance
- −$895
- − Repairs & maintenance
- −$1,468
- − Management
- −$1,468
- − Depreciation
- −$5,207
- Taxable loss
- −$2,788
- Est. tax savings @ 24.0%
- +$669
- After-tax cash flow
- $934/yr
For passive investors: Depreciation is non-cash, so a rental often shows a tax loss while cash-flowing — sheltering income. Rental losses are passive: they offset passive income freely, and up to $25,000/yr can offset ordinary (W-2) income if you actively participate and your MAGI is under $100k (phasing out to $0 by $150k); unused losses carry forward. On sale, claimed depreciation is recaptured at up to 25%, and gains may owe capital-gains tax (a 1031 exchange can defer both). Figures are a year-1 estimate at your 24.0% rate — not tax advice; consult a CPA.
Schools (NCES district)
- District
- Caddo Parish
- NCES district ID
- 2200300
- Math proficiency
- 21% ▼ -33.00%
- Reading proficiency
- 32% ▼ -30.00%
- Median HH income
- $39,227
- Composite
- 22.23/100
- National rank
- #8148
- State rank
- #53 of 98 in LA
Livability — Shreveport
- Score
- 59/100
- State rank
- #270
- US rank
- #19730
Category grades
Schools grade is shown separately in the Schools card above.
Census & demographics
- Census place
- Shreveport, LA
- County
- Caddo Parish · 178,536 people
- City population
- 164,123
- Metro
- Shreveport-Bossier City, LA
- Population (ZIP)
- 20,179
- Household income
- $67,968
- Rent vs Own
- Severe rent burden
- 1007.0
Population outlook (Caddo County) Hauer SSP2
- Today (2025)
- 243,190 people
- By 2030
- 237,231 · -2.5%
- By 2040
- 222,502 · -8.5%
- By 2050
- 206,516 · -15.1%
- By 2075
- 165,706 · -31.9%
- By 2100
- 122,262 · -49.7%
Race, ethnicity, and origin ACS 2023
- Neighborhood character
- Predominantly White (68%)
- Race & ethnicity
- White 68% Black 20% Two or more races 7% Hispanic / Latino 5% Asian 4%
- Hispanic origin (detail)
- Mexican 2%
- Common ancestry
- Lithuanian 3% Serbian 3% Slovak 2%
- Foreign-born
- 5% · Canada, China
- Languages at home
- 93% English-only · Spanish 2% Other Indo-European 1% Russian/Polish/Slavic 1%
Political lean MEDSL · Caddo
- 2024 margin
- Toss-up / Even · D 51.6% · R 47.0% · Other 1.4%
- 2008→2024 swing
- +1.6pp toward D · 2008: 3.0pp · 2024: 4.6pp
- All cycles
- 2024: D+4.6 2020: D+6.8 2016: D+4.2 2012: D+4.9 2008: D+3.0
Not yet ingested
- Civics
- —
Market trends
- HPI YoY
- ▼ -96.75%
- Current HPI
- 129.572
- Rent YoY
- ▲ 3.93%
- Metro
- Shreveport-Bossier City, LA
- State GDP YoY
- ▲ 3.29%
- F500 in state
- 10
Industry mix (Fortune 500 HQ in LA)
| Industry | F500 HQs | Revenue |
|---|---|---|
| Telecommunications | 2 | $23B |
|
||
| Utilities | 1 | $12B |
|
||
| Wholesale / Distribution | 1 | $5B |
|
||
| Advertising | 1 | $2B |
|
||
Price history
+24.3% since first listed7 events — show timeline
- 2026-05-12 Listed $179,000 NTREIS
- 2022-02-03 Price Changed $1,350 RENT.
- 2018-09-17 Sold (Public Records) $147,500 Public Records
- 2014-11-06 Sold (Public Records) $144,000 Public Records
- 2007-10-11 Sold (Public Records) — Public Records
- 2004-04-29 Sold (Public Records) — Public Records
- 1989-06-28 Sold (Public Records) — Public Records
Property tax history
+6.9%/yrLatest (2025): $2,068 · +0.4% YoY. Source: county tax records.
Cash-flow waterfall
monthlySold comps — $/sqft
last 12 mo · ≤1 miLoading sold comps…