 Multi-family
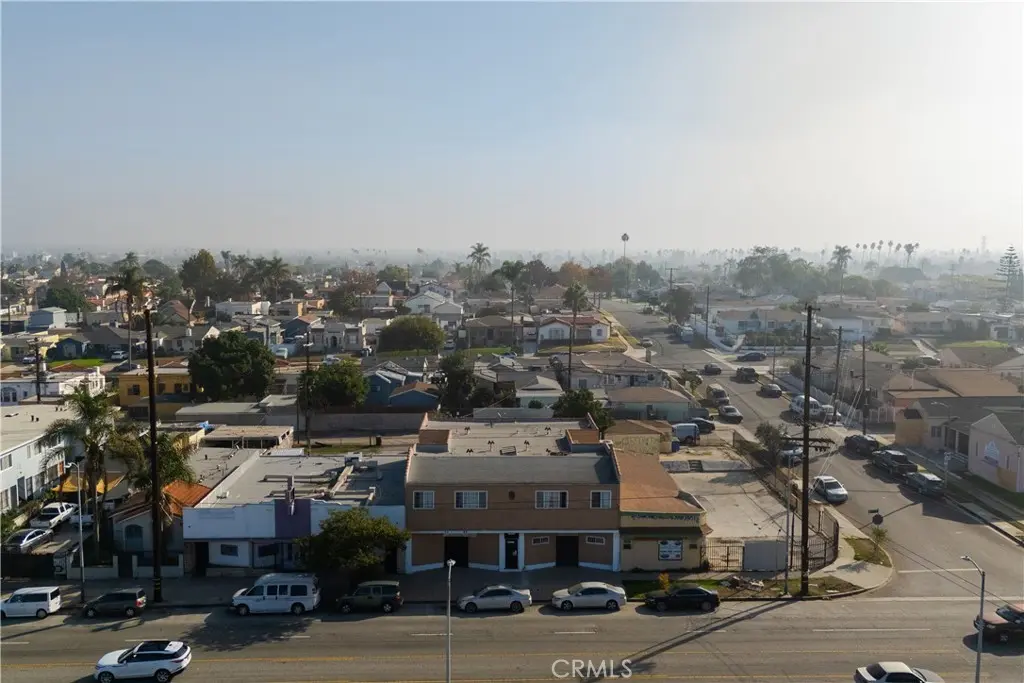
9318 S Western · Los Angeles, CA
Flood risk No data
- FEMA flood zone
- —
- Chance of flooding over 30 yrs
- —
- Est. flood insurance / yr
- —
Fire risk No data
- Est. fire insurance / yr
- —
Heat risk No data
- Hot days now (above threshold)
- —
- Hot days in 30 yrs
- —
Wind risk No data
- Chance of severe wind over 30 yrs
- —
Air-quality risk No data
- Unhealthy air days now
- —
- Unhealthy air days in 30 yrs
- —
Risk factors via First Street. Map © Google.
Why this score? — see what drove the B- grade
The composite is a weighted blend of 9 inputs, each scored 0–100. Each bar is that input's sub-score; the figure is the points it added to the 100-point composite (weight × sub-score).
- Cash flow +24.6/30.0
- ARV discount +15.0/15.0
- DSCR +7.9/10.0
- 1% rule +6.4/10.0
- Rent growth +3.9/5.0
- Schools +3.6/10.0
- Livability +3.4/5.0
- Condition / age +2.2/5.0
- Appreciation +0.0/10.0
$800,000
🖨 Deal sheet 📄 Offer letter ✓ Due diligence
Multi-family units
County records classify this as Multi-Family (2-4 Unit). Listing-text estimate: 1 unit. estimate disagrees with records
Listing remarks MLS
Located in a high-demand area near a major stadium, entertainment venues, shopping, dining, and next to freeways. Attractive appeal for both business tenants and residents. A rare opportunity for investors seeking upside potential in a growing location. Prime mixed-use investment opportunity featuring 2 street-front commercial storefronts and 4 spacious one-bedroom residential units. The four-car garage may offer potential for future ADU conversion or additional income opportunities. This versatile property offers multiple income streams with commercial spaces ideal for office, retail, service-based businesses, studio use, or boutique concepts, plus residential units that may be ideal for short-term rentals, Airbnb, corporate housing, traveling professionals, recovery housing, transitional living, or furnished extended stays (buyer to verify all local ordinances, licensing, and permit requirements).
Key facts
- Major stadium
- Four-car garage
- High-demand area
Tags
Neighborhood map
What this means for you Summary
Snapshot
- This is a 4-bed/6.0-bath multifamily listed at $800k. Condition is rated fair.
Deal economics
- At list price, monthly cash flow is $2k ($20k/yr) — positive.
- The deal already cash-flows at list — no discount required.
- Meets the 1% rule at list price ($9k rent vs $800k).
- Recommended offer: $776k (3.0% below list) — sets the bar for market timing.
- Cap rate 8.8% vs local median 2.1% in Los Angeles — top-decile yield for the area; either an underpriced asset or a hidden risk that comps aren't pricing in. Stress-test before assuming the spread holds.
Location & tenants
- Location reads 68/100 on livability (#273 in CA) — a middle-class / working-renter tenant base. Strengths: amenities A+, commute A+, employment B; Watch: health & safety C-, schools D+, crime F.
- Los Angeles Unified (urban): math 29% / reading 54% proficiency, ranked #223 of 517 in CA (top 43%) — families likely to look elsewhere, expect single-tenant / working-renter base with shorter leases; 67% free/reduced lunch — lower-income household profile, screen leases tightly.
- Market conditions: Rents rising fast (+5.5%/yr); 138 active listings in the ZIP; 1 comparable units currently listed for rent nearby; 19,697 units permitted in Los Angeles County in 2024 (9,426 in 5+ unit buildings).
- At $9,091/mo this rent would consume 152% of the median local household income ($72k/yr) (locally 3323% of renters already pay >50% of income on rent) — very limited rent-growth headroom before tenants either downsize or default.
Forward outlook
- Local home prices are declining (-3.0%/yr); year-one equity from $6k of loan paydown is wiped out by about $24k of value loss. Plan a longer hold.
- Los Angeles County population projected at +9% by 2050 — modest demand growth; plan on rents tracking national, not racing it.
- At projected returns (-3.0% appreciation + 5.5% rent growth), your $224k cash investment doubles in ~9 years — after that, you're playing with house money.
Negotiation context
- It's been on market 43 days — a 3% lower offer ($776k) is reasonable based on typical stale-listing flexibility.
- 3 sale attempts since 2y ago with the ask held roughly flat each time — persistent listings suggest the price (not the market) is what's stuck; bring a comps-based counter.
Risks & watch-outs
- Watch-outs: built in 1947 — expect roof / HVAC / electrical / plumbing capex.
Questions for the listing agent
- It's been on market 43 days. Have you received any prior offers? Is the seller open to a 3% concession, seller financing, or rate buy-down credit?
- Have any recent inspections been done? Can we get a copy of the seller's disclosures and any deferred-maintenance estimates?
- Built in 1947 — when were the roof, HVAC, electrical panel, plumbing, and water heater last replaced?
- Is there a deadline driving the sale (1031 exchange, divorce, estate, relocation)? That informs how much negotiation room exists.
- Schools are D-rated, which usually means shorter tenancies and higher turnover. Who's the typical renter profile here, and what's been the actual vacancy rate?
- Crime grade is F in this area — have there been break-ins, vandalism, or insurance claims at this property in the last 3 years? What carrier currently insures it and at what premium?
- What's the average days-on-market for RENTAL listings here right now (not sales)? A rising rental-DOM trend means longer vacancies and softer asking-rent achievability than the comps imply.
- What's the recent tenant-quality profile in this submarket — average credit score on applications, eviction rate, late-payment / NSF rate, and stable-employment percentage? A property-management company in the area should have these aggregated.
- How much new apartment / multifamily construction is in the pipeline within 1–3 miles? Heavy new supply (>2% of stock underway) typically softens rents 12–24 months out; light construction supports rent growth.
Investment metrics
- 1% rule
- 1.14% ✓
- Cap rate
- 8.77%
- Cash-on-cash
- 8.86%
- DSCR
- 1.39
- GRM
- 7.3
CMA / ARV
- ARV (median comp)
- $1,546,572
- List price
- $800,000
- Delta
- -48.27%
- Verdict
- UNDERPRICED
- Comps
- 17 within 1.0 mi
Projected returns pro-forma
-3.0% appreciation · 5.51% rent growth · sell at horizon
- IRR
- -0.1%
- Equity multiple
- 1.00×
- Total profit
- $-666
- Equity at exit
- $119,283
- IRR
- 12.0%
- Equity multiple
- 2.06×
- Total profit
- $237,237
- Equity at exit
- $69,169
Cash invested: $224,000 (down + closing). Projections, not guarantees.
Landlord ↔ Tenant lean methodology
- Overall (CITY)
- 0 Strongly Tenant-Friendly
- State California
- 18 Strongly Tenant-Friendly · D+13
- County
- — inherits STATE
- City Los Angeles
- 0 Strongly Tenant-Friendly · D+22
ZIP-level market 90047
- Rents YoY
- 5.5%
- Active inventory
- 138
- Price-to-rent
- 29.3×
Monthly cashflow live
- Estimated rent
- $9,091 high interval (Pro) →
- Mortgage (P&I)
- −$4,195
- Tax est. 1.5%
- −$1,000 /mo · $12,000/yr
- Insurance
- −$333
- HOA
- −$0
- Vacancy / Maint / Mgmt
- −$1,909
- Net cashflow
- $1,653
Break-even live
4-unit breakdown (identical units grouped — click to expand)
| Units | Beds | Baths | Est. rent |
|---|---|---|---|
| 4× units | 1 | 1 | $9,092 |
| #1 | 1 | 1 | $2,273 |
| #2 | 1 | 1 | $2,273 |
| #3 | 1 | 1 | $2,273 |
| #4 | 1 | 1 | $2,273 |
| Total (4 units) | $9,091 | ||
UW: 25.0% down · 7.5% · 30yr · 1.5% tax · 5.0% vac · 8.0% maint · 8.0% mgmt
Financing live
Cash to close
- Down payment
- $200,000
- Closing costs
- $24,000
- Reserves months
- —
- Total cash needed
- —
Loan-product check · same deal, 3 products live
Conventional
25% down · 7.5% · 30yr
- Down + closing
- —
- Monthly P&I
- —
- Monthly cashflow
- —
- DSCR
- —
- Eligible?
- —
Personal DTI + credit; lowest rate.
DSCR
20% down · 8.5% · 30yr
- Down + closing
- —
- Monthly P&I
- —
- Monthly cashflow
- —
- DSCR
- —
- Eligible?
- —
No personal income docs; deal must DSCR.
Hard money
10% down · 12.0% · 12mo
- Down + closing
- —
- Monthly P&I
- —
- Monthly cashflow
- —
- DSCR
- —
- Eligible?
- —
Short-term bridge; refi at stabilization.
Rent comps 1 comps
| Address | Beds | Baths | Sqft | Rent | $/sqft | DOM | Units | Dist |
|---|---|---|---|---|---|---|---|---|
| 3212 W 84th Pl #1 Inglewood, CA | 3.0 | 2.0 | 4628 | $3,700 | $0.80 | 43d | 1 | 1.33mi |
Listing history 24 events
-
2026-06-18days on market $800,000 Active 43 DOM
-
2026-06-17days on market $800,000 Active 42 DOM
-
2026-06-16days on market $800,000 Active 41 DOM
-
2026-06-15days on market $800,000 Active 40 DOM
-
2026-06-13days on market $800,000 Active 38 DOM
-
2026-06-09days on market $800,000 Active 34 DOM
-
2026-06-08days on market $800,000 Active 33 DOM
-
2026-06-07statusdays on market $800,000 Active 32 DOM
-
2026-06-04days on market $800,000 Active Under Contract 29 DOM
-
2026-06-03days on market $800,000 Active Under Contract 28 DOM
-
2026-06-02days on market $800,000 Active Under Contract 27 DOM
-
2026-06-01days on market $800,000 Active Under Contract 26 DOM
-
2026-05-31days on market $800,000 Active Under Contract 25 DOM
-
2026-05-20historical Active Under Contract 912-char remark
Show marketing remark (912 chars)
Located in a high-demand area near a major stadium, entertainment venues, shopping, dining, and next to freeways. Attractive appeal for both business tenants and residents. A rare opportunity for investors seeking upside potential in a growing location. Prime mixed-use investment opportunity featuring 2 street-front commercial storefronts and 4 spacious one-bedroom residential units. The four-car garage may offer potential for future ADU conversion or additional income opportunities. This versatile property offers multiple income streams with commercial spaces ideal for office, retail, service-based businesses, studio use, or boutique concepts, plus residential units that may be ideal for short-term rentals, Airbnb, corporate housing, traveling professionals, recovery housing, transitional living, or furnished extended stays (buyer to verify all local ordinances, licensing, and permit requirements).
-
2026-05-12status Pending Sale 912-char remark
Show marketing remark (912 chars)
Located in a high-demand area near a major stadium, entertainment venues, shopping, dining, and next to freeways. Attractive appeal for both business tenants and residents. A rare opportunity for investors seeking upside potential in a growing location. Prime mixed-use investment opportunity featuring 2 street-front commercial storefronts and 4 spacious one-bedroom residential units. The four-car garage may offer potential for future ADU conversion or additional income opportunities. This versatile property offers multiple income streams with commercial spaces ideal for office, retail, service-based businesses, studio use, or boutique concepts, plus residential units that may be ideal for short-term rentals, Airbnb, corporate housing, traveling professionals, recovery housing, transitional living, or furnished extended stays (buyer to verify all local ordinances, licensing, and permit requirements).
-
2026-04-27$800,000 Active 912-char remark
Show marketing remark (912 chars)
Located in a high-demand area near a major stadium, entertainment venues, shopping, dining, and next to freeways. Attractive appeal for both business tenants and residents. A rare opportunity for investors seeking upside potential in a growing location. Prime mixed-use investment opportunity featuring 2 street-front commercial storefronts and 4 spacious one-bedroom residential units. The four-car garage may offer potential for future ADU conversion or additional income opportunities. This versatile property offers multiple income streams with commercial spaces ideal for office, retail, service-based businesses, studio use, or boutique concepts, plus residential units that may be ideal for short-term rentals, Airbnb, corporate housing, traveling professionals, recovery housing, transitional living, or furnished extended stays (buyer to verify all local ordinances, licensing, and permit requirements).
-
2025-08-26historical
-
2025-05-28price $1,040,000
-
2025-04-28price $1,050,000
-
2025-02-12price $1,095,000
-
2024-10-03$1,100,000 Active
-
2024-09-10historical
-
2024-05-01price $1,100,000
-
2024-03-20$1,350,000 Active
ⓘ Source: listings_history table (triggers on properties + properties_extension) + one-shot
backfill from property_details.listing_events for pre-trigger history.
Nearby sold comps map
Loading sold comps map…
Walkable amenities ~0.75 mi
Loading nearby amenities…
Taxation est. · year 1
- Rental income
- $109,092
- − Mortgage interest
- −$44,812
- − Property taxes
- −$12,000
- − Insurance
- −$4,000
- − Repairs & maintenance
- −$8,727
- − Management
- −$8,727
- − Depreciation
- −$23,273
- Taxable income
- $7,552
- Est. tax owed @ 24.0%
- −$1,813
- After-tax cash flow
- $18,027/yr
For passive investors: Depreciation is non-cash, so a rental often shows a tax loss while cash-flowing — sheltering income. Rental losses are passive: they offset passive income freely, and up to $25,000/yr can offset ordinary (W-2) income if you actively participate and your MAGI is under $100k (phasing out to $0 by $150k); unused losses carry forward. On sale, claimed depreciation is recaptured at up to 25%, and gains may owe capital-gains tax (a 1031 exchange can defer both). Figures are a year-1 estimate at your 24.0% rate — not tax advice; consult a CPA.
Condition & rehab AI · 9 photos
This multi-family property requires significant repairs and maintenance, but presents a rare opportunity for investors in a high-demand area. Upgrades to the exterior, roof, and HVAC system would significantly increase its value.
Repairs flagged
- Major exterior siding — Significant wear and tear
- Major roof — Aged and possibly leaking
- Major flooring — Concrete floors need resurfacing
- Major interior walls/paint — Paint needs repainting
Value-add opportunities
- Both exterior painting — Enhances curb appeal and property value
- Both roof replacement — Fixes major issue and extends property lifespan
- Both floor resurfacing — Improves living conditions and property value
- Both HVAC system upgrade — Improves comfort and energy efficiency
Renovation cost estimate screening
| Repair item | Severity | Est. cost |
|---|---|---|
| exterior siding · Significant wear and tear | Major | $15,000–50,000 |
| roof · Aged and possibly leaking | Major | $15,000–50,000 |
| flooring · Concrete floors need resurfacing | Major | $15,000–50,000 |
| interior walls/paint · Paint needs repainting | Major | $15,000–50,000 |
| Total estimated repair cost · 4 items | $60,000–200,000 |
Value-add ROI direction
- Both exterior painting — Enhances curb appeal and property value ↑
- Both roof replacement — Fixes major issue and extends property lifespan ↑
- Both floor resurfacing — Improves living conditions and property value ↑
- Both HVAC system upgrade — Improves comfort and energy efficiency ↑
ⓘ Cost ranges are severity-bucket heuristics (US national rule-of-thumb). Get contractor quotes + a written scope before underwriting a rehab budget.
Schools (NCES district)
- District
- Los Angeles Unified
- NCES district ID
- 0622710
- Math proficiency
- 29% ▼ -4.00%
- Reading proficiency
- 54% ▲ 10.00%
- Median HH income
- $50,403
- Composite
- 35.67/100
- National rank
- #4875
- State rank
- #223 of 517 in CA
Livability — Los Angeles
- Score
- 68/100
- State rank
- #273
- US rank
- #9237
Category grades
Schools grade is shown separately in the Schools card above.
Census & demographics
- Census place
- Los Angeles, CA
- County
- Los Angeles County · 9,444,647 people
- City population
- 3,838,149
- Metro
- Los Angeles-Long Beach-Anaheim, CA
- Population (ZIP)
- 50,974
- Household income
- $71,664
- Rent vs Own
- Severe rent burden
- 3323.0
Population outlook (Los Angeles County) Hauer SSP2
- Today (2025)
- 10,940,515 people
- By 2030
- 11,256,481 · +2.9%
- By 2040
- 11,729,929 · +7.2%
- By 2050
- 11,948,407 · +9.2%
- By 2075
- 11,818,114 · +8.0%
- By 2100
- 10,842,928 · -0.9%
Race, ethnicity, and origin ACS 2023
- Neighborhood character
- Diverse neighborhood (Simpson 0.58)
- Race & ethnicity
- Black 52% Hispanic / Latino 39% Two or more races 13% White 3% Native American 1%
- Hispanic origin (detail)
- Mexican 21%
- Common ancestry
- British 2%
- Foreign-born
- 18% · Canada
- Languages at home
- 63% English-only · Spanish 35% German/W. Germanic 1%
Political lean MEDSL · Los Angeles
- 2024 margin
- Solid D (+32.9) · D 64.8% · R 31.9% · Other 3.3%
- 2008→2024 swing
- -7.4pp toward R · 2008: 40.4pp · 2024: 32.9pp
- All cycles
- 2024: D+32.9 2020: D+44.2 2016: D+48.0 2012: D+40.0 2008: D+40.4
Not yet ingested
- Civics
- —
Market trends
- HPI YoY
- ▼ -625.31%
- Current HPI
- 480.8774
- Rent YoY
- ▲ 5.51%
- Metro
- Los Angeles-Long Beach-Anaheim, CA
- State GDP YoY
- ▲ 3.21%
- F500 in state
- 116
Industry mix (Fortune 500 HQ in CA)
| Industry | F500 HQs | Revenue |
|---|---|---|
| Technology | 27 | $1,492B |
|
||
| Financial Services | 3 | $174B |
|
||
| Retail | 3 | $44B |
|
||
| Insurance | 3 | $26B |
|
||
| Media / Entertainment | 2 | $115B |
|
||
| Pharmaceuticals / Biotech | 2 | $62B |
|
||
Price history
-40.7% since first listed11 events — show timeline
- 2026-05-20 Contingent — CRMLS
- 2026-05-12 Pending — CRMLS
- 2026-04-27 Listed $800,000 CRMLS
- 2025-08-26 Listing Removed — CRMLS
- 2025-05-28 Price Changed $1,040,000 CRMLS
- 2025-04-28 Price Changed $1,050,000 CRMLS
- 2025-02-12 Price Changed $1,095,000 CRMLS
- 2024-10-03 Listed $1,100,000 CRMLS
- 2024-09-10 Listing Removed — CRMLS
- 2024-05-01 Price Changed $1,100,000 CRMLS
- 2024-03-20 Listed $1,350,000 CRMLS
Cash-flow waterfall
monthlySold comps — $/sqft
last 12 mo · ≤1 miLoading sold comps…