308 B St · Leland, IA
Flood risk 1/10 · Minimal
- FEMA flood zone
- X (unshaded)
- Chance of flooding over 30 yrs
- 0.0%
- Est. flood insurance / yr
- $473 – $860
Fire risk 4/10 · Minor
- Est. fire insurance / yr
- $902 – $1,676
Heat risk 2/10 · Minimal
- Hot days now (above 99°F)
- 7 days/yr
- Hot days in 30 yrs
- 16 days/yr
Wind risk 2/10 · Minimal
- Chance of severe wind over 30 yrs
- —
Air-quality risk 1/10 · Minimal
- Unhealthy air days now
- 0 days/yr
- Unhealthy air days in 30 yrs
- 0 days/yr
Risk factors via First Street. Map © Google.
Why this score? — see what drove the A grade
The composite is a weighted blend of 9 inputs, each scored 0–100. Each bar is that input's sub-score; the figure is the points it added to the 100-point composite (weight × sub-score).
- Cash flow +30.0/30.0
- ARV discount +15.0/15.0
- 1% rule +10.0/10.0
- DSCR +10.0/10.0
- Appreciation +7.8/10.0
- Schools +6.1/10.0
- Livability +3.2/5.0
- Rent growth +2.5/5.0
- Condition / age +2.5/5.0
$59,000
🖨 Deal sheet 📄 Offer letter ✓ Due diligence
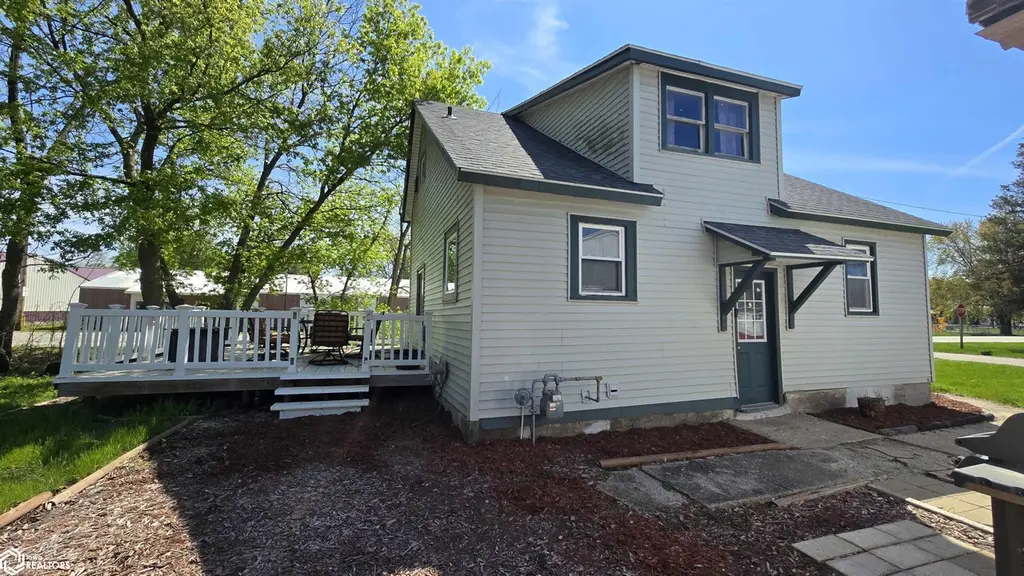
Listing remarks
Charming 1.5-story home situated on a spacious corner lot, offering over 1,100 square feet of potential! The exterior features low-maintenance vinyl siding and a newer rear deck—perfect for relaxing or entertaining. Step inside to find a functional U-shaped kitchen that flows into the dining and living areas, creating an inviting main living space. The main level includes a comfortable bedroom complete with its own en-suite bath for added convenience. Upstairs, you’ll find a generously sized second bedroom with access to an additional bonus area—ideal for a nursery, walk-in closet, or flex space. A full bathroom with a jacuzzi tub completes the upper level. Outside, enjoy
Key facts
- U-shaped kitchen
- En-suite bath
- Vinyl siding
Tags
Property features AI
Finance
- Financial info: Annual tax: $876
Exterior
- Parking: Detached 2-car garage
- Utilities: Public water; Public sewer
- Home design: Single-family residence; One and a half stories
- Construction: Vinyl siding
- Exterior features: Lot approximately 0.26 acres (94.5' x 120'); Located on highway through town; Subdivision: Benson Original Town
Interior
- Bathrooms: 2 full bathrooms
- Heating & cooling: Forced air heating; Window unit cooling
- Interior features: Basement
Neighborhood map
What this means for you Summary
Snapshot
- This is a 2-bed/1.0-bath single-family listed at $59k.
Deal economics
- At list price, monthly cash flow is $392 ($5k/yr) — positive.
- The deal already cash-flows at list — no discount required.
- Meets the 1% rule at list price ($1k rent vs $59k).
- Recommended offer: $57k (3.0% below list) — sets the bar for market timing.
Location & tenants
- Location reads 63/100 on livability (#669 in IA) — a middle-class / working-renter tenant base. Strengths: cost of living A+, housing A; Watch: employment C-, health & safety C-, schools F.
- Forest City Community School District (town): math 67% / reading 78% proficiency, ranked #111 of 289 in IA (top 38%) — strong family-tenant draw, lease renewals of 3-5y typical.
- Market conditions: 2 active listings in the ZIP; 6 units permitted in Winnebago County in 2024 (0 in 5+ unit buildings).
Forward outlook
- In year one you build about $4k of equity ($408 loan paydown + $3k appreciation (5.6% local appreciation)).
- Winnebago County population projected at -10% by 2050 — secular population decline; favor cash flow + early exit over multi-decade hold.
- At projected returns (5.6% appreciation + 3.0% rent growth), your $17k cash investment doubles in ~2 years — after that, you're playing with house money.
- By year 9, paydown + projected appreciation supports a ~$33k cash-out refi (75% LTV) — recoverable capital for the next deal without selling this one.
Negotiation context
- It's been on market 47 days — a 3% lower offer ($57k) is reasonable based on typical stale-listing flexibility.
- Current owner paid $34k; list at $59k implies a 74% gain — meaningful room to come down on a strong offer.
Risks & watch-outs
- Watch-outs: built in 1920 — expect roof / HVAC / electrical / plumbing capex.
Questions for the listing agent
- It's been on market 47 days. Have you received any prior offers? Is the seller open to a 3% concession, seller financing, or rate buy-down credit?
- Built in 1920 — when were the roof, HVAC, electrical panel, plumbing, and water heater last replaced?
- Is there a deadline driving the sale (1031 exchange, divorce, estate, relocation)? That informs how much negotiation room exists.
- Schools are F-rated, which usually means shorter tenancies and higher turnover. Who's the typical renter profile here, and what's been the actual vacancy rate?
- What's the average days-on-market for RENTAL listings here right now (not sales)? A rising rental-DOM trend means longer vacancies and softer asking-rent achievability than the comps imply.
- What's the recent tenant-quality profile in this submarket — average credit score on applications, eviction rate, late-payment / NSF rate, and stable-employment percentage? A property-management company in the area should have these aggregated.
- How much new for-sale + rental construction is in the pipeline within 1–3 miles? Heavy new supply typically softens prices + rents 12–24 months out; constrained supply supports both.
Investment metrics
- 1% rule
- 1.71% ✓
- Cap rate
- 14.27%
- Cash-on-cash
- 28.49%
- DSCR
- 2.27
- GRM
- 4.9
CMA / ARV
- ARV (median comp)
- $116,940
- List price
- $59,000
- Delta
- -49.55%
- Verdict
- UNDERPRICED
- Comps
- 7 within 1.0 mi
Show comp detail 1 sale within ~0.75 mi
| Address | Dist | Beds/Ba | Sqft | Sold | Price | $/sf | Match |
|---|---|---|---|---|---|---|---|
| 212 5th Ave E | 0.17mi | 2/2.5 | 988 (-14%) | 17mo | $75,000 | $76 | 49 |
Match score weights: distance 35% · size 25% · config 20% · recency 20%. Top-matched comps best support the ARV.
Projected returns pro-forma
5.59% appreciation · 3.0% rent growth · sell at horizon
- IRR
- 38.8%
- Equity multiple
- 3.46×
- Total profit
- $40,613
- Equity at exit
- $35,587
- IRR
- 36.4%
- Equity multiple
- 7.07×
- Total profit
- $100,343
- Equity at exit
- $63,276
Cash invested: $16,520 (down + closing). Projections, not guarantees.
Landlord ↔ Tenant lean methodology
- Overall (STATE)
- 83 Strongly Landlord-Friendly
- State Iowa
- 83 Strongly Landlord-Friendly · R+6
- County
- — inherits STATE
- City
- — inherits STATE
ZIP-level market 50453
- Home prices YoY
- 5.5%
- Active inventory
- 2
- Price-to-rent
- 4.9×
Monthly cashflow live
- Estimated rent
- $1,012 medium interval (Pro) →
- Mortgage (P&I)
- −$309
- Tax from tax record
- −$73 /mo · $876/yr
- Insurance
- −$25
- HOA
- −$0
- Vacancy / Maint / Mgmt
- −$212
- Net cashflow
- $392
Break-even live
UW: 25.0% down · 7.5% · 30yr · 1.5% tax · 5.0% vac · 8.0% maint · 8.0% mgmt
Financing live
Cash to close
- Down payment
- $14,750
- Closing costs
- $1,770
- Reserves months
- —
- Total cash needed
- —
Loan-product check · same deal, 3 products live
Conventional
25% down · 7.5% · 30yr
- Down + closing
- —
- Monthly P&I
- —
- Monthly cashflow
- —
- DSCR
- —
- Eligible?
- —
Personal DTI + credit; lowest rate.
DSCR
20% down · 8.5% · 30yr
- Down + closing
- —
- Monthly P&I
- —
- Monthly cashflow
- —
- DSCR
- —
- Eligible?
- —
No personal income docs; deal must DSCR.
Hard money
10% down · 12.0% · 12mo
- Down + closing
- —
- Monthly P&I
- —
- Monthly cashflow
- —
- DSCR
- —
- Eligible?
- —
Short-term bridge; refi at stabilization.
Listing history 18 events
-
2026-06-18days on market $59,000 Active 47 DOM
-
2026-06-17days on market $59,000 Active 46 DOM
-
2026-06-16days on market $59,000 Active 45 DOM
-
2026-06-15days on market $59,000 Active 44 DOM
-
2026-06-13days on market $59,000 Active 42 DOM
-
2026-06-12days on market $59,000 Active 41 DOM
-
2026-06-09days on market $59,000 Active 38 DOM
-
2026-06-08days on market $59,000 Active 37 DOM
-
2026-06-07days on market $59,000 Active 36 DOM
-
2026-06-07days on market $59,000 Active 35 DOM
-
2026-06-04days on market $59,000 Active 32 DOM
-
2026-06-02days on market $59,000 Active 31 DOM
-
2026-06-01days on market $59,000 Active 30 DOM
-
2026-05-31days on market $59,000 Active 29 DOM
-
2026-05-31days on market $59,000 Active 28 DOM
-
2026-05-06price $59,000 948-char remark
-
2026-05-02$68,000 Active 948-char remark
-
2006-06-23soldstatus $34,000
ⓘ Source: listings_history table (triggers on properties + properties_extension) + one-shot
backfill from property_details.listing_events for pre-trigger history.
Tax reassessment forecast IA · Partial reset (capped growth)
- Current annual tax
- $876 · $73/mo
- Projected year-2 tax
- $901 · $75/mo
- Expected delta
- +$25/yr (+$2/mo · 2.9%)
ⓘ Screening estimate from a state-policy table — verify with the county assessor before closing.
Climate risk First Street
- Flood 1/10 Low FEMA zone X (unshaded) · 0% chance over 30 yrs
- Wildfire 4/10 Moderate
- Heat 2/10 Low 7 d/yr ≥99°F today · 16 d/yr by 30 yrs out
- Wind 2/10 Low
- Air quality 1/10 Low 0 unhealthy d/yr today · 0 by 30 yrs out
Nearby sold comps map
Loading sold comps map…
Walkable amenities ~0.75 mi
Loading nearby amenities…
Taxation est. · year 1
- Rental income
- $12,139
- − Mortgage interest
- −$3,305
- − Property taxes
- −$876
- − Insurance
- −$295
- − Repairs & maintenance
- −$971
- − Management
- −$971
- − Depreciation
- −$1,716
- Taxable income
- $4,004
- Est. tax owed @ 24.0%
- −$961
- After-tax cash flow
- $3,745/yr
For passive investors: Depreciation is non-cash, so a rental often shows a tax loss while cash-flowing — sheltering income. Rental losses are passive: they offset passive income freely, and up to $25,000/yr can offset ordinary (W-2) income if you actively participate and your MAGI is under $100k (phasing out to $0 by $150k); unused losses carry forward. On sale, claimed depreciation is recaptured at up to 25%, and gains may owe capital-gains tax (a 1031 exchange can defer both). Figures are a year-1 estimate at your 24.0% rate — not tax advice; consult a CPA.
Schools (NCES district)
- District
- Forest City Community School District
- NCES district ID
- 1911790
- Math proficiency
- 67% ▼ -10.00%
- Reading proficiency
- 78% ▲ 1.00%
- Median HH income
- $46,674
- Composite
- 61.08/100
- National rank
- #789
- State rank
- #111 of 289 in IA
Livability — Leland
- Score
- 63/100
- State rank
- #669
- US rank
- #15560
Category grades
Schools grade is shown separately in the Schools card above.
Census & demographics
- Census place
- Leland, IA
- Population (ZIP)
- 520
Population outlook (Winnebago County) Hauer SSP2
- Today (2025)
- 10,099 people
- By 2030
- 9,831 · -2.7%
- By 2040
- 9,326 · -7.7%
- By 2050
- 9,073 · -10.2%
- By 2075
- 9,448 · -6.4%
- By 2100
- 10,279 · +1.8%
Race, ethnicity, and origin ACS 2023
- Neighborhood character
- Predominantly White (91%)
- Race & ethnicity
- White 91% Two or more races 6% Hispanic / Latino 4%
- Common ancestry
- Portuguese 54% Iranian 1% Lithuanian 1%
- Foreign-born
- 0%
- Languages at home
- 97% English-only · Spanish 1% German/W. Germanic 1%
Political lean MEDSL · Winnebago
- 2024 margin
- Solid R (+30.7) · D 33.9% · R 64.6% · Other 1.5%
- 2008→2024 swing
- -39.3pp toward R · 2008: 8.6pp · 2024: -30.7pp
- All cycles
- 2024: R+30.7 2020: R+26.3 2016: R+26.5 2012: R+0.0 2008: D+8.6
Not yet ingested
- Civics
- —
Market trends
- HPI YoY
- ▲ 5.59%
- Current HPI
- 106.5045
- Rent YoY
- —
- Metro
- —
- State GDP YoY
- ▲ 2.48%
- F500 in state
- 4
Industry mix (Fortune 500 HQ in IA)
| Industry | F500 HQs | Revenue |
|---|---|---|
| Financial Services | 1 | $16B |
|
||
| Retail / Convenience | 1 | $15B |
|
||
Price history
+73.5% since first listed3 events — show timeline
- 2026-05-06 Price Changed $59,000 IAR
- 2026-05-02 Listed $68,000 IAR
- 2006-06-23 Sold (Public Records) $34,000 Public Records
Property tax history
+4.0%/yrLatest (2025): $876 · +5.8% YoY. Source: county tax records.
Cash-flow waterfall
monthlySold comps — $/sqft
last 12 mo · ≤1 miLoading sold comps…