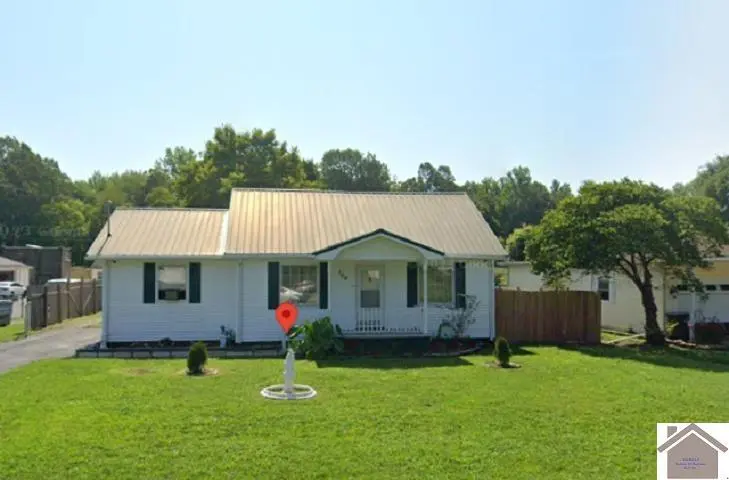
709 Milliken Rd · Farley, KY
Flood risk 1/10 · Minimal
- FEMA flood zone
- X
- Chance of flooding over 30 yrs
- 0.0%
- Est. flood insurance / yr
- $507 – $1,088
Fire risk 3/10 · Minor
- Est. fire insurance / yr
- $839 – $1,559
Heat risk 6/10 · Moderate
- Hot days now (above 108°F)
- 7 days/yr
- Hot days in 30 yrs
- 20 days/yr
Wind risk 3/10 · Minor
- Chance of severe wind over 30 yrs
- 6.0%
Air-quality risk 2/10 · Minimal
- Unhealthy air days now
- 1 days/yr
- Unhealthy air days in 30 yrs
- 2 days/yr
Risk factors via First Street. Map © Google.
Why this score? — see what drove the B grade
The composite is a weighted blend of 9 inputs, each scored 0–100. Each bar is that input's sub-score; the figure is the points it added to the 100-point composite (weight × sub-score).
- Cash flow +28.6/30.0
- ARV discount +15.0/15.0
- DSCR +10.0/10.0
- 1% rule +7.6/10.0
- Schools +4.0/10.0
- Livability +3.1/5.0
- Rent growth +2.5/5.0
- Condition / age +2.5/5.0
- Appreciation +0.0/10.0
$98,000
🖨 Deal sheet 📄 Offer letter ✓ Due diligence
Listing remarks MLS
Property is being sold "As Is". The possibilities are endless! Privacy fenced around the backyard, covered porch, little storage rooms off porch and garage. This home needs a little TLC.
Key facts
- Covered porch
- Storage rooms
- Privacy fenced
Tags
Neighborhood map
What this means for you Summary
Snapshot
- This is a 3-bed/1.5-bath single-family listed at $98k.
Deal economics
- At list price, monthly cash flow is $322 ($4k/yr) — positive.
- The deal already cash-flows at list — no discount required.
- Meets the 1% rule at list price ($1k rent vs $98k).
- Recommended offer: $86k (12.0% below list) — sets the bar for market timing.
Location & tenants
- Location reads 62/100 on livability (#359 in KY) — a middle-class / working-renter tenant base. Strengths: cost of living A+, crime A-, housing A-; Watch: employment D, schools F, amenities F.
- Mccracken County (town): math 41% / reading 52% proficiency, ranked #16 of 165 in KY (top 10%) — families likely to look elsewhere, expect single-tenant / working-renter base with shorter leases.
- Market conditions: 268 active listings in the ZIP; 187 units permitted in McCracken County in 2024 (104 in 5+ unit buildings).
Forward outlook
- Local home prices are declining (-3.0%/yr); year-one equity from $678 of loan paydown is wiped out by about $3k of value loss. Plan a longer hold.
- McCracken County population projected to shrink 9% by 2050 — rents likely to lag national; underwrite the cash flow, not the appreciation.
- At projected returns (-3.0% appreciation + 3.0% rent growth), your $27k cash investment doubles in ~9 years — after that, you're playing with house money.
Negotiation context
- It's been on market 310 days — a 12% lower offer ($86k) is reasonable based on typical stale-listing flexibility.
- 3 sale attempts since 7y ago; this cycle's ask has dropped $22k (18%) from the opening price — seller is motivated, your offer sets the floor, not the list.
- Current owner paid $74k; 32% above their basis — modest negotiation headroom, anchor on the comps not their cost.
Risks & watch-outs
- Watch-outs: built in 1946 — expect roof / HVAC / electrical / plumbing capex.
- Climate carrying-cost: extreme-heat days projected 7→20/yr by 2055 (HVAC capex compounding) — expect insurance premiums to compound above CPI over the hold.
Questions for the listing agent
- It's been on market 310 days. Have you received any prior offers? Is the seller open to a 12% concession, seller financing, or rate buy-down credit?
- Built in 1946 — when were the roof, HVAC, electrical panel, plumbing, and water heater last replaced?
- Why hasn't it sold? Are there any deal-killer items the seller is aware of (foundation, flood, title, zoning, code violations)?
- Is there a deadline driving the sale (1031 exchange, divorce, estate, relocation)? That informs how much negotiation room exists.
- Schools are F-rated, which usually means shorter tenancies and higher turnover. Who's the typical renter profile here, and what's been the actual vacancy rate?
- What's the average days-on-market for RENTAL listings here right now (not sales)? A rising rental-DOM trend means longer vacancies and softer asking-rent achievability than the comps imply.
- What's the recent tenant-quality profile in this submarket — average credit score on applications, eviction rate, late-payment / NSF rate, and stable-employment percentage? A property-management company in the area should have these aggregated.
- How much new for-sale + rental construction is in the pipeline within 1–3 miles? Heavy new supply typically softens prices + rents 12–24 months out; constrained supply supports both.
Investment metrics
- 1% rule
- 1.26% ✓
- Cap rate
- 10.24%
- Cash-on-cash
- 14.09%
- DSCR
- 1.63
- GRM
- 6.6
CMA / ARV
- ARV (median comp)
- $156,559
- List price
- $98,000
- Delta
- -37.40%
- Verdict
- UNDERPRICED
- Comps
- 20 within 1.0 mi
Show comp detail 12 sales within ~0.75 mi
| Address | Dist | Beds/Ba | Sqft | Sold | Price | $/sf | Match |
|---|---|---|---|---|---|---|---|
| 517 Milliken Rd | 0.25mi | 3/2.0 | 1,647 (+6%) | 10mo | $59,000 | $36 | 68 |
| 813 Oaks Rd | 0.13mi | 3/1.0 | 1,340 (-14%) | 10mo | $28,000 | $21 | 61 |
| 1725 Evelyn Dr | 0.65mi | 3/1.5 | 1,537 (-1%) | 10mo | $180,000 | $117 | 60 |
| 3024 Ramage Dr | 0.53mi | 3/2.0 | 1,423 (-8%) | 2mo | $179,900 | $126 | 58 |
| 300 Valley St | 0.54mi | 3/1.5 | 1,369 (-12%) | 1mo | $154,000 | $112 | 55 |
| 3520 Benton Rd | 0.65mi | 3/1.5 | 1,444 (-7%) | 6mo | $184,825 | $128 | 53 |
| 1507 Meacham Ln | 0.65mi | 3/2.0 | 1,470 (-5%) | 9mo | $105,000 | $71 | 52 |
| 1701 Meacham Ln | 0.59mi | 3/2.0 | 1,398 (-10%) | 5mo | $127,325 | $91 | 50 |
| 3311 Alpha Dr | 0.69mi | 3/1.5 | 1,651 (+6%) | 9mo | $224,500 | $136 | 50 |
| 1900 Debby Dr | 0.73mi | 3/2.0 | 1,734 (+12%) | 4mo | $293,500 | $169 | 41 |
| 1820 Debby Dr | 0.72mi | 3/2.0 | 1,779 (+15%) | 1mo | $300,000 | $169 | 40 |
| 1915 Evelyn Dr | 0.70mi | 3/2.0 | 1,738 (+12%) | 10mo | $289,000 | $166 | 38 |
Match score weights: distance 35% · size 25% · config 20% · recency 20%. Top-matched comps best support the ARV.
Projected returns pro-forma
-3.0% appreciation · 3.0% rent growth · sell at horizon
- IRR
- 4.4%
- Equity multiple
- 1.17×
- Total profit
- $4,637
- Equity at exit
- $14,612
- IRR
- 13.9%
- Equity multiple
- 2.11×
- Total profit
- $30,466
- Equity at exit
- $8,473
Cash invested: $27,440 (down + closing). Projections, not guarantees.
Landlord ↔ Tenant lean methodology
- Overall (STATE)
- 83 Strongly Landlord-Friendly
- State Kentucky
- 83 Strongly Landlord-Friendly · R+16
- County
- — inherits STATE
- City
- — inherits STATE
ZIP-level market 42003
- Home prices YoY
- -19.8%
- Active inventory
- 268
- Price-to-rent
- 6.6×
Monthly cashflow live
- Estimated rent
- $1,233 medium interval (Pro) →
- Mortgage (P&I)
- −$514
- Tax from tax record
- −$97 /mo · $1,169/yr
- Insurance
- −$41
- HOA
- −$0
- Vacancy / Maint / Mgmt
- −$259
- Net cashflow
- $322
Break-even live
UW: 25.0% down · 7.5% · 30yr · 1.5% tax · 5.0% vac · 8.0% maint · 8.0% mgmt
Financing live
Cash to close
- Down payment
- $24,500
- Closing costs
- $2,940
- Reserves months
- —
- Total cash needed
- —
Loan-product check · same deal, 3 products live
Conventional
25% down · 7.5% · 30yr
- Down + closing
- —
- Monthly P&I
- —
- Monthly cashflow
- —
- DSCR
- —
- Eligible?
- —
Personal DTI + credit; lowest rate.
DSCR
20% down · 8.5% · 30yr
- Down + closing
- —
- Monthly P&I
- —
- Monthly cashflow
- —
- DSCR
- —
- Eligible?
- —
No personal income docs; deal must DSCR.
Hard money
10% down · 12.0% · 12mo
- Down + closing
- —
- Monthly P&I
- —
- Monthly cashflow
- —
- DSCR
- —
- Eligible?
- —
Short-term bridge; refi at stabilization.
Listing history 22 events
-
2026-06-16days on market $98,000 Active 310 DOM
-
2026-06-15days on market $98,000 Active 309 DOM
-
2026-06-14days on market $98,000 Active 307 DOM
-
2026-06-12days on market $98,000 Active 306 DOM
-
2026-06-09days on market $98,000 Active 303 DOM
-
2026-06-08days on market $98,000 Active 302 DOM
-
2026-06-07days on market $98,000 Active 301 DOM
-
2026-06-05days on market $98,000 Active 298 DOM
-
2026-06-03days on market $98,000 Active 297 DOM
-
2026-06-02days on market $98,000 Active 296 DOM
-
2026-06-01days on market $98,000 Active 295 DOM
-
2026-05-31days on market $98,000 Active 294 DOM
-
2026-05-30days on market $98,000 Active 293 DOM
-
2025-12-16status Active 197-char remark
Show marketing remark (197 chars)
Property is being sold "As Is". The possibilities are endless! Privacy fenced around the backyard, covered porch, little storage rooms off porch and garage. This home needs a little TLC.
-
2025-11-21price $98,000 197-char remark
Show marketing remark (197 chars)
Property is being sold "As Is". The possibilities are endless! Privacy fenced around the backyard, covered porch, little storage rooms off porch and garage. This home needs a little TLC.
-
2025-08-08$120,000 Active 197-char remark
Show marketing remark (197 chars)
Property is being sold "As Is". The possibilities are endless! Privacy fenced around the backyard, covered porch, little storage rooms off porch and garage. This home needs a little TLC.
-
2019-12-19soldstatus $74,000
-
2019-12-18soldstatus $74,000 740-char remark
Show marketing remark (740 chars)
PENDING CONTRACT ! CLOSING DEC 1, 2019 3 BEDROOM home on large lot with detached garage close to all conveniences ! Less than one mile to Super Walmart, Kroger Grocery, Lowe's & Great Restaurants ! Less than 2 miles to down town Paducah and I-24 ! Handicap accessible, large kitchen, all appliances stay plus washer and dryer. Formal dining room, Living room & beautiful laminate flooring ! Huge family room , covered back porch , extra room for storage. VERY LARGE Awesome back yard, beautiful trees, privacy fence on both sides & large detached garage ! SOLD AS IS . Everything stays that is on property now. Bring your fish, hamsters, dogs, cats, and Love to this Home ! PENDING CONTRACT ! CLOSING IS DEC 1, 2019
-
2019-08-27$75,500 740-char remark
Show marketing remark (740 chars)
PENDING CONTRACT ! CLOSING DEC 1, 2019 3 BEDROOM home on large lot with detached garage close to all conveniences ! Less than one mile to Super Walmart, Kroger Grocery, Lowe's & Great Restaurants ! Less than 2 miles to down town Paducah and I-24 ! Handicap accessible, large kitchen, all appliances stay plus washer and dryer. Formal dining room, Living room & beautiful laminate flooring ! Huge family room , covered back porch , extra room for storage. VERY LARGE Awesome back yard, beautiful trees, privacy fence on both sides & large detached garage ! SOLD AS IS . Everything stays that is on property now. Bring your fish, hamsters, dogs, cats, and Love to this Home ! PENDING CONTRACT ! CLOSING IS DEC 1, 2019
-
2011-07-08soldstatus $74,500
-
2010-12-12soldstatus $50,000
-
1993-06-01soldstatus $48,000
ⓘ Source: listings_history table (triggers on properties + properties_extension) + one-shot
backfill from property_details.listing_events for pre-trigger history.
Tax reassessment forecast KY · Resets to sale price
- Current annual tax
- $1,169 · $97/mo
- Projected year-2 tax
- $1,169 · $97/mo
- Expected delta
- $0/yr ($0/mo · 0.0%)
ⓘ Screening estimate from a state-policy table — verify with the county assessor before closing.
Climate risk First Street
- Flood 1/10 Low FEMA zone X · 0% chance over 30 yrs
- Wildfire 3/10 Moderate
- Heat 6/10 Major 7 d/yr ≥108°F today · 20 d/yr by 30 yrs out
- Wind 3/10 Moderate 6% chance of damaging wind over 30 yrs
- Air quality 2/10 Low 1 unhealthy d/yr today · 2 by 30 yrs out
Nearby sold comps map
Loading sold comps map…
Walkable amenities ~0.75 mi
Loading nearby amenities…
Taxation est. · year 1
- Rental income
- $14,799
- − Mortgage interest
- −$5,490
- − Property taxes
- −$1,169
- − Insurance
- −$490
- − Repairs & maintenance
- −$1,184
- − Management
- −$1,184
- − Depreciation
- −$2,851
- Taxable income
- $2,432
- Est. tax owed @ 24.0%
- −$584
- After-tax cash flow
- $3,281/yr
For passive investors: Depreciation is non-cash, so a rental often shows a tax loss while cash-flowing — sheltering income. Rental losses are passive: they offset passive income freely, and up to $25,000/yr can offset ordinary (W-2) income if you actively participate and your MAGI is under $100k (phasing out to $0 by $150k); unused losses carry forward. On sale, claimed depreciation is recaptured at up to 25%, and gains may owe capital-gains tax (a 1031 exchange can defer both). Figures are a year-1 estimate at your 24.0% rate — not tax advice; consult a CPA.
Schools (NCES district)
- District
- Mccracken County
- NCES district ID
- 2103960
- Math proficiency
- 41% ▼ -15.00%
- Reading proficiency
- 52% ▼ -15.00%
- Median HH income
- $49,976
- Composite
- 39.84/100
- National rank
- #3871
- State rank
- #16 of 165 in KY
Livability — Farley
- Score
- 62/100
- State rank
- #359
- US rank
- #17178
Category grades
Schools grade is shown separately in the Schools card above.
Census & demographics
- Census place
- Farley, KY
- Population (ZIP)
- 29,384
Population outlook (McCracken County) Hauer SSP2
- Today (2025)
- 64,237 people
- By 2030
- 63,468 · -1.2%
- By 2040
- 61,221 · -4.7%
- By 2050
- 58,432 · -9.0%
- By 2075
- 52,668 · -18.0%
- By 2100
- 44,517 · -30.7%
Race, ethnicity, and origin ACS 2023
- Neighborhood character
- Predominantly White (83%)
- Race & ethnicity
- White 83% Black 9% Two or more races 5% Hispanic / Latino 4%
- Common ancestry
- Slovak 2% Lithuanian 1% Serbian 1%
- Foreign-born
- 2% · Canada
- Languages at home
- 97% English-only · Spanish 1% Other Asian/Pacific 1%
Political lean MEDSL · McCracken
- 2024 margin
- Solid R (+34.9) · D 31.9% · R 66.8% · Other 1.2%
- 2008→2024 swing
- -9.7pp toward R · 2008: -25.2pp · 2024: -34.9pp
- All cycles
- 2024: R+34.9 2020: R+31.7 2016: R+37.2 2012: R+32.5 2008: R+25.2
Not yet ingested
- Civics
- —
Market trends
- HPI YoY
- ▼ -58.31%
- Current HPI
- 236.3013
- Rent YoY
- —
- Metro
- —
- State GDP YoY
- ▲ 1.81%
- F500 in state
- 4
Industry mix (Fortune 500 HQ in KY)
| Industry | F500 HQs | Revenue |
|---|---|---|
| Healthcare | 1 | $118B |
|
||
| Food / Beverage | 1 | $7B |
|
||
Price history
+104.2% since first listed9 events — show timeline
- 2025-12-16 Relisted — WKRMLS
- 2025-11-21 Price Changed $98,000 WKRMLS
- 2025-08-08 Listed $120,000 WKRMLS
- 2019-12-19 Sold (Public Records) $74,000 Public Records
- 2019-12-18 Sold (MLS) $74,000 WKRMLS
- 2019-08-27 Listed $75,500 WKRMLS
- 2011-07-08 Sold (Public Records) $74,500 Public Records
- 2010-12-12 Sold (Public Records) $50,000 Public Records
- 1993-06-01 Sold (Public Records) $48,000 Public Records
Property tax history
+6.5%/yrLatest (2025): $1,169 · -1.8% YoY. Source: county tax records.
Cash-flow waterfall
monthlySold comps — $/sqft
last 12 mo · ≤1 miLoading sold comps…