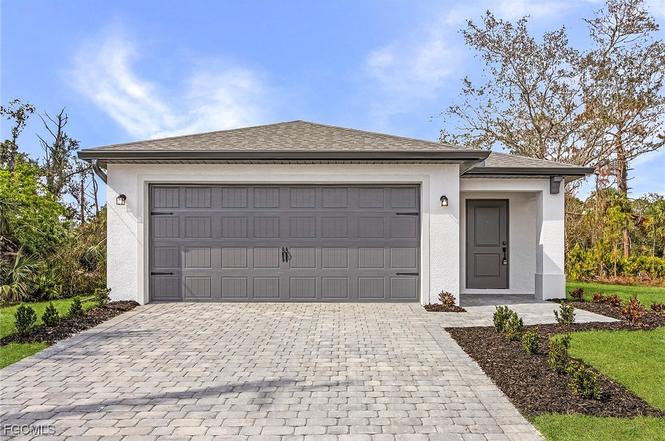
804 Gen D Macarthur Ave · Fort Denaud, FL
Flood risk 1/10 · Minimal
- FEMA flood zone
- X (unshaded)
- Chance of flooding over 30 yrs
- 0.0%
- Est. flood insurance / yr
- $507 – $1,088
Fire risk 6/10 · Moderate
- Est. fire insurance / yr
- $947 – $1,759
Heat risk 9/10 · Severe
- Hot days now (above 109°F)
- 7 days/yr
- Hot days in 30 yrs
- 25 days/yr
Wind risk 10/10 · Severe
- Chance of severe wind over 30 yrs
- 99.0%
Air-quality risk 2/10 · Minimal
- Unhealthy air days now
- 1 days/yr
- Unhealthy air days in 30 yrs
- 2 days/yr
Risk factors via First Street. Map © Google.
Why this score? — see what drove the D- grade
The composite is a weighted blend of 9 inputs, each scored 0–100. Each bar is that input's sub-score; the figure is the points it added to the 100-point composite (weight × sub-score).
- Appreciation +10.0/10.0
- ARV discount +7.5/15.0
- Cash flow +5.9/30.0
- Livability +3.2/5.0
- Schools +3.1/10.0
- Rent growth +2.5/5.0
- Condition / age +2.5/5.0
- 1% rule +1.8/10.0
- DSCR +0.3/10.0
$339,900
🖨 Deal sheet (PDF) 📄 Offer letter ✓ Due diligence
Listing remarks
PRICE REDUCED!! MOVE IN READY!! The Captiva is a beautifully designed 3-bedroom, 2-bathroom home, offering the perfect balance of style and functionality. The open concept living area is ideal for entertaining, while the spacious master suite with a walk-in closet provides a peaceful retreat. Two additional bedrooms present plenty of space for family or guests. Enjoy the Florida sunshine on the inviting back patio, perfect for relaxation and gatherings. This home is an exceptional choice for creating lasting memories with your loved ones. Property ID: 1-28-43-12-100-0002.0010
Key facts
- Walk-in closet
- Back patio
- 0.3 acre lot
Tags
Property features AI
Finance
- Financial info: Pets allowed
- HOA & community: Homeowners association with monthly fee ($150); Community amenities: playground, park, management; Non-gated community
Exterior
- Parking: Attached 2-car garage; Driveway; Paved parking; Garage door opener; Covered parking for 2 vehicles
- Security: Smoke detector(s); Security/high impact doors
- Utilities: Well water; Septic tank; Cable available
- Home design: Single-story; Entry at ground level; Faces east
- Construction: Block, concrete and stucco construction; Shingle roof
- Exterior features: Patio; Security/high impact doors; Smoke detectors; Rectangular lot; West exposure; Has view; Waterfront
Interior
- Kitchen: Dishwasher; Disposal; Icemaker; Microwave; Range; Refrigerator (with ice maker); Kitchen island; Breakfast bar; Pantry
- Bedrooms: Master bedroom (main level); Additional bedrooms (main level)
- Flooring: Carpet; Tile
- Bathrooms: 2 full bathrooms
- Heating & cooling: Central heating (electric, heat pump); Central air conditioning (electric)
- Interior features: Impact glass windows; Breakfast bar; Family/Dining room; Kitchen island; Combined living/dining room; Main level primary bedroom; Pantry; Tub/shower; Walk-in closets; Unfurnished
- Laundry & utility: Washer hookup; Dryer hookup; Utility room
Neighborhood map
What this means for you Summary
Snapshot
- This is a 3-bed/2.0-bath land listed at $340k.
Deal economics
- At list price, monthly cash flow is $-666 ($-8k/yr) — negative.
- To cash-flow at today's rent, offer at most $244k (28.4% below list).
- To meet the 1% rule (rent ≥ 1% of price), the offer needs to be $232k (31.7% below list).
- Recommended offer: $232k (31.7% below list) — sets the bar for 1% rule.
- Cap rate 3.9% vs local median 3.0% in Fort Denaud — meaningfully above typical; check what's discounted (condition, days-on-market, listing class) to confirm the premium yield is real.
Location & tenants
- Location reads 65/100 on livability (#635 in FL) — a middle-class / working-renter tenant base. Strengths: crime A+, cost of living A+, housing A+; Watch: schools F, amenities F, commute F.
- Hendry (town): math 35% / reading 40% proficiency, ranked #65 of 73 in FL (top 89%) — families likely to look elsewhere, expect single-tenant / working-renter base with shorter leases; 75% free/reduced lunch — lower-income household profile, screen leases tightly.
- Market conditions: 942 active listings in the ZIP; 2 comparable units currently listed for rent nearby; 557 units permitted in Hendry County in 2024 (45 in 5+ unit buildings).
- At $2,320/mo this rent would consume 49% of the median local household income ($57k/yr) (locally 498% of renters already pay >50% of income on rent) — very limited rent-growth headroom before tenants either downsize or default.
Forward outlook
- In year one you build about $36k of equity ($2k loan paydown + $34k appreciation (10.0% local appreciation)).
- Hendry County population projected to shrink 7% by 2050 — rents likely to lag national; underwrite the cash flow, not the appreciation.
- By year 2, paydown + projected appreciation supports a ~$58k cash-out refi (75% LTV) — recoverable capital for the next deal without selling this one.
Negotiation context
- It's been on market 252 days — a 12% lower offer ($299k) is reasonable based on typical stale-listing flexibility.
- 2 sale attempts with the ask held roughly flat each time — persistent listings suggest the price (not the market) is what's stuck; bring a comps-based counter.
Risks & watch-outs
- Climate carrying-cost: severe wind risk, 99% chance of damaging wind over 30y; major wildfire risk; extreme-heat days projected 7→25/yr by 2055 (HVAC capex compounding) — expect insurance premiums to compound above CPI over the hold.
Questions for the listing agent
- What do current leases actually rent for vs. the listed asking? Can we see a recent rent roll and the last 12 months of T-12 income?
- It's been on market 252 days. Have you received any prior offers? Is the seller open to a 32% concession, seller financing, or rate buy-down credit?
- What does the HOA fee cover, when was the last increase, and are there any pending special assessments or reserve-fund shortfalls?
- Why hasn't it sold? Are there any deal-killer items the seller is aware of (foundation, flood, title, zoning, code violations)?
- Is there a deadline driving the sale (1031 exchange, divorce, estate, relocation)? That informs how much negotiation room exists.
- Schools are F-rated, which usually means shorter tenancies and higher turnover. Who's the typical renter profile here, and what's been the actual vacancy rate?
- The area grade is low — what's the realistic commute time and amenity access for the typical tenant pool here? Any planned neighborhood developments (good or bad) we should know about?
- What's the average days-on-market for RENTAL listings here right now (not sales)? A rising rental-DOM trend means longer vacancies and softer asking-rent achievability than the comps imply.
- What's the recent tenant-quality profile in this submarket — average credit score on applications, eviction rate, late-payment / NSF rate, and stable-employment percentage? A property-management company in the area should have these aggregated.
- How much new for-sale + rental construction is in the pipeline within 1–3 miles? Heavy new supply typically softens prices + rents 12–24 months out; constrained supply supports both.
Investment metrics
- 1% rule
- 0.68% ✗
- Cap rate
- 3.94%
- Cash-on-cash
- -8.40%
- DSCR
- 0.63
- GRM
- 12.2
CMA / ARV
No comps found within radius.
Projected returns pro-forma
10.0% appreciation · 3.0% rent growth · sell at horizon
- IRR
- 18.4%
- Equity multiple
- 2.50×
- Total profit
- $142,828
- Equity at exit
- $306,209
- IRR
- 17.1%
- Equity multiple
- 5.77×
- Total profit
- $454,216
- Equity at exit
- $660,351
Cash invested: $95,172 (down + closing). Projections, not guarantees.
Landlord ↔ Tenant lean methodology
- Overall (STATE)
- 87 Strongly Landlord-Friendly
- State Florida
- 87 Strongly Landlord-Friendly · R+3
- County
- — inherits STATE
- City
- — inherits STATE
ZIP-level market 33935
- Home prices YoY
- 16.3%
- Active inventory
- 942
- Price-to-rent
- 12.2×
Monthly cashflow live
- Estimated rent
- $2,320 medium interval (Pro) →
- Mortgage (P&I)
- −$1,782
- Tax est. 1.5%
- −$425 /mo · $5,098/yr
- Insurance
- −$142
- HOA
- −$150
- Vacancy / Maint / Mgmt
- −$487
- Net cashflow
- $-666
Break-even live
Sensitivity live
| Price | -10% $-431 | -5% $-549 | +0% $-666 | +5% $-783 | +10% $-901 |
|---|---|---|---|---|---|
| Rent | -10% $-849 | -5% $-758 | +0% $-666 | +5% $-574 | +10% $-483 |
| Rate | -1.0pp $-495 | -0.5pp $-580 | base $-666 | +0.5pp $-754 | +1.0pp $-844 |
UW: 25.0% down · 7.5% · 30yr · 1.5% tax · 5.0% vac · 8.0% maint · 8.0% mgmt
Financing live
Cash to close
- Down payment
- $84,975
- Closing costs
- $10,197
- Reserves months
- —
- Total cash needed
- —
Loan-product check · same deal, 3 products live
Conventional
25% down · 7.5% · 30yr
- Down + closing
- —
- Monthly P&I
- —
- Monthly cashflow
- —
- DSCR
- —
- Eligible?
- —
Personal DTI + credit; lowest rate.
DSCR
20% down · 8.5% · 30yr
- Down + closing
- —
- Monthly P&I
- —
- Monthly cashflow
- —
- DSCR
- —
- Eligible?
- —
No personal income docs; deal must DSCR.
Hard money
10% down · 12.0% · 12mo
- Down + closing
- —
- Monthly P&I
- —
- Monthly cashflow
- —
- DSCR
- —
- Eligible?
- —
Short-term bridge; refi at stabilization.
Rent comps 2 comps
| Address | Beds | Baths | Sqft | Rent | $/sqft | DOM | Units | Dist |
|---|---|---|---|---|---|---|---|---|
| 985 Quail Run Fort Denaud, FL | 2.0 | 2.0 | 1748 | $2,000 | $1.14 | 25d | 1 | 0.24mi |
| 1024 Caloosa Breeze Dr Labelle, FL | 4.0 | 2.0 | 1480 | $2,100 | $1.42 | 25d | 1 | 1.43mi |
HOA detail
- Monthly dues
- $150 · $1,800/yr
Listing history 19 events
-
2026-06-18days on market $339,900 Active 252 DOM
-
2026-06-17days on market $339,900 Active 251 DOM
-
2026-06-16days on market $339,900 Active 250 DOM
-
2026-06-15days on market $339,900 Active 249 DOM
-
2026-06-13days on market $339,900 Active 247 DOM
-
2026-06-13days on market $339,900 Active 246 DOM
-
2026-06-10days on market $339,900 Active 244 DOM
-
2026-06-09days on market $339,900 Active 243 DOM
-
2026-06-08days on market $339,900 Active 242 DOM
-
2026-06-07remarks 583-char remark
-
2026-06-07pricedays on market $339,900 Active 241 DOM
-
2026-06-03days on market $356,900 Active 237 DOM
-
2026-06-02days on market $356,900 Active 236 DOM
-
2026-06-01days on market $356,900 Active 235 DOM
-
2026-05-31days on market $356,900 Active 234 DOM
-
2025-10-09$356,900 Active
-
2025-09-24historical
-
2025-09-04price $352,900
-
2025-07-03$356,900 Active
ⓘ Source: listings_history table (triggers on properties + properties_extension) + one-shot
backfill from property_details.listing_events for pre-trigger history.
Climate risk First Street
- Flood 1/10 Low FEMA zone X (unshaded) · 0% chance over 30 yrs
- Wildfire 6/10 Major
- Heat 9/10 Extreme 7 d/yr ≥109°F today · 25 d/yr by 30 yrs out
- Wind 10/10 Extreme 99% chance of damaging wind over 30 yrs
- Air quality 2/10 Low 1 unhealthy d/yr today · 2 by 30 yrs out
Nearby sold comps map
Loading sold comps map…
Walkable amenities ~0.75 mi
Loading nearby amenities…
Taxation est. · year 1
- Rental income
- $27,843
- − Mortgage interest
- −$19,040
- − Property taxes
- −$5,098
- − Insurance
- −$1,700
- − Repairs & maintenance
- −$2,227
- − Management
- −$2,227
- − HOA
- −$1,800
- − Depreciation
- −$9,888
- Taxable loss
- −$14,138
- Est. tax savings @ 24.0%
- +$3,393
- After-tax cash flow
- $-4,599/yr
For passive investors: Depreciation is non-cash, so a rental often shows a tax loss while cash-flowing — sheltering income. Rental losses are passive: they offset passive income freely, and up to $25,000/yr can offset ordinary (W-2) income if you actively participate and your MAGI is under $100k (phasing out to $0 by $150k); unused losses carry forward. On sale, claimed depreciation is recaptured at up to 25%, and gains may owe capital-gains tax (a 1031 exchange can defer both). Figures are a year-1 estimate at your 24.0% rate — not tax advice; consult a CPA.
Schools (NCES district)
- District
- Hendry
- NCES district ID
- 1200780
- Math proficiency
- 35% ▼ -11.00%
- Reading proficiency
- 40% ▼ -4.00%
- Median HH income
- $37,043
- Composite
- 31.16/100
- National rank
- #6054
- State rank
- #65 of 73 in FL
Livability — Fort Denaud
- Score
- 65/100
- State rank
- #635
- US rank
- #12451
Category grades
Schools grade is shown separately in the Schools card above.
Census & demographics
- Census place
- Fort Denaud, FL
- County
- Hendry County · 23,186 people
- Metro
- Clewiston, FL
- Population (ZIP)
- 23,186
- Household income
- $57,009
- Rent vs Own
- Severe rent burden
- 498.0
Population outlook (Hendry County) Hauer SSP2
- Today (2025)
- 38,866 people
- By 2030
- 38,558 · -0.8%
- By 2040
- 37,743 · -2.9%
- By 2050
- 36,117 · -7.1%
- By 2075
- 30,070 · -22.6%
- By 2100
- 21,966 · -43.5%
Race, ethnicity, and origin ACS 2023
- Neighborhood character
- Majority Hispanic (56%)
- Race & ethnicity
- Hispanic / Latino 56% White 39% Two or more races 21% Black 2% Native American 2%
- Hispanic origin (detail)
- Mexican 40% Puerto Rican 3% Cuban 5%
- Common ancestry
- Lithuanian 2% Serbian 2% Slovak 1%
- Foreign-born
- 27% · Canada, Jamaica
- Languages at home
- 50% English-only · Spanish 50%
Political lean MEDSL · Hendry
- 2024 margin
- Solid R (+38.3) · D 30.4% · R 68.7%
- 2008→2024 swing
- -31.1pp toward R · 2008: -7.2pp · 2024: -38.3pp
- All cycles
- 2024: R+38.3 2020: R+23.0 2016: R+14.2 2012: R+5.9 2008: R+7.2
Not yet ingested
- Civics
- —
Market trends
- HPI YoY
- ▲ 75.20%
- Current HPI
- 537.4928
- Rent YoY
- —
- Metro
- Clewiston, FL
- State GDP YoY
- ▲ 3.28%
- F500 in state
- 36
Industry mix (Fortune 500 HQ in FL)
| Industry | F500 HQs | Revenue |
|---|---|---|
| Industrial Technology | 2 | $29B |
|
||
| Insurance | 2 | $17B |
|
||
| Retail | 1 | $60B |
|
||
| Technology Distribution | 1 | $58B |
|
||
| Homebuilding | 1 | $35B |
|
||
| Technology Manufacturing | 1 | $35B |
|
||
Price history
+0.0% since first listed4 events — show timeline
- 2025-10-09 Listed $356,900 FORTMLS
- 2025-09-24 Listing Removed — FORTMLS
- 2025-09-04 Price Changed $352,900 FORTMLS
- 2025-07-03 Listed $356,900 FORTMLS
Property tax history
+36.3%/yrLatest (2025): $405 · +11.6% YoY. Source: county tax records.
Cash-flow waterfall
monthlySold comps — $/sqft
last 12 mo · ≤1 miLoading sold comps…