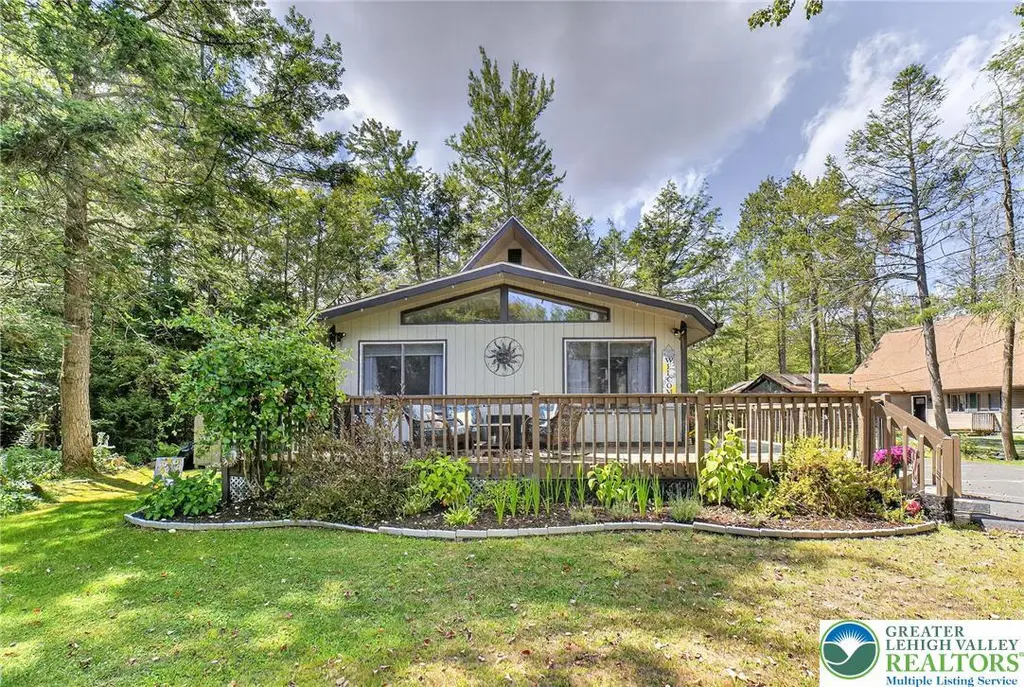
363 Sidney Ave · Mount Pocono, PA
Flood risk 7/10 · Major
- FEMA flood zone
- X (unshaded)
- Chance of flooding over 30 yrs
- 0.99%
- Est. flood insurance / yr
- $507 – $1,088
Fire risk 1/10 · Minimal
- Est. fire insurance / yr
- $511 – $949
Heat risk 2/10 · Minimal
- Hot days now (above 89°F)
- 7 days/yr
- Hot days in 30 yrs
- 15 days/yr
Wind risk 3/10 · Minor
- Chance of severe wind over 30 yrs
- 6.0%
Air-quality risk 2/10 · Minimal
- Unhealthy air days now
- 1 days/yr
- Unhealthy air days in 30 yrs
- 2 days/yr
Risk factors via First Street. Map © Google.
Why this score? — see what drove the D+ grade
The composite is a weighted blend of 9 inputs, each scored 0–100. Each bar is that input's sub-score; the figure is the points it added to the 100-point composite (weight × sub-score).
- Cash flow +13.9/30.0
- ARV discount +6.6/15.0
- Appreciation +5.8/10.0
- DSCR +4.2/10.0
- Schools +4.0/10.0
- Livability +3.9/5.0
- 1% rule +3.6/10.0
- Rent growth +2.5/5.0
- Condition / age +2.5/5.0
$269,000
🖨 Deal sheet 📄 Offer letter ✓ Due diligence
Listing remarks MLS
Light and Airy Home for sale with low taxes and affordable sales price makes which makes this A PERFECT HOME! 3 bedrooms, 1.5 bathrooms with hardwood and laminate flooring. HUGE center kitchen island, lots of light, central sewer, extra storage and So Much More!!! Close to Stores and Highways, Casino and Resorts. MUST MAKE AN OFFER TODAY!!! DON'T HESITATE!!!
Key facts
- 0.3 acre lot
- Parking
- Built 1976
Neighborhood map
What this means for you Summary
Snapshot
- This is a 3-bed/1.5-bath single-family listed at $269k.
Deal economics
- At list price, monthly cash flow is $-36 ($-426/yr) — negative.
- To cash-flow at today's rent, offer at most $263k (2.3% below list).
- To meet the 1% rule (rent ≥ 1% of price), the offer needs to be $231k (14.0% below list).
- Recommended offer: $231k (14.0% below list) — sets the bar for 1% rule.
- Cap rate 6.4% vs local median 5.1% in Mount Pocono — meaningfully above typical; check what's discounted (condition, days-on-market, listing class) to confirm the premium yield is real.
Location & tenants
- Location reads 77/100 on livability (#362 in PA, #3,166 nationally) — a middle-class / working-renter tenant base. Strengths: crime A+, cost of living A+, housing A+; Watch: schools F, commute F.
- Pocono Mountain SD (rural): math 37% / reading 55% proficiency, ranked #245 of 539 in PA (top 46%) — families likely to look elsewhere, expect single-tenant / working-renter base with shorter leases.
- Market conditions: 57 active listings in the ZIP; 278 units permitted in Monroe County in 2024 (52 in 5+ unit buildings).
Forward outlook
- In year one you build about $6k of equity ($2k loan paydown + $4k appreciation (1.5% local appreciation)).
- Monroe County population projected at -11% by 2050 — secular population decline; favor cash flow + early exit over multi-decade hold.
- At projected returns (1.5% appreciation + 3.0% rent growth), your $75k cash investment doubles in ~9 years — after that, you're playing with house money.
- By year 6, paydown + projected appreciation supports a ~$33k cash-out refi (75% LTV) — recoverable capital for the next deal without selling this one.
Negotiation context
- Only 4 days on market — expect competitive offers; lowballing is unlikely to land.
- 4 sale attempts since 7y ago with the ask held roughly flat each time — persistent listings suggest the price (not the market) is what's stuck; bring a comps-based counter.
- Current owner paid $101k; list at $269k implies a 166% gain — meaningful room to come down on a strong offer.
Risks & watch-outs
- Watch-outs: flood insurance adds $66/mo.
- Climate carrying-cost: major flood risk — expect insurance premiums to compound above CPI over the hold.
Questions for the listing agent
- What do current leases actually rent for vs. the listed asking? Can we see a recent rent roll and the last 12 months of T-12 income?
- Built in 1976 — when were the roof, HVAC, electrical panel, plumbing, and water heater last replaced?
- What's the actual annual flood-insurance premium (NFIP or private), and is the property in a SFHA with mandatory coverage?
- What does the HOA fee cover, when was the last increase, and are there any pending special assessments or reserve-fund shortfalls?
- Is there a deadline driving the sale (1031 exchange, divorce, estate, relocation)? That informs how much negotiation room exists.
- Schools are F-rated, which usually means shorter tenancies and higher turnover. Who's the typical renter profile here, and what's been the actual vacancy rate?
- The area grade is low — what's the realistic commute time and amenity access for the typical tenant pool here? Any planned neighborhood developments (good or bad) we should know about?
- What's the average days-on-market for RENTAL listings here right now (not sales)? A rising rental-DOM trend means longer vacancies and softer asking-rent achievability than the comps imply.
- What's the recent tenant-quality profile in this submarket — average credit score on applications, eviction rate, late-payment / NSF rate, and stable-employment percentage? A property-management company in the area should have these aggregated.
- How much new for-sale + rental construction is in the pipeline within 1–3 miles? Heavy new supply typically softens prices + rents 12–24 months out; constrained supply supports both.
Investment metrics
- 1% rule
- 0.86% ✗
- Cap rate
- 6.43%
- Cash-on-cash
- 0.49%
- DSCR
- 1.02
- GRM
- 9.7
CMA / ARV
- ARV (on-the-fly)
- $263,654
- Comps found
- 7
Show comp detail 7 sales within ~0.75 mi
| Address | Dist | Beds/Ba | Sqft | Sold | Price | $/sf | Match |
|---|---|---|---|---|---|---|---|
| 1167 Trapper Ln | 0.41mi | 3/1.0 | 1,092 (-0%) | 1mo | $263,000 | $241 | 77 |
| 5007 Holiday Dr | 0.48mi | 3/2.0 | 1,152 (+5%) | 6mo | $235,000 | $204 | 61 |
| 1120 Trapper Ln | 0.30mi | 3/2.0 | 960 (-12%) | 5mo | $235,000 | $245 | 59 |
| 483 Alter Ave | 0.44mi | 3/2.0 | 1,176 (+8%) | 11mo | $340,000 | $289 | 56 |
| 328 Sidney Ave | 0.14mi | 2/1.0 (-1) | 968 (-12%) | 14mo | $315,000 | $325 | 55 |
| 2121 Freedom Way | 0.34mi | 3/1.0 | 984 (-10%) | 21mo | $226,000 | $230 | 48 |
| 5005 Holiday Dr | 0.50mi | 3/2.0 | 1,235 (+13%) | 14mo | $230,000 | $186 | 42 |
Match score weights: distance 35% · size 25% · config 20% · recency 20%. Top-matched comps best support the ARV.
Projected returns pro-forma
1.54% appreciation · 3.0% rent growth · sell at horizon
- IRR
- 2.5%
- Equity multiple
- 1.13×
- Total profit
- $9,940
- Equity at exit
- $99,420
- IRR
- 6.7%
- Equity multiple
- 1.87×
- Total profit
- $65,395
- Equity at exit
- $138,201
Cash invested: $75,320 (down + closing). Projections, not guarantees.
Landlord ↔ Tenant lean methodology
- Overall (STATE)
- 62 Landlord-Friendly
- State Pennsylvania
- 62 Landlord-Friendly · EVEN
- County
- — inherits STATE
- City
- — inherits STATE
ZIP-level market 18346
- Home prices YoY
- 0.8%
- Active inventory
- 57
- Price-to-rent
- 9.7×
Monthly cashflow live
- Estimated rent
- $2,314 medium interval (Pro) →
- Mortgage (P&I)
- −$1,411
- Tax from tax record
- −$195 /mo · $2,345/yr
- Insurance
- −$112
- Flood insurance flood zone
- −$66 /mo · $798/yr
- HOA
- −$79
- Vacancy / Maint / Mgmt
- −$486
- Net cashflow
- $-36
Break-even live
UW: 25.0% down · 7.5% · 30yr · 1.5% tax · 5.0% vac · 8.0% maint · 8.0% mgmt
Financing live
Cash to close
- Down payment
- $67,250
- Closing costs
- $8,070
- Reserves months
- —
- Total cash needed
- —
Loan-product check · same deal, 3 products live
Conventional
25% down · 7.5% · 30yr
- Down + closing
- —
- Monthly P&I
- —
- Monthly cashflow
- —
- DSCR
- —
- Eligible?
- —
Personal DTI + credit; lowest rate.
DSCR
20% down · 8.5% · 30yr
- Down + closing
- —
- Monthly P&I
- —
- Monthly cashflow
- —
- DSCR
- —
- Eligible?
- —
No personal income docs; deal must DSCR.
Hard money
10% down · 12.0% · 12mo
- Down + closing
- —
- Monthly P&I
- —
- Monthly cashflow
- —
- DSCR
- —
- Eligible?
- —
Short-term bridge; refi at stabilization.
HOA detail
- Monthly dues
- $79 · $948/yr
- Likely covers
- sewer
Listing history 9 events
-
2026-04-21status Pending
-
2026-04-18$269,000 Active
-
2025-10-12status Pending
-
2025-10-02status Active
-
2025-09-09$269,000 Active
-
2019-10-21soldstatus $101,000
-
2019-10-11soldstatus $101,000 363-char remark
Show marketing remark (363 chars)
Light and Airy Home for sale with low taxes and affordable sales price makes which makes this A PERFECT HOME! 3 bedrooms, 1.5 bathrooms with hardwood and laminate flooring. HUGE center kitchen island, lots of light, central sewer, extra storage and So Much More!!! Close to Stores and Highways, Casino and Resorts. MUST MAKE AN OFFER TODAY!!! DON'T HESITATE!!!
-
2019-08-30$107,913 363-char remark
Show marketing remark (363 chars)
Light and Airy Home for sale with low taxes and affordable sales price makes which makes this A PERFECT HOME! 3 bedrooms, 1.5 bathrooms with hardwood and laminate flooring. HUGE center kitchen island, lots of light, central sewer, extra storage and So Much More!!! Close to Stores and Highways, Casino and Resorts. MUST MAKE AN OFFER TODAY!!! DON'T HESITATE!!!
-
2013-04-04soldstatus $73,000
ⓘ Source: listings_history table (triggers on properties + properties_extension) + one-shot
backfill from property_details.listing_events for pre-trigger history.
Tax reassessment forecast PA · Partial reset (capped growth)
- Current annual tax
- $2,345 · $195/mo
- Projected year-2 tax
- $3,298 · $275/mo
- Expected delta
- +$953/yr (+$79/mo · 40.6%)
ⓘ Screening estimate from a state-policy table — verify with the county assessor before closing.
Climate risk First Street
- Flood 7/10 Severe FEMA zone X (unshaded) · 99% chance over 30 yrs
- Wildfire 1/10 Low
- Heat 2/10 Low 7 d/yr ≥89°F today · 15 d/yr by 30 yrs out
- Wind 3/10 Moderate 6% chance of damaging wind over 30 yrs
- Air quality 2/10 Low 1 unhealthy d/yr today · 2 by 30 yrs out
Nearby sold comps map
Loading sold comps map…
Walkable amenities ~0.75 mi
Loading nearby amenities…
Taxation est. · year 1
- Rental income
- $27,769
- − Mortgage interest
- −$15,068
- − Property taxes
- −$2,345
- − Insurance
- −$2,142
- − Repairs & maintenance
- −$2,222
- − Management
- −$2,222
- − HOA
- −$948
- − Depreciation
- −$7,825
- Taxable loss
- −$5,003
- Est. tax savings @ 24.0%
- +$1,201
- After-tax cash flow
- $775/yr
For passive investors: Depreciation is non-cash, so a rental often shows a tax loss while cash-flowing — sheltering income. Rental losses are passive: they offset passive income freely, and up to $25,000/yr can offset ordinary (W-2) income if you actively participate and your MAGI is under $100k (phasing out to $0 by $150k); unused losses carry forward. On sale, claimed depreciation is recaptured at up to 25%, and gains may owe capital-gains tax (a 1031 exchange can defer both). Figures are a year-1 estimate at your 24.0% rate — not tax advice; consult a CPA.
Schools (NCES district)
- District
- Pocono Mountain SD
- NCES district ID
- 4219500
- Math proficiency
- 37% ▼ -5.00%
- Reading proficiency
- 55% ▲ 1.00%
- Median HH income
- $55,317
- Composite
- 39.91/100
- National rank
- #3856
- State rank
- #245 of 539 in PA
Livability — Mount Pocono
- Score
- 77/100
- State rank
- #362
- US rank
- #3166
Category grades
Schools grade is shown separately in the Schools card above.
Census & demographics
- Population (ZIP)
- 2,316
Population outlook (Monroe County) Hauer SSP2
- Today (2025)
- 164,099 people
- By 2030
- 161,412 · -1.6%
- By 2040
- 154,616 · -5.8%
- By 2050
- 146,710 · -10.6%
- By 2075
- 140,830 · -14.2%
- By 2100
- 138,472 · -15.6%
Race, ethnicity, and origin ACS 2023
- Neighborhood character
- Diverse neighborhood (Simpson 0.65)
- Race & ethnicity
- White 48% Black 28% Hispanic / Latino 19% Two or more races 12%
- Hispanic origin (detail)
- Cuban 2% Dominican 3%
- Common ancestry
- Russian 8% Romanian 6% Slovak 5%
- Foreign-born
- 20% · Canada
- Languages at home
- 77% English-only · Spanish 19% Russian/Polish/Slavic 4%
Political lean MEDSL · Monroe
- 2024 margin
- Toss-up / Even · D 49.1% · R 49.9%
- 2008→2024 swing
- -17.1pp toward R · 2008: 16.3pp · 2024: -0.8pp
- All cycles
- 2024: R+0.8 2020: D+6.4 2016: D+0.3 2012: D+14.0 2008: D+16.3
Not yet ingested
- Civics
- —
Market trends
- HPI YoY
- ▲ 1.54%
- Current HPI
- 189.8011
- Rent YoY
- —
- Metro
- —
- State GDP YoY
- ▲ 1.68%
- F500 in state
- 34
Industry mix (Fortune 500 HQ in PA)
| Industry | F500 HQs | Revenue |
|---|---|---|
| Healthcare | 2 | $309B |
|
||
| Insurance | 2 | $27B |
|
||
| Telecommunications / Media | 1 | $124B |
|
||
| Industrial Distribution | 1 | $22B |
|
||
| Financial Services | 1 | $20B |
|
||
| Chemicals / Materials | 1 | $18B |
|
||
Price history
+268.5% since first listed9 events — show timeline
- 2026-04-21 Pending — GLVRMLS
- 2026-04-18 Listed $269,000 GLVRMLS
- 2025-10-12 Pending — PMAR
- 2025-10-02 Relisted — PMAR
- 2025-09-09 Listed $269,000 PMAR
- 2019-10-21 Sold (Public Records) $101,000 Public Records
- 2019-10-11 Sold (MLS) $101,000 PMAR
- 2019-08-30 Listed $107,913 PMAR
- 2013-04-04 Sold (Public Records) $73,000 Public Records
Property tax history
-2.0%/yrLatest (2026): $2,345 · +3.2% YoY. Source: county tax records.
Cash-flow waterfall
monthlySold comps — $/sqft
last 12 mo · ≤1 miLoading sold comps…