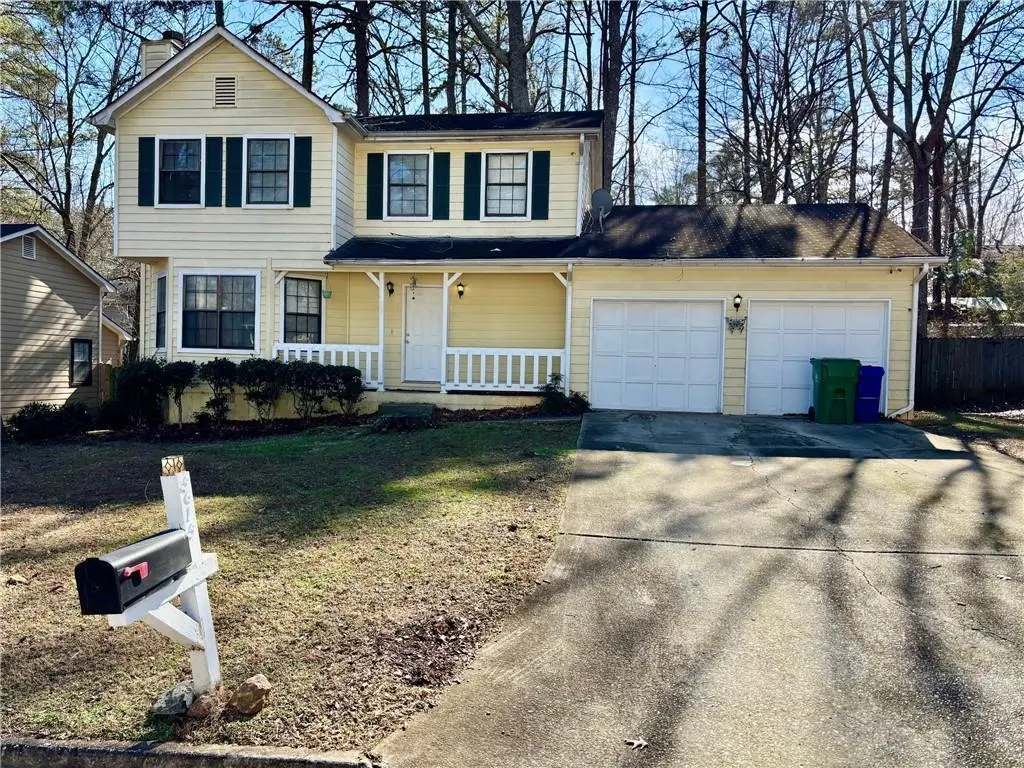
5615 Pennybrook Ct · Stone Mountain, GA
Flood risk 1/10 · Minimal
- FEMA flood zone
- X (unshaded)
- Chance of flooding over 30 yrs
- 0.0%
- Est. flood insurance / yr
- $507 – $1,088
Fire risk 1/10 · Minimal
- Est. fire insurance / yr
- $963 – $1,789
Heat risk 5/10 · Moderate
- Hot days now (above 104°F)
- 7 days/yr
- Hot days in 30 yrs
- 18 days/yr
Wind risk 5/10 · Moderate
- Chance of severe wind over 30 yrs
- 25.0%
Air-quality risk 6/10 · Moderate
- Unhealthy air days now
- 8 days/yr
- Unhealthy air days in 30 yrs
- 11 days/yr
Risk factors via First Street. Map © Google.
Why this score? — see what drove the C- grade
The composite is a weighted blend of 9 inputs, each scored 0–100. Each bar is that input's sub-score; the figure is the points it added to the 100-point composite (weight × sub-score).
- Cash flow +16.5/30.0
- ARV discount +15.0/15.0
- 1% rule +5.7/10.0
- DSCR +5.1/10.0
- Livability +4.0/5.0
- Rent growth +2.8/5.0
- Condition / age +2.5/5.0
- Schools +2.1/10.0
- Appreciation +0.0/10.0
$185,000
🖨 Deal sheet 📄 Offer letter ✓ Due diligence
Listing remarks MLS
This 2-story traditional home offers great potential with a little TLC. It includes a formal living room with a fireplace, a separate dining room, and a spacious eat-in kitchen. Located in a quiet, mature, and well-maintained neighborhood, itCOs a great opportunity to create your dream home.
Key facts
- Separate dining room
- Formal living room
- Quiet neighborhood
Tags
Neighborhood map
What this means for you Summary
Snapshot
- This is a 3-bed/2.5-bath single-family listed at $185k.
Deal economics
- At list price, monthly cash flow is $110 ($1k/yr) — positive.
- The deal already cash-flows at list — no discount required.
- Meets the 1% rule at list price ($2k rent vs $185k).
- Recommended offer: $174k (6.0% below list) — sets the bar for market timing.
- Cap rate 7.0% vs local median 5.1% in Stone Mountain — top-decile yield for the area; either an underpriced asset or a hidden risk that comps aren't pricing in. Stress-test before assuming the spread holds.
Location & tenants
- Location reads 79/100 on livability (#11 in GA, #1,977 nationally) — a middle-class / working-renter tenant base. Strengths: commute A+, cost of living A+, housing A+; Watch: employment D+, schools F, crime F.
- Dekalb County (suburban): math 19% / reading 28% proficiency, ranked #125 of 174 in GA (top 72%) — low school quality limits family demand, transient renter base, plan for 1-2y turnover; 68% free/reduced lunch — lower-income household profile, screen leases tightly.
- Market conditions: Rents rising (+1.3%/yr); 246 active listings in the ZIP; 27 comparable units currently listed for rent nearby; rentals at typical pace (median 22d on market — plan ~3-4 weeks tenant-placement turnaround); solid renter incomes; 1,240 units permitted in DeKalb County in 2024 (385 in 5+ unit buildings).
Forward outlook
- Local home prices are declining (-3.0%/yr); year-one equity from $1k of loan paydown is wiped out by about $6k of value loss. Plan a longer hold.
- DeKalb County population projected at +28% by 2050 — long-run rental-demand tailwind backs the buy-and-hold thesis.
Negotiation context
- It's been on market 84 days — a 6% lower offer ($174k) is reasonable based on typical stale-listing flexibility.
- 4 sale attempts with the ask held roughly flat each time — persistent listings suggest the price (not the market) is what's stuck; bring a comps-based counter.
Risks & watch-outs
- Watch-outs: property tax is 2.6% of price.
- Climate carrying-cost: moderate wind risk, 25% chance of damaging wind over 30y; extreme-heat days projected 7→18/yr by 2055 (HVAC capex compounding) — expect insurance premiums to compound above CPI over the hold.
Questions for the listing agent
- It's been on market 84 days. Have you received any prior offers? Is the seller open to a 6% concession, seller financing, or rate buy-down credit?
- Property tax is high relative to price — has the assessment been appealed recently, and will the sale trigger a re-assessment?
- Why hasn't it sold? Are there any deal-killer items the seller is aware of (foundation, flood, title, zoning, code violations)?
- Is there a deadline driving the sale (1031 exchange, divorce, estate, relocation)? That informs how much negotiation room exists.
- Schools are F-rated, which usually means shorter tenancies and higher turnover. Who's the typical renter profile here, and what's been the actual vacancy rate?
- Crime grade is F in this area — have there been break-ins, vandalism, or insurance claims at this property in the last 3 years? What carrier currently insures it and at what premium?
- What's the average days-on-market for RENTAL listings here right now (not sales)? A rising rental-DOM trend means longer vacancies and softer asking-rent achievability than the comps imply.
- What's the recent tenant-quality profile in this submarket — average credit score on applications, eviction rate, late-payment / NSF rate, and stable-employment percentage? A property-management company in the area should have these aggregated.
- How much new for-sale + rental construction is in the pipeline within 1–3 miles? Heavy new supply typically softens prices + rents 12–24 months out; constrained supply supports both.
Investment metrics
- 1% rule
- 1.07% ✓
- Cap rate
- 7.00%
- Cash-on-cash
- 2.54%
- DSCR
- 1.11
- GRM
- 7.8
CMA / ARV
- ARV (median comp)
- $280,890
- List price
- $185,000
- Delta
- -34.14%
- Verdict
- UNDERPRICED
- Comps
- 20 within 1.0 mi
Show comp detail 12 sales within ~0.75 mi
| Address | Dist | Beds/Ba | Sqft | Sold | Price | $/sf | Match |
|---|---|---|---|---|---|---|---|
| 512 Ryan Pl | 0.11mi | 3/2.5 | 1,676 (+5%) | 2mo | $140,000 | $84 | 84 |
| 5515 Pennybrook Trl | 0.15mi | 3/2.5 | 1,588 (-0%) | 11mo | $280,000 | $176 | 84 |
| 508 Jaywood Dr | 0.47mi | 3/2.5 | 1,584 (-0%) | 10mo | $249,900 | $158 | 69 |
| 643 Woodsong Ln | 0.43mi | 3/2.0 | 1,625 (+2%) | 8mo | $245,000 | $151 | 68 |
| 459 Orchard Dr | 0.39mi | 3/2.5 | 1,549 (-3%) | 13mo | $285,000 | $184 | 67 |
| 589 Catrina Ct | 0.10mi | 3/2.0 | 1,404 (-12%) | 13mo | $194,000 | $138 | 63 |
| 5848 Navarre Ct | 0.61mi | 3/2.0 | 1,516 (-5%) | 7mo | $220,000 | $145 | 56 |
| 425 Orchard Dr | 0.46mi | 4/3.0 (+1) | 1,500 (-6%) | 11mo | $249,900 | $167 | 53 |
| 482 Maid Marion Ln | 0.55mi | 3/2.5 | 1,776 (+12%) | 4mo | $260,000 | $146 | 52 |
| 446 Jaywood Dr | 0.40mi | 3/2.0 | 1,374 (-14%) | 8mo | $245,000 | $178 | 50 |
| 5393 Ridge Forest Dr | 0.60mi | 4/2.0 (+1) | 1,536 (-4%) | 13mo | $270,000 | $176 | 48 |
| 5370 Ridge Forest Dr | 0.66mi | 3/2.0 | 1,400 (-12%) | 1mo | $224,000 | $160 | 46 |
Match score weights: distance 35% · size 25% · config 20% · recency 20%. Top-matched comps best support the ARV.
Projected returns pro-forma
-3.0% appreciation · 1.3% rent growth · sell at horizon
- IRR
- -14.4%
- Equity multiple
- 0.49×
- Total profit
- $-26,187
- Equity at exit
- $27,584
- IRR
- -9.0%
- Equity multiple
- 0.49×
- Total profit
- $-26,438
- Equity at exit
- $15,995
Cash invested: $51,800 (down + closing). Projections, not guarantees.
Landlord ↔ Tenant lean methodology
- Overall (STATE)
- 90 Strongly Landlord-Friendly
- State Georgia
- 90 Strongly Landlord-Friendly · R+3
- County
- — inherits STATE
- City
- — inherits STATE
ZIP-level market 30087
- Rents YoY
- 1.3%
- Active inventory
- 246
- Price-to-rent
- 7.8×
Monthly cashflow live
- Estimated rent
- $1,974 high interval (Pro) →
- Mortgage (P&I)
- −$970
- Tax from tax record
- −$403 /mo · $4,832/yr
- Insurance
- −$77
- HOA
- −$0
- Vacancy / Maint / Mgmt
- −$415
- Net cashflow
- $110
Break-even live
UW: 25.0% down · 7.5% · 30yr · 1.5% tax · 5.0% vac · 8.0% maint · 8.0% mgmt
Financing live
Cash to close
- Down payment
- $46,250
- Closing costs
- $5,550
- Reserves months
- —
- Total cash needed
- —
Loan-product check · same deal, 3 products live
Conventional
25% down · 7.5% · 30yr
- Down + closing
- —
- Monthly P&I
- —
- Monthly cashflow
- —
- DSCR
- —
- Eligible?
- —
Personal DTI + credit; lowest rate.
DSCR
20% down · 8.5% · 30yr
- Down + closing
- —
- Monthly P&I
- —
- Monthly cashflow
- —
- DSCR
- —
- Eligible?
- —
No personal income docs; deal must DSCR.
Hard money
10% down · 12.0% · 12mo
- Down + closing
- —
- Monthly P&I
- —
- Monthly cashflow
- —
- DSCR
- —
- Eligible?
- —
Short-term bridge; refi at stabilization.
Rent comps 27 comps
| Address | Beds | Baths | Sqft | Rent | $/sqft | DOM | Units | Dist |
|---|---|---|---|---|---|---|---|---|
| 5612 Pennybrook Ct Stone Mountain, GA | 3.0 | 2.0 | 1364 | $1,941 | $1.42 | 12d | 1 | 0.02mi |
| 524 Julius Dr Stone Mountain, GA | 3.0 | 2.0 | 1780 | $1,795 | $1.01 | 43d | 1 | 0.21mi |
| 450 Pennybrook Dr Stone Mountain, GA | 3.0 | 2.0 | 1404 | $1,750 | $1.25 | 24d | 1 | 0.26mi |
| 5509 Stonehaven Way Stone Mountain, GA | 4.0 | 3.0 | 1635 | $1,899 | $1.16 | 21d | 1 | 0.29mi |
| 779 Pepperwood Trl Stone Mountain, GA | 3.0 | 2.0 | 1458 | $2,045 | $1.40 | 4d | 1 | 0.53mi |
| 469 Sherwood Grn Stone Mountain, GA | 3.0 | 2.0 | 1792 | $1,810 | $1.01 | 11d | 1 | 0.54mi |
| 697 Pepperwood Trl Stone Mountain, GA | 3.0 | 2.0 | 1576 | $1,650 | $1.05 | 43d | 1 | 0.54mi |
| 5370 Zachary Dr Stone Mountain, GA | 4.0 | 2.0 | 1556 | $1,150 | $0.74 | 24d | 1 | 0.59mi |
| 5811 Navarre Ct Stone Mountain, GA | 3.0 | 2.0 | 1864 | $1,911 | $1.03 | 2d | 1 | 0.65mi |
| 5621 Stonington Trace Pkwy Stone Mountain, GA | 2.0 | 3.5 | 1292 | $1,581 | $1.22 | 15d | 1 | 0.66mi |
| 5353 Ridgemere Ct Stone Mountain, GA | 3.0 | 2.5 | 1160 | $1,465 | $1.26 | 5d | 1 | 0.67mi |
| 5351 Ridgemere Ct Stone Mountain, GA | 3.0 | 2.5 | 1160 | $1,465 | $1.26 | 5d | 1 | 0.68mi |
| 5713 Wells Cir Stone Mountain, GA | 3.0 | 2.5 | 1304 | $1,706 | $1.31 | 5d | 1 | 0.69mi |
| 5707 Wells Cir Stone Mountain, GA | 2.0 | 2.5 | 1160 | $1,506 | $1.30 | 4d | 1 | 0.70mi |
| 768 Fourth St Stone Mountain, GA | 3.0 | 2.0 | 1200 | $2,100 | $1.75 | 5d | 1 | 0.72mi |
| 5702 Wells Cir Stone Mountain, GA | 2.0 | 2.5 | 1160 | $1,495 | $1.29 | 43d | 1 | 0.72mi |
| 5280 Ridge Forest Dr Stone Mountain, GA | 2.0 | 2.5 | 1170 | $1,325 | $1.13 | 43d | 1 | 0.73mi |
| 5290 Stonebush Ter Unit A Stone Mountain, GA | 2.0 | 2.5 | 1200 | $1,450 | $1.21 | 18d | 1 | 0.80mi |
| 5308 Omalley Ln Stone Mountain, GA | 4.0 | 2.5 | 1950 | $1,949 | $1.00 | 43d | 1 | 0.98mi |
| 643 Navarre Dr Stone Mountain, GA | 3.0 | 2.5 | 1666 | $2,600 | $1.56 | 43d | 1 | 1.03mi |
| 651 Mincey Woods Ct Stone Mountain, GA | 3.0 | 2.0 | 2188 | $2,150 | $0.98 | 43d | 1 | 1.07mi |
| 427 Chanterelle Dr Stone Mountain, GA | 3.0 | 2.5 | 1608 | $1,650 | $1.03 | 2d | 1 | 1.14mi |
| 827 San Miguel Dr Stone Mountain, GA | 3.0 | 2.0 | 1272 | $1,550 | $1.22 | 16d | 1 | 1.29mi |
| 1150 Rankin St Stone Mountain, GA | 2.0–3.0 | 2.5 | 1437 | $1,850 | $1.29 | 43d | 2 | 1.37mi |
| 811 King Rd Stone Mountain, GA | 3.0 | 3.0 | 1840 | $3,300 | $1.79 | 43d | 1 | 1.38mi |
| 1150 Rankin St Stone Mountain, GA | 2.0 | 2.5 | 1495 | $1,850 | $1.24 | 24d | 1 | 1.40mi |
| 1047 Ridge Ave Stone Mountain, GA | 3.0 | 1.0 | 1402 | $2,150 | $1.53 | 24d | 1 | 1.43mi |
Listing history 8 events
-
2026-03-04$185,000 New 292-char remark
Show marketing remark (292 chars)
This 2-story traditional home offers great potential with a little TLC. It includes a formal living room with a fireplace, a separate dining room, and a spacious eat-in kitchen. Located in a quiet, mature, and well-maintained neighborhood, itCOs a great opportunity to create your dream home.
-
2026-03-03$185,000 Active 297-char remark
Show marketing remark (297 chars)
This 2-story traditional home offers great potential with a little TLC. It includes a formal living room with a fireplace, a separate dining room, and a spacious eat-in kitchen. Located in a quiet, mature, and well-maintained neighborhood, it’s a great opportunity to create your dream home.
-
2025-07-31historical
-
2025-07-31historical
-
2025-04-17price $219,000
-
2025-04-17price $219,000
-
2025-01-29$230,000 New
-
2025-01-29$230,000 Active
ⓘ Source: listings_history table (triggers on properties + properties_extension) + one-shot
backfill from property_details.listing_events for pre-trigger history.
Tax reassessment forecast GA · Resets to sale price
- Current annual tax
- $4,832 · $403/mo
- Projected year-2 tax
- $4,832 · $403/mo
- Expected delta
- $0/yr ($0/mo · 0.0%)
ⓘ Screening estimate from a state-policy table — verify with the county assessor before closing.
Climate risk First Street
- Flood 1/10 Low FEMA zone X (unshaded) · 0% chance over 30 yrs
- Wildfire 1/10 Low
- Heat 5/10 Major 7 d/yr ≥104°F today · 18 d/yr by 30 yrs out
- Wind 5/10 Major 25% chance of damaging wind over 30 yrs
- Air quality 6/10 Major 8 unhealthy d/yr today · 11 by 30 yrs out
Nearby sold comps map
Loading sold comps map…
Walkable amenities ~0.75 mi
Loading nearby amenities…
Taxation est. · year 1
- Rental income
- $23,688
- − Mortgage interest
- −$10,363
- − Property taxes
- −$4,832
- − Insurance
- −$925
- − Repairs & maintenance
- −$1,895
- − Management
- −$1,895
- − Depreciation
- −$5,382
- Taxable loss
- −$1,604
- Est. tax savings @ 24.0%
- +$385
- After-tax cash flow
- $1,699/yr
For passive investors: Depreciation is non-cash, so a rental often shows a tax loss while cash-flowing — sheltering income. Rental losses are passive: they offset passive income freely, and up to $25,000/yr can offset ordinary (W-2) income if you actively participate and your MAGI is under $100k (phasing out to $0 by $150k); unused losses carry forward. On sale, claimed depreciation is recaptured at up to 25%, and gains may owe capital-gains tax (a 1031 exchange can defer both). Figures are a year-1 estimate at your 24.0% rate — not tax advice; consult a CPA.
Schools (NCES district)
- District
- Dekalb County
- NCES district ID
- 1301740
- Math proficiency
- 19% ▼ -12.00%
- Reading proficiency
- 28% ▼ -7.00%
- Median HH income
- $51,448
- Composite
- 20.92/100
- National rank
- #8482
- State rank
- #125 of 174 in GA
Livability — Stone Mountain
- Score
- 79/100
- State rank
- #11
- US rank
- #1977
Category grades
Schools grade is shown separately in the Schools card above.
Census & demographics
- County
- Dekalb County · 782,738 people
- City population
- 130,941
- Metro
- Atlanta-Sandy Springs-Alpharetta, GA
- Population (ZIP)
- 38,977
- Household income
- $96,491
- Rent vs Own
- Severe rent burden
- 780.0
Population outlook (DeKalb County) Hauer SSP2
- Today (2025)
- 839,977 people
- By 2030
- 891,768 · +6.2%
- By 2040
- 988,894 · +17.7%
- By 2050
- 1,074,583 · +27.9%
- By 2075
- 1,245,026 · +48.2%
- By 2100
- 1,303,135 · +55.1%
Race, ethnicity, and origin ACS 2023
- Neighborhood character
- Diverse neighborhood (Simpson 0.56)
- Race & ethnicity
- Black 62% White 22% Asian 6% Hispanic / Latino 5% Two or more races 5%
- Common ancestry
- Slovak 1% Lithuanian 1% Serbian 1%
- Foreign-born
- 14% · Canada, China, South Korea
- Languages at home
- 86% English-only · Spanish 5% Other Indo-European 2% Other Asian/Pacific 1%
Political lean MEDSL · DeKalb
- 2024 margin
- Solid D (+64.8) · D 81.9% · R 17.1% · Other 1.0%
- 2008→2024 swing
- +6.1pp toward D · 2008: 58.6pp · 2024: 64.8pp
- All cycles
- 2024: D+64.8 2020: D+67.4 2016: D+64.8 2012: D+56.8 2008: D+58.6
Not yet ingested
- Civics
- —
Market trends
- HPI YoY
- ▼ -228.39%
- Current HPI
- 204.2122
- Rent YoY
- ▲ 1.30%
- Metro
- Atlanta-Sandy Springs-Alpharetta, GA
- State GDP YoY
- ▲ 2.66%
- F500 in state
- 28
Industry mix (Fortune 500 HQ in GA)
| Industry | F500 HQs | Revenue |
|---|---|---|
| Paper / Packaging | 2 | $29B |
|
||
| Retail | 1 | $160B |
|
||
| Transportation / Logistics | 1 | $91B |
|
||
| Airlines | 1 | $62B |
|
||
| Consumer Goods | 1 | $47B |
|
||
| Utilities | 1 | $25B |
|
||
Price history
-19.6% since first listed8 events — show timeline
- 2026-03-04 Listed $185,000 GAMLS
- 2026-03-03 Listed $185,000 FMLS
- 2025-07-31 Listing Removed — FMLS
- 2025-07-31 Listing Removed — GAMLS
- 2025-04-17 Price Changed $219,000 FMLS
- 2025-04-17 Price Changed $219,000 GAMLS
- 2025-01-29 Listed $230,000 FMLS
- 2025-01-29 Listed $230,000 GAMLS
Property tax history
+4.3%/yrLatest (2025): $4,832 · -2.3% YoY. Source: county tax records.
Cash-flow waterfall
monthlySold comps — $/sqft
last 12 mo · ≤1 miLoading sold comps…