221 Mayo Rd · Mayo, SC
Flood risk 1/10 · Minimal
- FEMA flood zone
- X (unshaded)
- Chance of flooding over 30 yrs
- 0.0%
- Est. flood insurance / yr
- $473 – $860
Fire risk 4/10 · Minor
- Est. fire insurance / yr
- $783 – $1,453
Heat risk 6/10 · Moderate
- Hot days now (above 105°F)
- 7 days/yr
- Hot days in 30 yrs
- 17 days/yr
Wind risk 2/10 · Minimal
- Chance of severe wind over 30 yrs
- 2.0%
Air-quality risk 3/10 · Minor
- Unhealthy air days now
- 3 days/yr
- Unhealthy air days in 30 yrs
- 3 days/yr
Risk factors via First Street. Map © Google.
Why this score? — see what drove the C+ grade
The composite is a weighted blend of 9 inputs, each scored 0–100. Each bar is that input's sub-score; the figure is the points it added to the 100-point composite (weight × sub-score).
- Cash flow +22.3/30.0
- ARV discount +15.0/15.0
- DSCR +7.1/10.0
- 1% rule +4.8/10.0
- Schools +4.5/10.0
- Livability +3.2/5.0
- Rent growth +2.5/5.0
- Condition / age +2.5/5.0
- Appreciation +0.0/10.0
$149,999
🖨 Deal sheet (PDF) 📄 Offer letter ✓ Due diligence
Listing remarks
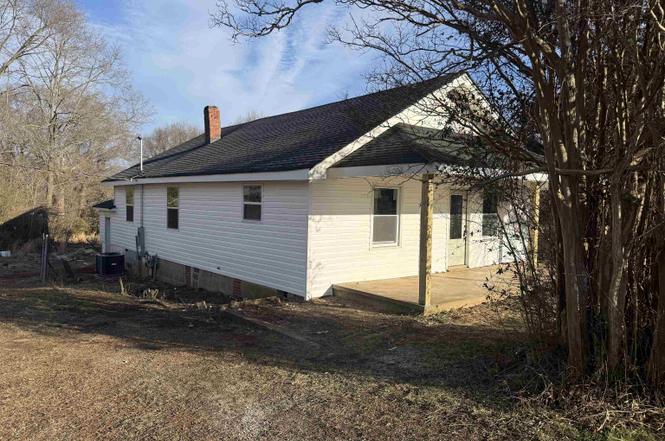
Investor Special – Sold As-Is. Situated on . 79 acres, this 3-bedroom, 2-bath home offers a prime opportunity for investors or buyers looking to complete a project with major improvements already finished. Conveniently located near HWY 221, I-85, Chesnee, Cowpens, and Boiling Springs in Spartanburg School District 2, the partially cleared and leveled lot provides usable space and added curb appeal. The home has been extensively updated down to the studs with a brand-new roof and fascia, new plumbing, electrical, HVAC, and windows, a redesigned open-concept floor plan, an added full main bathroom, brand-new floor joists and subfloors, plus new front porch posts and siding already insta
Key facts
- New plumbing
- Brand new roof
- New hvac
Tags
Property features AI
Exterior
- Parking: No parking
- Utilities: Public water; Septic tank
- Home design: Single-family residence; One story; Residential property
- Construction: Vinyl siding; Slab foundation
- Exterior features: Porch; Level and wooded lot
Interior
- Flooring: See remarks
- Bathrooms: 2 full bathrooms
- Interior features: Open floorplan; Unfinished basement
- Laundry & utility: No laundry hookups listed
Neighborhood map
What this means for you Summary
Snapshot
- This is a 3-bed/1.0-bath single-family listed at $150k.
Deal economics
- At list price, monthly cash flow is $247 ($3k/yr) — positive.
- The deal already cash-flows at list — no discount required.
- To meet the 1% rule (rent ≥ 1% of price), the offer needs to be $146k (2.5% below list).
- Recommended offer: $132k (12.0% below list) — sets the bar for market timing.
- Cap rate 8.3% vs local median 2.7% in Mayo — top-decile yield for the area; either an underpriced asset or a hidden risk that comps aren't pricing in. Stress-test before assuming the spread holds.
Location & tenants
- Location reads 64/100 on livability (#151 in SC) — a middle-class / working-renter tenant base. Strengths: cost of living A+, housing A+, crime A; Watch: employment D+, amenities F, commute F.
- Spartanburg 02 (suburban): math 49% / reading 56% proficiency, ranked #6 of 80 in SC (top 8%) — acceptable for families but not a draw, mixed tenant base, ~2y average lease.
- Zoned schools: Mayo Elementary (math 52% / reading 47%, grade D, #168 of 597 statewide, top 31%, 338 students, 71% FRL); Chesnee Middle (math 36% / reading 48%, grade D-, #64 of 229 statewide, top 29%, 534 students, 69% FRL); Chesnee High (math 62% / reading 87%, grade B+, #38 of 196 statewide, top 20%, 704 students, 63% FRL) — zoned schools average 68% FRL vs 44% district-wide (23 pts higher); higher-poverty schools than district average — tighter screening recommended.
- Market conditions: 68 active listings in the ZIP; 3,129 units permitted in Spartanburg County in 2024 (40 in 5+ unit buildings).
Forward outlook
- Local home prices are declining (-3.0%/yr); year-one equity from $1k of loan paydown is wiped out by about $4k of value loss. Plan a longer hold.
- Spartanburg County population projected at +18% by 2050 — long-run rental-demand tailwind backs the buy-and-hold thesis.
Negotiation context
- It's been on market 126 days — a 12% lower offer ($132k) is reasonable based on typical stale-listing flexibility.
- Current owner paid $90k; list at $150k implies a 67% gain — meaningful room to come down on a strong offer.
Risks & watch-outs
- Watch-outs: built in 1935 — expect roof / HVAC / electrical / plumbing capex.
- Climate carrying-cost: extreme-heat days projected 7→17/yr by 2055 (HVAC capex compounding) — expect insurance premiums to compound above CPI over the hold.
Questions for the listing agent
- It's been on market 126 days. Have you received any prior offers? Is the seller open to a 12% concession, seller financing, or rate buy-down credit?
- Built in 1935 — when were the roof, HVAC, electrical panel, plumbing, and water heater last replaced?
- Why hasn't it sold? Are there any deal-killer items the seller is aware of (foundation, flood, title, zoning, code violations)?
- Is there a deadline driving the sale (1031 exchange, divorce, estate, relocation)? That informs how much negotiation room exists.
- What's the average days-on-market for RENTAL listings here right now (not sales)? A rising rental-DOM trend means longer vacancies and softer asking-rent achievability than the comps imply.
- What's the recent tenant-quality profile in this submarket — average credit score on applications, eviction rate, late-payment / NSF rate, and stable-employment percentage? A property-management company in the area should have these aggregated.
- How much new for-sale + rental construction is in the pipeline within 1–3 miles? Heavy new supply typically softens prices + rents 12–24 months out; constrained supply supports both.
Investment metrics
- 1% rule
- 0.98% ✗
- Cap rate
- 8.27%
- Cash-on-cash
- 7.05%
- DSCR
- 1.31
- GRM
- 8.5
CMA / ARV
- ARV (on-the-fly)
- $228,480
- Comps found
- 4
Show comp detail 4 sales within ~0.75 mi
| Address | Dist | Beds/Ba | Sqft | Sold | Price | $/sf | Match |
|---|---|---|---|---|---|---|---|
| 221 Mayo Rd | 0.01mi | 3/1.5 | 1,344 (0%) | 9mo | $90,000 | $67 | 90 |
| 151 Thrift Rd | 0.25mi | 3/2.0 | 1,442 (+7%) | 7mo | $245,000 | $170 | 66 |
| 205 Lakeview Cir | 0.32mi | 3/2.0 | 1,171 (-13%) | 14mo | $158,500 | $135 | 48 |
| 111 Emory Rd | 0.56mi | 3/2.0 | 1,161 (-14%) | 6mo | $212,000 | $183 | 42 |
Match score weights: distance 35% · size 25% · config 20% · recency 20%. Top-matched comps best support the ARV.
Projected returns pro-forma
-3.0% appreciation · 3.0% rent growth · sell at horizon
- IRR
- -5.5%
- Equity multiple
- 0.79×
- Total profit
- $-8,655
- Equity at exit
- $22,365
- IRR
- 4.1%
- Equity multiple
- 1.30×
- Total profit
- $12,460
- Equity at exit
- $12,969
Cash invested: $42,000 (down + closing). Projections, not guarantees.
Landlord ↔ Tenant lean methodology
- Overall (STATE)
- 90 Strongly Landlord-Friendly
- State South Carolina
- 90 Strongly Landlord-Friendly · R+6
- County
- — inherits STATE
- City
- — inherits STATE
ZIP-level market 29330
- Home prices YoY
- -9.2%
- Active inventory
- 68
- Price-to-rent
- 8.5×
Monthly cashflow live
- Estimated rent
- $1,463 medium interval (Pro) →
- Mortgage (P&I)
- −$787
- Tax from tax record
- −$60 /mo · $721/yr
- Insurance
- −$62
- HOA
- −$0
- Lot rent
- −$0
- Vacancy / Maint / Mgmt
- −$307
- Net cashflow
- $247
Break-even live
Sensitivity live
| Price | -10% $332 | -5% $289 | +0% $247 | +5% $204 | +10% $162 |
|---|---|---|---|---|---|
| Rent | -10% $131 | -5% $189 | +0% $247 | +5% $304 | +10% $362 |
| Rate | -1.0pp $322 | -0.5pp $285 | base $247 | +0.5pp $208 | +1.0pp $168 |
UW: 25.0% down · 7.5% · 30yr · 1.5% tax · 5.0% vac · 8.0% maint · 8.0% mgmt
Financing live
Cash to close
- Down payment
- $37,500
- Closing costs
- $4,500
- Reserves months
- —
- Total cash needed
- —
Loan-product check · same deal, 3 products live
Conventional
25% down · 7.5% · 30yr
- Down + closing
- —
- Monthly P&I
- —
- Monthly cashflow
- —
- DSCR
- —
- Eligible?
- —
Personal DTI + credit; lowest rate.
DSCR
20% down · 8.5% · 30yr
- Down + closing
- —
- Monthly P&I
- —
- Monthly cashflow
- —
- DSCR
- —
- Eligible?
- —
No personal income docs; deal must DSCR.
Hard money
10% down · 12.0% · 12mo
- Down + closing
- —
- Monthly P&I
- —
- Monthly cashflow
- —
- DSCR
- —
- Eligible?
- —
Short-term bridge; refi at stabilization.
Listing history 19 events
-
2026-06-23days on market $149,999 Active 126 DOM
-
2026-06-21days on market $149,999 Active 125 DOM
-
2026-06-18days on market $149,999 Active 122 DOM
-
2026-06-17days on market $149,999 Active 121 DOM
-
2026-06-16days on market $149,999 Active 120 DOM
-
2026-06-15days on market $149,999 Active 119 DOM
-
2026-06-14days on market $149,999 Active 117 DOM
-
2026-06-13days on market $149,999 Active 116 DOM
-
2026-06-10days on market $149,999 Active 114 DOM
-
2026-06-09days on market $149,999 Active 113 DOM
-
2026-06-08days on market $149,999 Active 112 DOM
-
2026-06-07days on market $149,999 Active 111 DOM
-
2026-06-05days on market $149,999 Active 108 DOM
-
2026-06-02days on market $149,999 Active 106 DOM
-
2026-06-01days on market $149,999 Active 105 DOM
-
2026-05-31days on market $149,999 Active 104 DOM
-
2026-05-30days on market $149,999 Active 103 DOM
-
2026-02-17$149,999 Active
-
2025-09-15soldstatus $90,000
ⓘ Source: listings_history table (triggers on properties + properties_extension) + one-shot
backfill from property_details.listing_events for pre-trigger history.
Tax reassessment forecast SC · Resets to sale price
- Current annual tax
- $721 · $60/mo
- Projected year-2 tax
- $855 · $71/mo
- Expected delta
- +$134/yr (+$11/mo · 18.7%)
ⓘ Screening estimate from a state-policy table — verify with the county assessor before closing.
Climate risk First Street
- Flood 1/10 Low FEMA zone X (unshaded) · 0% chance over 30 yrs
- Wildfire 4/10 Moderate
- Heat 6/10 Major 7 d/yr ≥105°F today · 17 d/yr by 30 yrs out
- Wind 2/10 Low 2% chance of damaging wind over 30 yrs
- Air quality 3/10 Moderate 3 unhealthy d/yr today · 3 by 30 yrs out
Nearby sold comps map
Loading sold comps map…
Walkable amenities ~0.75 mi
Loading nearby amenities…
Taxation est. · year 1
- Rental income
- $17,556
- − Mortgage interest
- −$8,402
- − Property taxes
- −$721
- − Insurance
- −$750
- − Repairs & maintenance
- −$1,404
- − Management
- −$1,404
- − Depreciation
- −$4,364
- Taxable income
- $511
- Est. tax owed @ 24.0%
- −$123
- After-tax cash flow
- $2,837/yr
For passive investors: Depreciation is non-cash, so a rental often shows a tax loss while cash-flowing — sheltering income. Rental losses are passive: they offset passive income freely, and up to $25,000/yr can offset ordinary (W-2) income if you actively participate and your MAGI is under $100k (phasing out to $0 by $150k); unused losses carry forward. On sale, claimed depreciation is recaptured at up to 25%, and gains may owe capital-gains tax (a 1031 exchange can defer both). Figures are a year-1 estimate at your 24.0% rate — not tax advice; consult a CPA.
Schools (NCES district)
- District
- Spartanburg 02
- NCES district ID
- 4503510
- Math proficiency
- 49% ▼ -7.00%
- Reading proficiency
- 56% ▲ 2.00%
- Median HH income
- $49,591
- Composite
- 44.79/100
- National rank
- #2742
- State rank
- #6 of 80 in SC
Livability — Mayo
- Score
- 64/100
- State rank
- #151
- US rank
- #14285
Category grades
Schools grade is shown separately in the Schools card above.
Census & demographics
- Census place
- Mayo, SC
- City population
- 347
- Population (ZIP)
- 8,720
Population outlook (Spartanburg County) Hauer SSP2
- Today (2025)
- 325,495 people
- By 2030
- 338,800 · +4.1%
- By 2040
- 363,471 · +11.7%
- By 2050
- 384,156 · +18.0%
- By 2075
- 430,137 · +32.1%
- By 2100
- 442,733 · +36.0%
Race, ethnicity, and origin ACS 2023
- Neighborhood character
- Predominantly White (81%)
- Race & ethnicity
- White 81% Hispanic / Latino 7% Two or more races 7% Black 6%
- Hispanic origin (detail)
- Mexican 2% Puerto Rican 2%
- Common ancestry
- Italian 2% Serbian 1%
- Foreign-born
- 4% · Canada, South Korea, Jamaica
- Languages at home
- 91% English-only · Spanish 6% Chinese 1% Other Asian/Pacific 1%
Political lean MEDSL · Spartanburg
- 2024 margin
- Solid R (+33.6) · D 32.6% · R 66.2% · Other 1.2%
- 2008→2024 swing
- -12.0pp toward R · 2008: -21.6pp · 2024: -33.6pp
- All cycles
- 2024: R+33.6 2020: R+27.3 2016: R+30.0 2012: R+23.1 2008: R+21.6
Not yet ingested
- Civics
- —
Market trends
- HPI YoY
- ▼ -26.81%
- Current HPI
- 263.1439
- Rent YoY
- —
- Metro
- —
- State GDP YoY
- ▲ 4.51%
- F500 in state
- 2
Industry mix (Fortune 500 HQ in SC)
| Industry | F500 HQs | Revenue |
|---|---|---|
| Packaging | 1 | $7B |
|
||
Price history
+66.7% since first listed2 events — show timeline
- 2026-02-17 Listed $149,999 SPMLS
- 2025-09-15 Sold (Public Records) $90,000 Public Records
Property tax history
+21.6%/yrLatest (2025): $721 · -57.5% YoY. Source: county tax records.
Cash-flow waterfall
monthlySold comps — $/sqft
last 12 mo · ≤1 miLoading sold comps…