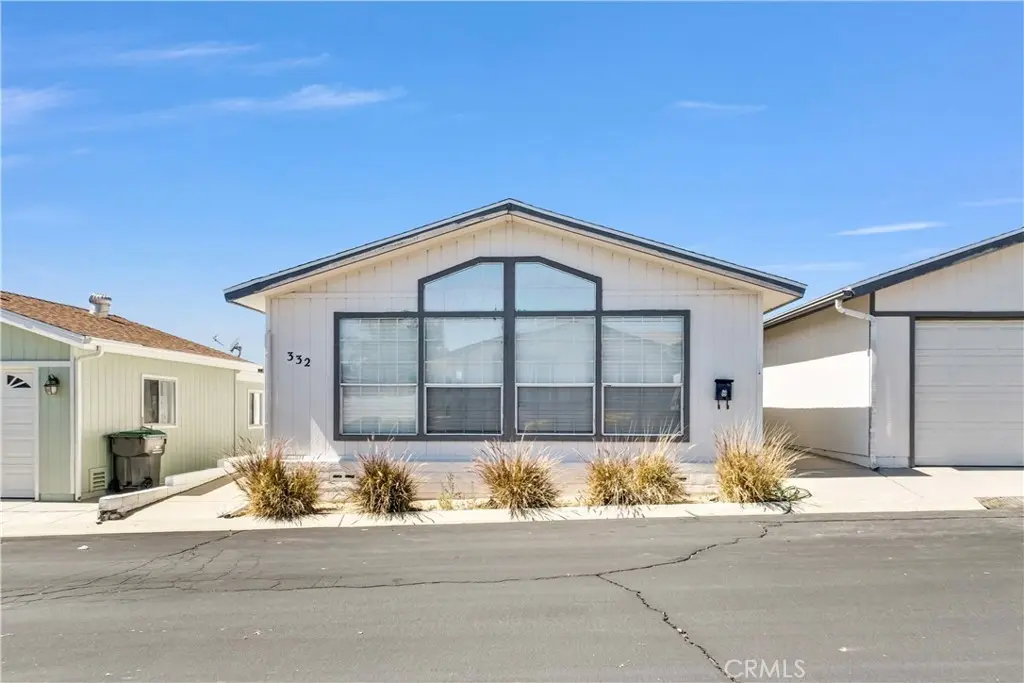
3800 W Wilson #332 · Banning, CA
Flood risk 1/10 · Minimal
- FEMA flood zone
- X (unshaded)
- Chance of flooding over 30 yrs
- 0.0%
- Est. flood insurance / yr
- $507 – $1,088
Fire risk 10/10 · Severe
- Est. fire insurance / yr
- $659 – $1,223
Heat risk 6/10 · Moderate
- Hot days now (above 100°F)
- 7 days/yr
- Hot days in 30 yrs
- 19 days/yr
Wind risk 1/10 · Minimal
- Chance of severe wind over 30 yrs
- —
Air-quality risk 8/10 · Major
- Unhealthy air days now
- 18 days/yr
- Unhealthy air days in 30 yrs
- 23 days/yr
Risk factors via First Street. Map © Google.
Why this score? — see what drove the B grade
The composite is a weighted blend of 9 inputs, each scored 0–100. Each bar is that input's sub-score; the figure is the points it added to the 100-point composite (weight × sub-score).
- Cash flow +30.0/30.0
- ARV discount +15.0/15.0
- DSCR +10.0/10.0
- 1% rule +9.1/10.0
- Rent growth +3.4/5.0
- Condition / age +2.5/5.0
- Livability +2.4/5.0
- Schools +2.0/10.0
- Appreciation +0.0/10.0
$155,000
🖨 Deal sheet 📄 Offer letter ✓ Due diligence
Listing remarks MLS
Welcome to this charming manufactured home located in the 55+ community of Mountain Springs. This home features 2 bedrooms and 2 bathrooms in 1,440 of living space. The home has been updated with beautiful wood floors and tile and a new oven in the kitchen. The second bathroom is handicapped accessible. There is a nice contained yard . The community has tennis courts, basketball courts and a pool lots of activities!!
Key facts
- Manufactured home
- Tennis courts
- Contained yard
Tags
Neighborhood map
What this means for you Summary
Snapshot
- This is a 2-bed/2.0-bath manufactured listed at $155k.
Deal economics
- At list price, monthly cash flow is $799 ($10k/yr) — positive.
- The deal already cash-flows at list — no discount required.
- Meets the 1% rule at list price ($2k rent vs $155k).
- Recommended offer: $146k (6.0% below list) — sets the bar for market timing.
- Cap rate 12.5% vs local median 3.0% in Banning — top-decile yield for the area; either an underpriced asset or a hidden risk that comps aren't pricing in. Stress-test before assuming the spread holds.
Location & tenants
- Location reads 48/100 on livability (#1,192 in CA) — a working-class tenant base; expect higher turnover. Strengths: housing B+; Watch: crime C-, schools F, amenities F.
- Banning Unified (suburban): math 15% / reading 25% proficiency, ranked #1,258 of 1,400 in CA (top 90%) — low school quality limits family demand, transient renter base, plan for 1-2y turnover; 76% free/reduced lunch — lower-income household profile, screen leases tightly.
- Market conditions: Rents rising (+3.6%/yr); 312 active listings in the ZIP; 2 comparable units currently listed for rent nearby; 9,195 units permitted in Riverside County in 2024 (1,512 in 5+ unit buildings).
- This rent runs 42% of the median local income ($63k/yr) — at the standard rent-burdened threshold; future hikes will face affordability resistance.
Forward outlook
- Local home prices are declining (-3.0%/yr); year-one equity from $1k of loan paydown is wiped out by about $5k of value loss. Plan a longer hold.
- Riverside County population projected at +22% by 2050 — long-run rental-demand tailwind backs the buy-and-hold thesis.
- At projected returns (-3.0% appreciation + 3.6% rent growth), your $43k cash investment doubles in ~6 years — after that, you're playing with house money.
Negotiation context
- It's been on market 85 days — a 6% lower offer ($146k) is reasonable based on typical stale-listing flexibility.
- 4 sale attempts since 9y ago with the ask held roughly flat each time — persistent listings suggest the price (not the market) is what's stuck; bring a comps-based counter.
- Current owner paid $44k; list at $155k implies a 248% gain — meaningful room to come down on a strong offer.
Risks & watch-outs
- Climate carrying-cost: severe wildfire risk; extreme-heat days projected 7→19/yr by 2055 (HVAC capex compounding) — expect insurance premiums to compound above CPI over the hold.
Questions for the listing agent
- It's been on market 85 days. Have you received any prior offers? Is the seller open to a 6% concession, seller financing, or rate buy-down credit?
- Why hasn't it sold? Are there any deal-killer items the seller is aware of (foundation, flood, title, zoning, code violations)?
- Is there a deadline driving the sale (1031 exchange, divorce, estate, relocation)? That informs how much negotiation room exists.
- Schools are F-rated, which usually means shorter tenancies and higher turnover. Who's the typical renter profile here, and what's been the actual vacancy rate?
- What's the average days-on-market for RENTAL listings here right now (not sales)? A rising rental-DOM trend means longer vacancies and softer asking-rent achievability than the comps imply.
- What's the recent tenant-quality profile in this submarket — average credit score on applications, eviction rate, late-payment / NSF rate, and stable-employment percentage? A property-management company in the area should have these aggregated.
- How much new for-sale + rental construction is in the pipeline within 1–3 miles? Heavy new supply typically softens prices + rents 12–24 months out; constrained supply supports both.
Investment metrics
- 1% rule
- 1.41% ✓
- Cap rate
- 12.48%
- Cash-on-cash
- 22.09%
- DSCR
- 1.98
- GRM
- 5.9
CMA / ARV
- ARV (median comp)
- $197,832
- List price
- $155,000
- Delta
- -21.65%
- Verdict
- UNDERPRICED
- Comps
- 20 within 1.0 mi
Show comp detail 12 sales within ~0.75 mi
| Address | Dist | Beds/Ba | Sqft | Sold | Price | $/sf | Match |
|---|---|---|---|---|---|---|---|
| 3800 W Wilson St #14 | 0.00mi | 2/2.0 | 1,440 (0%) | 2mo | $240,000 | $167 | 99 |
| 3800 W Wilson #157 | 0.00mi | 2/2.0 | 1,440 (0%) | 9mo | $261,000 | $181 | 93 |
| 3800 W Wilson St #394 | 0.16mi | 3/2.0 (+1) | 1,440 (0%) | 3mo | $117,250 | $81 | 86 |
| 3800 W Wilson St #256 | 0.00mi | 2/2.0 | 1,344 (-7%) | 8mo | $252,500 | $188 | 82 |
| 3800 W Wilson St #295 | 0.00mi | 2/2.0 | 1,536 (+7%) | 8mo | $250,000 | $163 | 82 |
| 3800 W Wilson #208 | 0.00mi | 3/2.0 (+1) | 1,344 (-7%) | 6mo | $130,000 | $97 | 79 |
| 3800 W Wilson St #17 | 0.00mi | 2/2.0 | 1,248 (-13%) | 1mo | $295,000 | $236 | 77 |
| 3800 W Wilson St #2 | 0.00mi | 2/2.0 | 1,248 (-13%) | 8mo | $265,000 | $212 | 71 |
| 3800 Wilson St #369 | 0.00mi | 3/2.0 (+1) | 1,634 (+14%) | 2mo | $130,000 | $80 | 71 |
| 4133 W WILSON #19 | 0.47mi | 2/2.0 | 1,440 (0%) | 9mo | $117,000 | $81 | 71 |
| 3800 W Wilson St #104 | 0.00mi | 3/2.0 (+1) | 1,228 (-15%) | 1mo | $129,999 | $106 | 70 |
| 3800 W Wilson #59 | 0.25mi | 2/2.0 | 1,248 (-13%) | 1mo | $222,000 | $178 | 66 |
Match score weights: distance 35% · size 25% · config 20% · recency 20%. Top-matched comps best support the ARV.
Projected returns pro-forma
-3.0% appreciation · 3.58% rent growth · sell at horizon
- IRR
- 15.4%
- Equity multiple
- 1.62×
- Total profit
- $26,987
- Equity at exit
- $23,111
- IRR
- 24.4%
- Equity multiple
- 3.17×
- Total profit
- $94,098
- Equity at exit
- $13,402
Cash invested: $43,400 (down + closing). Projections, not guarantees.
Landlord ↔ Tenant lean methodology
- Overall (STATE)
- 18 Strongly Tenant-Friendly
- State California
- 18 Strongly Tenant-Friendly · D+13
- County
- — inherits STATE
- City
- — inherits STATE
ZIP-level market 92220
- Rents YoY
- 3.6%
- Active inventory
- 312
- Price-to-rent
- 5.9×
Monthly cashflow live
- Estimated rent
- $2,181 medium interval (Pro) →
- Mortgage (P&I)
- −$813
- Tax from tax record
- −$47 /mo · $561/yr
- Insurance
- −$65
- HOA
- −$0
- Vacancy / Maint / Mgmt
- −$458
- Net cashflow
- $799
Break-even live
UW: 25.0% down · 7.5% · 30yr · 1.5% tax · 5.0% vac · 8.0% maint · 8.0% mgmt
Financing live
Cash to close
- Down payment
- $38,750
- Closing costs
- $4,650
- Reserves months
- —
- Total cash needed
- —
Loan-product check · same deal, 3 products live
Conventional
25% down · 7.5% · 30yr
- Down + closing
- —
- Monthly P&I
- —
- Monthly cashflow
- —
- DSCR
- —
- Eligible?
- —
Personal DTI + credit; lowest rate.
DSCR
20% down · 8.5% · 30yr
- Down + closing
- —
- Monthly P&I
- —
- Monthly cashflow
- —
- DSCR
- —
- Eligible?
- —
No personal income docs; deal must DSCR.
Hard money
10% down · 12.0% · 12mo
- Down + closing
- —
- Monthly P&I
- —
- Monthly cashflow
- —
- DSCR
- —
- Eligible?
- —
Short-term bridge; refi at stabilization.
Rent comps 2 comps
| Address | Beds | Baths | Sqft | Rent | $/sqft | DOM | Units | Dist |
|---|---|---|---|---|---|---|---|---|
| 1949 W Williams St Banning, CA | 3.0 | 2.0 | 1108 | $2,350 | $2.12 | 24d | 1 | 1.00mi |
| 228 Janan Ct Banning, CA | 2.0 | 1.0 | 1100 | $2,100 | $1.91 | 1d | 1 | 1.19mi |
Listing history 23 events
-
2026-06-18days on market $155,000 Active 85 DOM
-
2026-06-17days on market $155,000 Active 84 DOM
-
2026-06-16days on market $155,000 Active 83 DOM
-
2026-06-15days on market $155,000 Active 82 DOM
-
2026-06-13days on market $155,000 Active 80 DOM
-
2026-06-13days on market $155,000 Active 79 DOM
-
2026-06-09days on market $155,000 Active 76 DOM
-
2026-06-08days on market $155,000 Active 75 DOM
-
2026-06-07days on market $155,000 Active 74 DOM
-
2026-06-04days on market $155,000 Active 71 DOM
-
2026-06-03days on market $155,000 Active 70 DOM
-
2026-06-02days on market $155,000 Active 69 DOM
-
2026-06-01days on market $155,000 Active 68 DOM
-
2026-05-31days on market $155,000 Active 67 DOM
-
2026-05-12historical
-
2026-04-25$159,000 Active
-
2026-03-25$159,000 Active 421-char remark
Show marketing remark (421 chars)
Welcome to this charming manufactured home located in the 55+ community of Mountain Springs. This home features 2 bedrooms and 2 bathrooms in 1,440 of living space. The home has been updated with beautiful wood floors and tile and a new oven in the kitchen. The second bathroom is handicapped accessible. There is a nice contained yard . The community has tennis courts, basketball courts and a pool lots of activities!!
-
2018-12-20historical
-
2018-09-23price $65,000
-
2018-06-20$70,000 Active
-
2017-03-24status Pending Sale
-
2017-03-24soldstatus $44,500 Closed Sale
-
2017-01-31$49,000 Active
ⓘ Source: listings_history table (triggers on properties + properties_extension) + one-shot
backfill from property_details.listing_events for pre-trigger history.
Tax reassessment forecast CA · Resets to sale price
- Current annual tax
- $561 · $47/mo
- Projected year-2 tax
- $1,178 · $98/mo
- Expected delta
- +$617/yr (+$51/mo · 110.1%)
ⓘ Screening estimate from a state-policy table — verify with the county assessor before closing.
Climate risk First Street
- Flood 1/10 Low FEMA zone X (unshaded) · 0% chance over 30 yrs
- Wildfire 10/10 Extreme
- Heat 6/10 Major 7 d/yr ≥100°F today · 19 d/yr by 30 yrs out
- Wind 1/10 Low
- Air quality 8/10 Severe 18 unhealthy d/yr today · 23 by 30 yrs out
Nearby sold comps map
Loading sold comps map…
Walkable amenities ~0.75 mi
Loading nearby amenities…
Taxation est. · year 1
- Rental income
- $26,172
- − Mortgage interest
- −$8,682
- − Property taxes
- −$561
- − Insurance
- −$775
- − Repairs & maintenance
- −$2,094
- − Management
- −$2,094
- − Depreciation
- −$4,509
- Taxable income
- $7,458
- Est. tax owed @ 24.0%
- −$1,790
- After-tax cash flow
- $7,797/yr
For passive investors: Depreciation is non-cash, so a rental often shows a tax loss while cash-flowing — sheltering income. Rental losses are passive: they offset passive income freely, and up to $25,000/yr can offset ordinary (W-2) income if you actively participate and your MAGI is under $100k (phasing out to $0 by $150k); unused losses carry forward. On sale, claimed depreciation is recaptured at up to 25%, and gains may owe capital-gains tax (a 1031 exchange can defer both). Figures are a year-1 estimate at your 24.0% rate — not tax advice; consult a CPA.
Schools (NCES district)
- District
- Banning Unified
- NCES district ID
- 0603840
- Math proficiency
- 15% ▬ 0.00%
- Reading proficiency
- 25% ▼ -1.00%
- Median HH income
- $39,303
- Composite
- 20.12/100
- National rank
- #13850
- State rank
- #1258 of 1400 in CA
Livability — Banning
- Score
- 48/100
- State rank
- #1192
- US rank
- #26047
Category grades
Schools grade is shown separately in the Schools card above.
Census & demographics
- Census place
- Banning, CA
- County
- Riverside County · 2,287,001 people
- City population
- 33,755
- Metro
- Riverside-San Bernardino-Ontario, CA
- Population (ZIP)
- 33,755
- Household income
- $62,599
- Rent vs Own
- Severe rent burden
- 1146.0
Population outlook (Riverside County) Hauer SSP2
- Today (2025)
- 2,664,475 people
- By 2030
- 2,802,692 · +5.2%
- By 2040
- 3,050,904 · +14.5%
- By 2050
- 3,256,783 · +22.2%
- By 2075
- 3,655,058 · +37.2%
- By 2100
- 3,766,594 · +41.4%
Race, ethnicity, and origin ACS 2023
- Neighborhood character
- Diverse neighborhood (Simpson 0.64)
- Race & ethnicity
- Hispanic / Latino 48% White 35% Two or more races 21% Black 6% Asian 5% Native American 4%
- Hispanic origin (detail)
- Mexican 44%
- Common ancestry
- Italian 1% Romanian 1% Portuguese 1%
- Foreign-born
- 17% · Canada, South Korea, China
- Languages at home
- 65% English-only · Spanish 29% Tagalog/Filipino 1% Other Indo-European 1%
Political lean MEDSL · Riverside
- 2024 margin
- Toss-up / Even · D 48.0% · R 49.3% · Other 2.6%
- 2008→2024 swing
- -3.6pp toward R · 2008: 2.3pp · 2024: -1.3pp
- All cycles
- 2024: R+1.3 2020: D+8.0 2016: D+4.3 2012: R+0.4 2008: D+2.3
Not yet ingested
- Civics
- —
Market trends
- HPI YoY
- ▼ -343.32%
- Current HPI
- 342.4268
- Rent YoY
- ▲ 3.58%
- Metro
- Riverside-San Bernardino-Ontario, CA
- State GDP YoY
- ▲ 3.21%
- F500 in state
- 116
Industry mix (Fortune 500 HQ in CA)
| Industry | F500 HQs | Revenue |
|---|---|---|
| Technology | 27 | $1,492B |
|
||
| Financial Services | 3 | $174B |
|
||
| Retail | 3 | $44B |
|
||
| Insurance | 3 | $26B |
|
||
| Media / Entertainment | 2 | $115B |
|
||
| Pharmaceuticals / Biotech | 2 | $62B |
|
||
Price history
+224.5% since first listed9 events — show timeline
- 2026-05-12 Listing Removed — CRMLS
- 2026-04-25 Listed $159,000 CRMLS
- 2026-03-25 Listed $159,000 CRMLS
- 2018-12-20 Listing Removed — CRMLS
- 2018-09-23 Price Changed $65,000 CRMLS
- 2018-06-20 Listed $70,000 CRMLS
- 2017-03-24 Pending — CRMLS
- 2017-03-24 Sold (MLS) $44,500 CRMLS
- 2017-01-31 Listed $49,000 CRMLS
Property tax history
+3.7%/yrLatest (2025): $561 · +1.7% YoY. Source: county tax records.
Cash-flow waterfall
monthlySold comps — $/sqft
last 12 mo · ≤1 miLoading sold comps…