 Multi-family
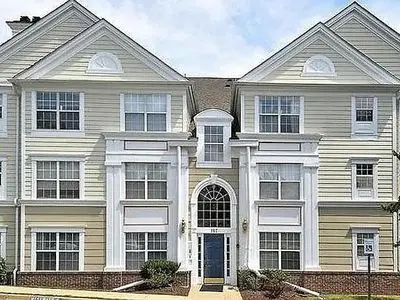
102 Kendrick Pl · Gaithersburg, MD
Flood risk 1/10 · Minimal
- FEMA flood zone
- X (unshaded)
- Chance of flooding over 30 yrs
- 0.0%
- Est. flood insurance / yr
- $507 – $1,088
Fire risk 3/10 · Minor
- Est. fire insurance / yr
- $755 – $1,403
Heat risk 6/10 · Moderate
- Hot days now (above 102°F)
- 7 days/yr
- Hot days in 30 yrs
- 16 days/yr
Wind risk 4/10 · Minor
- Chance of severe wind over 30 yrs
- 11.0%
Air-quality risk 3/10 · Minor
- Unhealthy air days now
- 2 days/yr
- Unhealthy air days in 30 yrs
- 3 days/yr
Risk factors via First Street. Map © Google.
Why this score? — see what drove the B- grade
The composite is a weighted blend of 9 inputs, each scored 0–100. Each bar is that input's sub-score; the figure is the points it added to the 100-point composite (weight × sub-score).
- Cash flow +29.5/30.0
- DSCR +10.0/10.0
- 1% rule +8.3/10.0
- ARV discount +7.5/15.0
- Livability +4.0/5.0
- Schools +3.6/10.0
- Condition / age +2.5/5.0
- Rent growth +2.4/5.0
- Appreciation +0.0/10.0
$479,900
🖨 Deal sheet (PDF) 📄 Offer letter ✓ Due diligence
Multi-family units
County records classify this as Multi-Family (5+ Unit). Listing-text estimate: 1 unit. estimate disagrees with records
5+ unit building — per-unit beds/baths from public records are typically unavailable; the breakdown below (if shown) is an estimate from the listing text.
Listing remarks
Lovely Penthouse, 3rd floor condo, 3 bedroom, 3 bathrooms in the Kentlands, updated appliances and amazing amenities, Pools, gym, clubhouse, kids activities, and more. Walk to shopping and restaurants, bus to metro that takes you to Washington, D. C.
Key facts
- Updated appliances
- Clubhouse
- Gym
Tags
Property features AI
Exterior
- Home design: Built in 1992
- Construction: Living area approximately 1668
- Exterior features: Located in the Kentlands neighborhood
Neighborhood map
What this means for you Summary
Snapshot
- This is a 3-bed/3.0-bath multifamily listed at $480k.
Deal economics
- At list price, monthly cash flow is $2k ($21k/yr) — positive.
- The deal already cash-flows at list — no discount required.
- Meets the 1% rule at list price ($6k rent vs $480k).
- Recommended offer: $473k (1.5% below list) — sets the bar for market timing.
- Cap rate 10.6% vs local median 3.0% in Gaithersburg — top-decile yield for the area; either an underpriced asset or a hidden risk that comps aren't pricing in. Stress-test before assuming the spread holds.
Location & tenants
- Location reads 79/100 on livability (#59 in MD, #2,228 nationally) — a middle-class / working-renter tenant base. Strengths: commute A+, employment A+, housing A+; Watch: cost of living F.
- Montgomery County Public Schools (suburban): math 27% / reading 45% proficiency, ranked #3 of 24 in MD (top 12%) — families likely to look elsewhere, expect single-tenant / working-renter base with shorter leases.
- Zoned schools: Rachel Carson Elementary (math 41% / reading 49%, grade D-, #62 of 860 statewide, top 8%, 698 students, 27% FRL); Lakelands Park Middle (math 21% / reading 51%, grade F, #40 of 225 statewide, top 18%, 1,042 students, 34% FRL); Quince Orchard High (math 47% / reading 62%, grade C-, #91 of 222 statewide, top 42%, 2,154 students, 41% FRL).
- Market conditions: Rents soft (-0.3%/yr); 221 active listings in the ZIP; 26 comparable units currently listed for rent nearby; rentals lingering (median 46d on market — plan ~5-8 weeks vacancy on turnover, expect pricing pressure); 58% of comp listings sitting > 30 days — soft ceiling on asking rent; high-income renter base; 3,880 units permitted in Montgomery County in 2024 (2,054 in 5+ unit buildings).
- At $6,375/mo this rent would consume 53% of the median local household income ($144k/yr) (locally 1384% of renters already pay >50% of income on rent) — very limited rent-growth headroom before tenants either downsize or default.
Forward outlook
- Local home prices are declining (-3.0%/yr); year-one equity from $3k of loan paydown is wiped out by about $14k of value loss. Plan a longer hold.
- Montgomery County population projected at +27% by 2050 — long-run rental-demand tailwind backs the buy-and-hold thesis.
Negotiation context
- It's been on market 27 days — a 2% lower offer ($473k) is reasonable based on typical stale-listing flexibility.
- 2 sale attempts since 18y ago with the ask held roughly flat each time — persistent listings suggest the price (not the market) is what's stuck; bring a comps-based counter.
Risks & watch-outs
- Climate carrying-cost: extreme-heat days projected 7→16/yr by 2055 (HVAC capex compounding) — expect insurance premiums to compound above CPI over the hold.
Questions for the listing agent
- Is there a deadline driving the sale (1031 exchange, divorce, estate, relocation)? That informs how much negotiation room exists.
- What's the average days-on-market for RENTAL listings here right now (not sales)? A rising rental-DOM trend means longer vacancies and softer asking-rent achievability than the comps imply.
- What's the recent tenant-quality profile in this submarket — average credit score on applications, eviction rate, late-payment / NSF rate, and stable-employment percentage? A property-management company in the area should have these aggregated.
- How much new apartment / multifamily construction is in the pipeline within 1–3 miles? Heavy new supply (>2% of stock underway) typically softens rents 12–24 months out; light construction supports rent growth.
Investment metrics
- 1% rule
- 1.33% ✓
- Cap rate
- 10.59%
- Cash-on-cash
- 15.36%
- DSCR
- 1.68
- GRM
- 6.3
CMA / ARV
No comps found within radius.
Projected returns pro-forma
-3.0% appreciation · 0.0% rent growth · sell at horizon
- IRR
- 2.6%
- Equity multiple
- 1.10×
- Total profit
- $13,182
- Equity at exit
- $71,555
- IRR
- 9.1%
- Equity multiple
- 1.60×
- Total profit
- $80,710
- Equity at exit
- $41,493
Cash invested: $134,372 (down + closing). Projections, not guarantees.
Landlord ↔ Tenant lean methodology
- Overall (STATE)
- 27 Tenant-Leaning
- State Maryland
- 27 Tenant-Leaning · D+14
- County
- — inherits STATE
- City
- — inherits STATE
ZIP-level market 20878
- Rents YoY
- -0.3%
- Active inventory
- 221
- Price-to-rent
- 12.5×
Monthly cashflow live
- Estimated rent
- $6,375 high interval (Pro) →
- Mortgage (P&I)
- −$2,517
- Tax est. 1.5%
- −$600 /mo · $7,198/yr
- Insurance
- −$200
- HOA
- −$0
- Lot rent
- −$0
- Vacancy / Maint / Mgmt
- −$1,339
- Net cashflow
- $1,720
Break-even live
Sensitivity live
| Price | -10% $2,051 | -5% $1,886 | +0% $1,720 | +5% $1,554 | +10% $1,388 |
|---|---|---|---|---|---|
| Rent | -10% $1,216 | -5% $1,468 | +0% $1,720 | +5% $1,972 | +10% $2,223 |
| Rate | -1.0pp $1,961 | -0.5pp $1,842 | base $1,720 | +0.5pp $1,595 | +1.0pp $1,469 |
2-unit breakdown (identical units grouped — click to expand)
| Units | Beds | Baths | Est. rent |
|---|---|---|---|
| 2× units | 3 | 3 | $6,376 |
| #1 | 3 | 3 | $3,188 |
| #2 | 3 | 3 | $3,188 |
| Total (2 units) | $6,375 | ||
UW: 25.0% down · 7.5% · 30yr · 1.5% tax · 5.0% vac · 8.0% maint · 8.0% mgmt
Financing live
Cash to close
- Down payment
- $119,975
- Closing costs
- $14,397
- Reserves months
- —
- Total cash needed
- —
Loan-product check · same deal, 3 products live
Conventional
25% down · 7.5% · 30yr
- Down + closing
- —
- Monthly P&I
- —
- Monthly cashflow
- —
- DSCR
- —
- Eligible?
- —
Personal DTI + credit; lowest rate.
DSCR
20% down · 8.5% · 30yr
- Down + closing
- —
- Monthly P&I
- —
- Monthly cashflow
- —
- DSCR
- —
- Eligible?
- —
No personal income docs; deal must DSCR.
Hard money
10% down · 12.0% · 12mo
- Down + closing
- —
- Monthly P&I
- —
- Monthly cashflow
- —
- DSCR
- —
- Eligible?
- —
Short-term bridge; refi at stabilization.
Rent comps 26 comps
| Address | Beds | Baths | Sqft | Rent | $/sqft | DOM | Units | Dist |
|---|---|---|---|---|---|---|---|---|
| 916 Beacon Square Ct Gaithersburg, MD | 1.0–2.0 | 1.0–2.0 | 886 | $3,295 | $3.72 | 0d | 10 | 0.15mi |
| 112 Longpoint Way Gaithersburg, MD | 3.0 | 4.0 | 2116 | $3,500 | $1.65 | 7d | 1 | 0.15mi |
| 217 Booth St Gaithersburg, MD | 2.0 | 2.0 | 1275 | $3,857 | $3.03 | 7d | 1 | 0.33mi |
| 26 Timber Rock Rd Gaithersburg, MD | 3.0 | 3.5 | 1930 | $2,950 | $1.53 | 16d | 1 | 0.46mi |
| 501 Main St Gaithersburg, MD | 1.0–3.0 | 1.0–2.0 | 1132 | $3,959 | $3.50 | 1d | 12 | 0.56mi |
| 313 Cross Green St Unit 313B Gaithersburg, MD | 3.0 | 2.5 | 2248 | $3,500 | $1.56 | 46d | 1 | 0.66mi |
| 898 Bayridge Dr Gaithersburg, MD | 3.0 | 3.5 | 1930 | $2,600 | $1.35 | 26d | 1 | 0.67mi |
| 12141 Suffolk Ter Gaithersburg, MD | 3.0 | 2.0 | 1097 | $3,200 | $2.92 | 46d | 1 | 0.70mi |
| 13 Fenceline Dr Gaithersburg, MD | 4.0 | 3.5 | 1540 | $2,940 | $1.91 | 46d | 1 | 1.02mi |
| 16 Mateus Way Gaithersburg, MD | 3.0 | 2.5 | 1800 | $2,600 | $1.44 | 46d | 1 | 1.06mi |
| 35 Napa Valley Rd Gaithersburg, MD | 3.0 | 2.5 | 1800 | $3,000 | $1.67 | 46d | 1 | 1.09mi |
| 12 Sebastiani Blvd Gaithersburg, MD | 3.0 | 3.5 | 1320 | $2,750 | $2.08 | 46d | 1 | 1.15mi |
| 786 Quince Orchard Blvd #202 Gaithersburg, MD | 2.0 | 2.0 | 1110 | $2,200 | $1.98 | 46d | 1 | 1.32mi |
| 12310 Quince Valley Dr North Potomac, MD | 3.0 | 2.5 | 1800 | $2,700 | $1.50 | 24d | 1 | 1.34mi |
| 201 High Gables Dr #105 Gaithersburg, MD | 2.0 | 2.0 | 1456 | $2,995 | $2.06 | 46d | 1 | 1.34mi |
| 734 Quince Orchard Blvd #201 Gaithersburg, MD | 2.0 | 2.0 | 1126 | $2,000 | $1.78 | 46d | 1 | 1.35mi |
| 708 Suffield Dr Gaithersburg, MD | 3.0 | 2.5 | 1720 | $2,899 | $1.69 | 26d | 1 | 1.36mi |
| 704 Suffield Dr Gaithersburg, MD | 3.0 | 2.5 | 1720 | $2,700 | $1.57 | 26d | 1 | 1.37mi |
| 408 Fleece Flower Dr Gaithersburg, MD | 3.0 | 2.5 | 1720 | $2,500 | $1.45 | 46d | 1 | 1.38mi |
| 722 Quince Orchard Blvd Apt 201 Gaithersburg, MD | 2.0 | 2.0 | 1126 | $1,895 | $1.68 | 46d | 1 | 1.41mi |
| 310 Fleece Flower Dr Gaithersburg, MD | 3.0 | 2.5 | 1320 | $3,000 | $2.27 | 20d | 1 | 1.41mi |
| 111 Timberbrook Ln #304 Gaithersburg, MD | 3.0 | 2.5 | 1771 | $2,700 | $1.52 | 46d | 1 | 1.42mi |
| 724 Quince Orchard Blvd Apt 202 Gaithersburg, MD | 2.0 | 2.0 | 1110 | $2,200 | $1.98 | 46d | 1 | 1.43mi |
| 109 Timberbrook Ln #301 Gaithersburg, MD | 2.0 | 2.0 | 1771 | $2,500 | $1.41 | 26d | 1 | 1.44mi |
| 105 Timberbrook Ln #102 Gaithersburg, MD | 2.0 | 2.0 | 1177 | $2,250 | $1.91 | 46d | 1 | 1.46mi |
| 12310 Sweetbough Ct #85 North Potomac, MD | 3.0 | 1.5 | 1179 | $2,500 | $2.12 | 46d | 1 | 1.50mi |
Listing history 17 events
-
2026-06-22days on market $479,900 Active 27 DOM
-
2026-06-21days on market $479,900 Active 26 DOM
-
2026-06-18days on market $479,900 Active 23 DOM
-
2026-06-17days on market $479,900 Active 22 DOM
-
2026-06-16days on market $479,900 Active 21 DOM
-
2026-06-15days on market $479,900 Active 20 DOM
-
2026-06-13days on market $479,900 Active 18 DOM
-
2026-06-09days on market $479,900 Active 14 DOM
-
2026-06-08days on market $479,900 Active 13 DOM
-
2026-06-07days on market $479,900 Active 12 DOM
-
2026-06-03days on market $479,900 Active 8 DOM
-
2026-06-02days on market $479,900 Active 7 DOM
-
2026-06-01days on market $479,900 Active 6 DOM
-
2026-05-31days on market $479,900 Active 5 DOM
-
2026-05-26$479,900 Active
-
2008-10-09historical
-
2008-09-13
ⓘ Source: listings_history table (triggers on properties + properties_extension) + one-shot
backfill from property_details.listing_events for pre-trigger history.
Climate risk First Street
- Flood 1/10 Low FEMA zone X (unshaded) · 0% chance over 30 yrs
- Wildfire 3/10 Moderate
- Heat 6/10 Major 7 d/yr ≥102°F today · 16 d/yr by 30 yrs out
- Wind 4/10 Moderate 11% chance of damaging wind over 30 yrs
- Air quality 3/10 Moderate 2 unhealthy d/yr today · 3 by 30 yrs out
Nearby sold comps map
Loading sold comps map…
Walkable amenities ~0.75 mi
Loading nearby amenities…
Taxation est. · year 1
- Rental income
- $76,500
- − Mortgage interest
- −$26,882
- − Property taxes
- −$7,198
- − Insurance
- −$2,400
- − Repairs & maintenance
- −$6,120
- − Management
- −$6,120
- − Depreciation
- −$13,961
- Taxable income
- $13,819
- Est. tax owed @ 24.0%
- −$3,317
- After-tax cash flow
- $17,321/yr
For passive investors: Depreciation is non-cash, so a rental often shows a tax loss while cash-flowing — sheltering income. Rental losses are passive: they offset passive income freely, and up to $25,000/yr can offset ordinary (W-2) income if you actively participate and your MAGI is under $100k (phasing out to $0 by $150k); unused losses carry forward. On sale, claimed depreciation is recaptured at up to 25%, and gains may owe capital-gains tax (a 1031 exchange can defer both). Figures are a year-1 estimate at your 24.0% rate — not tax advice; consult a CPA.
Schools (NCES district)
- District
- Montgomery County Public Schools
- NCES district ID
- 2400480
- Math proficiency
- 27% ▼ -21.00%
- Reading proficiency
- 45% ▼ -10.00%
- Median HH income
- $97,191
- Composite
- 35.62/100
- National rank
- #4889
- State rank
- #3 of 24 in MD
Livability — Gaithersburg
- Score
- 79/100
- State rank
- #59
- US rank
- #2228
Category grades
Schools grade is shown separately in the Schools card above.
Census & demographics
- Census place
- Gaithersburg, MD
- County
- Montgomery County · 961,106 people
- City population
- 129,925
- Metro
- Washington-Arlington-Alexandria, DC-VA-MD-WV
- Population (ZIP)
- 66,115
- Household income
- $144,313
- Rent vs Own
- Severe rent burden
- 1384.0
Population outlook (Montgomery County) Hauer SSP2
- Today (2025)
- 1,173,231 people
- By 2030
- 1,237,402 · +5.5%
- By 2040
- 1,365,115 · +16.4%
- By 2050
- 1,491,592 · +27.1%
- By 2075
- 1,803,893 · +53.8%
- By 2100
- 2,035,619 · +73.5%
Race, ethnicity, and origin ACS 2023
- Neighborhood character
- Highly diverse neighborhood (Simpson 0.70)
- Race & ethnicity
- White 45% Asian 26% Hispanic / Latino 14% Black 10% Two or more races 9%
- Hispanic origin (detail)
- Common ancestry
- Romanian 3% Scotch-Irish 3% Lithuanian 2%
- Foreign-born
- 36% · Canada, China, South Korea
- Languages at home
- 55% English-only · Spanish 11% Other Indo-European 10% Chinese 9%
Political lean MEDSL · Montgomery
- 2024 margin
- Solid D (+53.3) · D 75.2% · R 21.9% · Other 2.9%
- 2008→2024 swing
- +8.7pp toward D · 2008: 44.6pp · 2024: 53.3pp
- All cycles
- 2024: D+53.3 2020: D+59.6 2016: D+55.5 2012: D+43.4 2008: D+44.6
Not yet ingested
- Civics
- —
Market trends
- HPI YoY
- ▼ -411.81%
- Current HPI
- 263.4335
- Rent YoY
- ▼ -0.26%
- Metro
- Washington-Arlington-Alexandria, DC-VA-MD-WV
- State GDP YoY
- ▲ 2.97%
- F500 in state
- 12
Industry mix (Fortune 500 HQ in MD)
| Industry | F500 HQs | Revenue |
|---|---|---|
| Aerospace / Defense | 1 | $71B |
|
||
| Utilities | 1 | $25B |
|
||
| Hotels | 1 | $24B |
|
||
| Consumer Goods | 1 | $7B |
|
||
| Real Estate | 1 | $6B |
|
||
| Chemicals | 1 | $2B |
|
||
Price history
3 events — show timeline
- 2026-05-26 Listed $479,900 FSBO.com
- 2008-10-09 Delisted — MRIS
- 2008-09-13 Listed — MRIS
Cash-flow waterfall
monthlySold comps — $/sqft
last 12 mo · ≤1 miLoading sold comps…