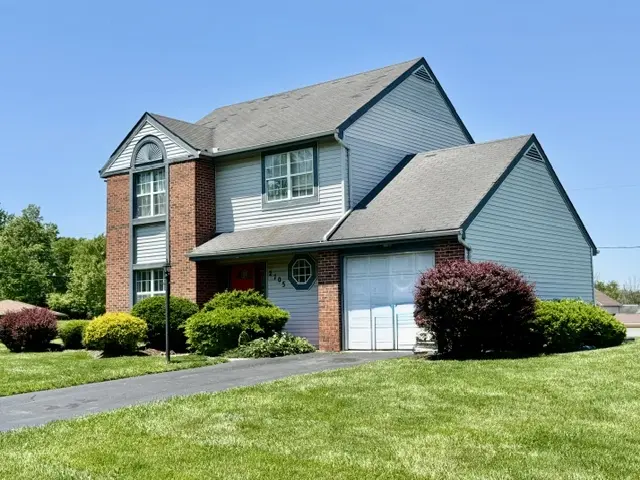
2705 Nicholas Rd · Dayton, OH
Flood risk 1/10 · Minimal
- FEMA flood zone
- X (unshaded)
- Chance of flooding over 30 yrs
- 0.0%
- Est. flood insurance / yr
- $507 – $1,088
Fire risk 1/10 · Minimal
- Est. fire insurance / yr
- $713 – $1,323
Heat risk 4/10 · Minor
- Hot days now (above 102°F)
- 7 days/yr
- Hot days in 30 yrs
- 19 days/yr
Wind risk 2/10 · Minimal
- Chance of severe wind over 30 yrs
- 1.0%
Air-quality risk 3/10 · Minor
- Unhealthy air days now
- 3 days/yr
- Unhealthy air days in 30 yrs
- 5 days/yr
Risk factors via First Street. Map © Google.
Why this score? — see what drove the B- grade
The composite is a weighted blend of 9 inputs, each scored 0–100. Each bar is that input's sub-score; the figure is the points it added to the 100-point composite (weight × sub-score).
- Cash flow +26.4/30.0
- ARV discount +15.0/15.0
- DSCR +9.0/10.0
- 1% rule +7.1/10.0
- Rent growth +3.5/5.0
- Livability +3.2/5.0
- Condition / age +2.5/5.0
- Schools +1.3/10.0
- Appreciation +0.0/10.0
$99,900
🖨 Deal sheet 📄 Offer letter ✓ Due diligence
Listing remarks
This Madden Hills soft contemporary is ready for a refresh making it ideal for the budget minded buyer looking for location, space and a simple value add opportunity. Built in 1988, the layout remains relevant offering volume ceilings, lots of windows, spacious rooms and nearly 1,500 sqft of well-planned living space. Highlights include a ceramic foyer, convenient half bath, open living room, connective formal dining room and an island kitchen with Honey Oak cabinets. Just off the kitchen is a light friendly flex space offering soaring ceilings, a large porthole window and atrium doors to a private grilling patio and open backyard just in time for Summer fun. Consider use as breakfast room,
Key facts
- Open living room
- Ceramic foyer
- Island kitchen
Tags
Property features AI
Finance
- Financial info: Offered for sale
Exterior
- Parking: Attached one-car garage
- Utilities: Natural gas available; Public water; Sewer available (storm sewer)
- Home design: Two-story home; Brick and vinyl siding exterior; Slab foundation
- Construction: Brick and vinyl siding construction
- Exterior features: Patio; Residential lot (approx. 0.33 acre, dimensions 104 x 140)
Interior
- Kitchen: Kitchen (main level, approx. 9 x 9)
- Bedrooms: Three bedrooms on the second level (approx. 11 x 10, 9 x 10, and 12 x 12)
- Bathrooms: One full bathroom; One half bathroom; One main-level bathroom
- Heating & cooling: Forced air heating (natural gas); Central air conditioning
- Interior features: Cathedral ceilings; Kitchen island; High-speed internet
- Laundry & utility: Gas water heater
Neighborhood map
What this means for you Summary
Snapshot
- This is a 3-bed/1.5-bath single-family listed at $100k.
Deal economics
- At list price, monthly cash flow is $260 ($3k/yr) — positive.
- The deal already cash-flows at list — no discount required.
- Meets the 1% rule at list price ($1k rent vs $100k).
- Cap rate 9.4% vs local median 7.4% in Dayton — meaningfully above typical; check what's discounted (condition, days-on-market, listing class) to confirm the premium yield is real.
Location & tenants
- Location reads 65/100 on livability (#716 in OH) — a middle-class / working-renter tenant base. Strengths: cost of living A+, housing A+, health & safety A; Watch: schools C-, amenities C-, crime F.
- Dayton City (urban): math 12% / reading 21% proficiency, ranked #641 of 656 in OH (top 98%) — low school quality limits family demand, transient renter base, plan for 1-2y turnover; 74% free/reduced lunch — lower-income household profile, screen leases tightly.
- Market conditions: Rents rising fast (+4.1%/yr); 135 active listings in the ZIP; 12 comparable units currently listed for rent nearby; rentals at typical pace (median 14d on market — plan ~3-4 weeks tenant-placement turnaround); lower-income renter base — watch delinquency; 907 units permitted in Montgomery County in 2024 (416 in 5+ unit buildings).
- This rent runs 39% of the median local income ($37k/yr) — at the standard rent-burdened threshold; future hikes will face affordability resistance.
Forward outlook
- Local home prices are declining (-3.0%/yr); year-one equity from $691 of loan paydown is wiped out by about $3k of value loss. Plan a longer hold.
- Montgomery County population projected at -10% by 2050 — secular population decline; favor cash flow + early exit over multi-decade hold.
- At projected returns (-3.0% appreciation + 4.1% rent growth), your $28k cash investment doubles in ~9 years — after that, you're playing with house money.
Negotiation context
- Only 2 days on market — expect competitive offers; lowballing is unlikely to land.
- Current owner paid $66k; list at $100k implies a 51% gain — meaningful room to come down on a strong offer.
Questions for the listing agent
- Is there a deadline driving the sale (1031 exchange, divorce, estate, relocation)? That informs how much negotiation room exists.
- Crime grade is F in this area — have there been break-ins, vandalism, or insurance claims at this property in the last 3 years? What carrier currently insures it and at what premium?
- What's the average days-on-market for RENTAL listings here right now (not sales)? A rising rental-DOM trend means longer vacancies and softer asking-rent achievability than the comps imply.
- What's the recent tenant-quality profile in this submarket — average credit score on applications, eviction rate, late-payment / NSF rate, and stable-employment percentage? A property-management company in the area should have these aggregated.
- How much new for-sale + rental construction is in the pipeline within 1–3 miles? Heavy new supply typically softens prices + rents 12–24 months out; constrained supply supports both.
Investment metrics
- 1% rule
- 1.21% ✓
- Cap rate
- 9.41%
- Cash-on-cash
- 11.15%
- DSCR
- 1.50
- GRM
- 6.9
CMA / ARV
- ARV (on-the-fly)
- $174,876
- Comps found
- 12
Show comp detail 12 sales within ~0.75 mi
| Address | Dist | Beds/Ba | Sqft | Sold | Price | $/sf | Match |
|---|---|---|---|---|---|---|---|
| 1214 Glennelle Dr | 0.19mi | 3/2.5 | 1,508 (+2%) | 2mo | $178,000 | $118 | 82 |
| 1116 Glennelle Dr | 0.28mi | 3/2.5 | 1,508 (+2%) | 1mo | $180,000 | $119 | 79 |
| 1200 Glennelle Dr | 0.20mi | 3/2.5 | 1,508 (+2%) | 5mo | $178,000 | $118 | 79 |
| 1051 Bunche Dr | 0.35mi | 3/2.5 | 1,508 (+2%) | 1mo | $176,900 | $117 | 76 |
| 1039 Bunche Dr | 0.38mi | 3/2.5 | 1,508 (+2%) | 1mo | $176,900 | $117 | 75 |
| 1208 Glennelle Dr | 0.19mi | 3/2.0 | 1,355 (-9%) | 6mo | $170,000 | $125 | 70 |
| 1126 Glennelle Dr | 0.27mi | 3/2.0 | 1,355 (-9%) | 5mo | $171,900 | $127 | 67 |
| 1045 Bunche Dr | 0.36mi | 3/2.0 | 1,355 (-9%) | 2mo | $171,900 | $127 | 65 |
| 2844 Sage Ave | 0.37mi | 3/1.0 | 1,317 (-11%) | 1mo | $90,000 | $68 | 62 |
| 632 Ethel Ave | 0.75mi | 3/1.5 | 1,568 (+6%) | 6mo | $74,000 | $47 | 51 |
| 1315 Clement Ave | 0.57mi | 4/2.0 (+1) | 1,344 (-9%) | 2mo | $110,000 | $82 | 50 |
| 755 Mount Clair Ave | 0.66mi | 4/2.0 (+1) | 1,438 (-3%) | 10mo | $87,000 | $61 | 49 |
Match score weights: distance 35% · size 25% · config 20% · recency 20%. Top-matched comps best support the ARV.
Projected returns pro-forma
-3.0% appreciation · 4.06% rent growth · sell at horizon
- IRR
- 1.6%
- Equity multiple
- 1.06×
- Total profit
- $1,681
- Equity at exit
- $14,895
- IRR
- 12.2%
- Equity multiple
- 2.01×
- Total profit
- $28,312
- Equity at exit
- $8,638
Cash invested: $27,972 (down + closing). Projections, not guarantees.
Landlord ↔ Tenant lean methodology
- Overall (STATE)
- 73 Landlord-Friendly
- State Ohio
- 73 Landlord-Friendly · R+6
- County
- — inherits STATE
- City
- — inherits STATE
ZIP-level market 45417
- Home prices YoY
- -32.3%
- Rents YoY
- 4.1%
- Active inventory
- 135
- Price-to-rent
- 6.9×
Monthly cashflow live
- Estimated rent
- $1,208 high interval (Pro) →
- Mortgage (P&I)
- −$524
- Tax from tax record
- −$129 /mo · $1,547/yr
- Insurance
- −$42
- HOA
- −$0
- Vacancy / Maint / Mgmt
- −$254
- Net cashflow
- $260
Break-even live
UW: 25.0% down · 7.5% · 30yr · 1.5% tax · 5.0% vac · 8.0% maint · 8.0% mgmt
Financing live
Cash to close
- Down payment
- $24,975
- Closing costs
- $2,997
- Reserves months
- —
- Total cash needed
- —
Loan-product check · same deal, 3 products live
Conventional
25% down · 7.5% · 30yr
- Down + closing
- —
- Monthly P&I
- —
- Monthly cashflow
- —
- DSCR
- —
- Eligible?
- —
Personal DTI + credit; lowest rate.
DSCR
20% down · 8.5% · 30yr
- Down + closing
- —
- Monthly P&I
- —
- Monthly cashflow
- —
- DSCR
- —
- Eligible?
- —
No personal income docs; deal must DSCR.
Hard money
10% down · 12.0% · 12mo
- Down + closing
- —
- Monthly P&I
- —
- Monthly cashflow
- —
- DSCR
- —
- Eligible?
- —
Short-term bridge; refi at stabilization.
Rent comps 12 comps
| Address | Beds | Baths | Sqft | Rent | $/sqft | DOM | Units | Dist |
|---|---|---|---|---|---|---|---|---|
| 1272 Clement Ave Dayton, OH | 3.0 | 1.0 | 1025 | $1,350 | $1.32 | 2d | 1 | 0.58mi |
| 2240 Lakeview Ave Dayton, OH | 3.0 | 1.0 | 1056 | $1,025 | $0.97 | 43d | 1 | 0.73mi |
| 623 Clifton Dr Apt B Dayton, OH | 2.0 | 1.0 | 1200 | $1,174 | $0.98 | 3d | 1 | 0.74mi |
| 623 Clifton Dr Apt A Dayton, OH | 2.0 | 1.0 | 1200 | $1,200 | $1.00 | 2d | 1 | 0.74mi |
| 3939 Nicholas Rd Dayton, OH | 3.0 | 1.0 | 912 | $1,200 | $1.32 | 43d | 1 | 0.75mi |
| 3964 Nicholas Rd Dayton, OH | 3.0 | 1.0 | 912 | $1,000 | $1.10 | 3d | 1 | 0.83mi |
| 652 Dennison Ave Dayton, OH | 2.0 | 2.0 | 988 | $1,095 | $1.11 | 21d | 1 | 0.91mi |
| 1515 W Stewart St Dayton, OH | 2.0 | 1.0 | 925 | $1,000 | $1.08 | 43d | 1 | 1.07mi |
| 47 Leroy St Dayton, OH | 3.0 | 1.0 | 1456 | $1,200 | $0.82 | 43d | 1 | 1.42mi |
| 70 Gramont Ave Dayton, OH | 3.0 | 1.5 | 966 | $1,300 | $1.35 | 2d | 1 | 1.43mi |
| 42 S Mathison St Dayton, OH | 3.0 | 1.0 | 1300 | $1,220 | $0.94 | 3d | 1 | 1.44mi |
| 40 S Mathison St Dayton, OH | 3.0 | 1.0 | 1300 | $1,200 | $0.92 | 14d | 1 | 1.44mi |
Listing history 2 events
-
2026-06-07remarks 699-char remark
-
2026-06-07$99,900 Pending 2 DOM
ⓘ Source: listings_history table (triggers on properties + properties_extension) + one-shot
backfill from property_details.listing_events for pre-trigger history.
Tax reassessment forecast OH · Partial reset (capped growth)
- Current annual tax
- $1,547 · $129/mo
- Projected year-2 tax
- $1,553 · $129/mo
- Expected delta
- +$6/yr ($0/mo · 0.4%)
ⓘ Screening estimate from a state-policy table — verify with the county assessor before closing.
Climate risk First Street
- Flood 1/10 Low FEMA zone X (unshaded) · 0% chance over 30 yrs
- Wildfire 1/10 Low
- Heat 4/10 Moderate 7 d/yr ≥102°F today · 19 d/yr by 30 yrs out
- Wind 2/10 Low 100% chance of damaging wind over 30 yrs
- Air quality 3/10 Moderate 3 unhealthy d/yr today · 5 by 30 yrs out
Nearby sold comps map
Loading sold comps map…
Walkable amenities ~0.75 mi
Loading nearby amenities…
Taxation est. · year 1
- Rental income
- $14,495
- − Mortgage interest
- −$5,596
- − Property taxes
- −$1,547
- − Insurance
- −$500
- − Repairs & maintenance
- −$1,160
- − Management
- −$1,160
- − Depreciation
- −$2,906
- Taxable income
- $1,627
- Est. tax owed @ 24.0%
- −$390
- After-tax cash flow
- $2,727/yr
For passive investors: Depreciation is non-cash, so a rental often shows a tax loss while cash-flowing — sheltering income. Rental losses are passive: they offset passive income freely, and up to $25,000/yr can offset ordinary (W-2) income if you actively participate and your MAGI is under $100k (phasing out to $0 by $150k); unused losses carry forward. On sale, claimed depreciation is recaptured at up to 25%, and gains may owe capital-gains tax (a 1031 exchange can defer both). Figures are a year-1 estimate at your 24.0% rate — not tax advice; consult a CPA.
Schools (NCES district)
- District
- Dayton City
- NCES district ID
- 3904384
- Math proficiency
- 12% ▼ -12.00%
- Reading proficiency
- 21% ▼ -11.00%
- Median HH income
- $28,688
- Composite
- 12.94/100
- National rank
- #9579
- State rank
- #641 of 656 in OH
Livability — Dayton
- Score
- 65/100
- State rank
- #716
- US rank
- #12895
Category grades
Schools grade is shown separately in the Schools card above.
Census & demographics
- Census place
- Dayton, OH
- County
- Montgomery County · 459,541 people
- City population
- 164,387
- Metro
- Dayton-Kettering, OH
- Population (ZIP)
- 28,186
- Household income
- $36,945
- Rent vs Own
- Severe rent burden
- 1822.0
Population outlook (Montgomery County) Hauer SSP2
- Today (2025)
- 523,241 people
- By 2030
- 514,948 · -1.6%
- By 2040
- 493,378 · -5.7%
- By 2050
- 469,639 · -10.2%
- By 2075
- 418,360 · -20.0%
- By 2100
- 353,315 · -32.5%
Race, ethnicity, and origin ACS 2023
- Neighborhood character
- Predominantly Black (71%)
- Race & ethnicity
- Black 71% White 20% Two or more races 8% Hispanic / Latino 3%
- Common ancestry
- Romanian 0%
- Foreign-born
- 3% · Canada
- Languages at home
- 96% English-only · Spanish 2% French/Haitian/Cajun 1%
Political lean MEDSL · Montgomery
- 2024 margin
- Toss-up / Even · D 49.8% · R 49.3%
- 2008→2024 swing
- -5.8pp toward R · 2008: 6.2pp · 2024: 0.5pp
- All cycles
- 2024: D+0.5 2020: D+2.2 2016: R+1.2 2012: D+3.1 2008: D+6.2
Not yet ingested
- Civics
- —
Market trends
- HPI YoY
- ▼ -92.43%
- Current HPI
- 193.4175
- Rent YoY
- ▲ 4.06%
- Metro
- Dayton-Kettering, OH
- State GDP YoY
- ▲ 1.98%
- F500 in state
- 48
Industry mix (Fortune 500 HQ in OH)
| Industry | F500 HQs | Revenue |
|---|---|---|
| Insurance | 3 | $145B |
|
||
| Industrial Machinery | 3 | $49B |
|
||
| Financial Services | 3 | $24B |
|
||
| Consumer Goods | 2 | $93B |
|
||
| Aerospace / Defense | 2 | $47B |
|
||
| Utilities | 2 | $33B |
|
||
Price history
+50.6% since first listed3 events — show timeline
- 2026-06-07 Pending — Dayton MLS
- 2026-06-05 Listed $99,900 Dayton MLS
- 1990-01-05 Sold (Public Records) $66,350 Public Records
Property tax history
-0.2%/yrLatest (2025): $1,547 · -0.2% YoY. Source: county tax records.
Cash-flow waterfall
monthlySold comps — $/sqft
last 12 mo · ≤1 miLoading sold comps…