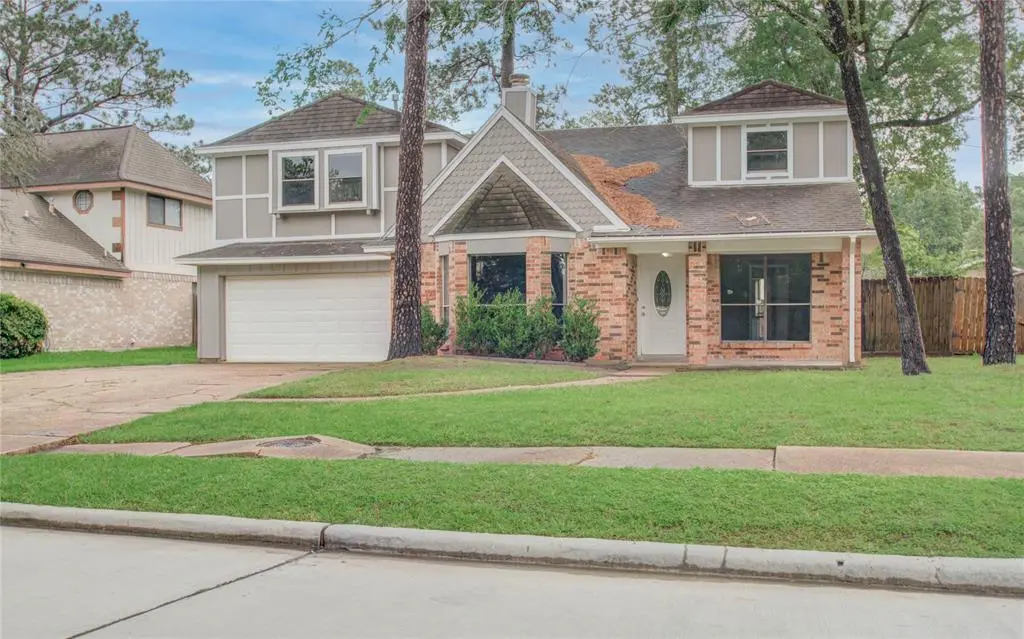
19614 Pine Cluster Ln · Atascocita, TX
Flood risk 1/10 · Minimal
- FEMA flood zone
- X (unshaded)
- Chance of flooding over 30 yrs
- 0.0%
- Est. flood insurance / yr
- $507 – $1,088
Fire risk 1/10 · Minimal
- Est. fire insurance / yr
- $1,222 – $2,270
Heat risk 9/10 · Severe
- Hot days now (above 110°F)
- 7 days/yr
- Hot days in 30 yrs
- 23 days/yr
Wind risk 9/10 · Severe
- Chance of severe wind over 30 yrs
- 99.0%
Air-quality risk 2/10 · Minimal
- Unhealthy air days now
- 2 days/yr
- Unhealthy air days in 30 yrs
- 2 days/yr
Risk factors via First Street. Map © Google.
Why this score? — see what drove the B- grade
The composite is a weighted blend of 9 inputs, each scored 0–100. Each bar is that input's sub-score; the figure is the points it added to the 100-point composite (weight × sub-score).
- Cash flow +25.1/30.0
- ARV discount +9.0/15.0
- DSCR +8.2/10.0
- 1% rule +7.7/10.0
- Appreciation +4.5/10.0
- Schools +3.9/10.0
- Livability +3.5/5.0
- Rent growth +2.5/5.0
- Condition / age +2.5/5.0
$250,000
🖨 Deal sheet 📄 Offer letter ✓ Due diligence
Listing remarks
NEVER FLOODED PER SELLER. Exceptionally WELL MAINTAINED and MOVE-IN READY with NO CARPET throughout the home. SOARING vaulted CEILINGS in the living room and abundant NATURAL LIGHT create an open, inviting feel from the moment you walk in. UPDATED KITCHEN featuring GRANITE COUNTERTOPS, and ample cabinet space with great flow into the main living areas. Functional floor plan offering MULTIPLE LIVING AREAS, FLEX SPACES, and generously sized bedrooms to accommodate a variety of lifestyles. Updated bathrooms and durable flooring throughout add to the home's modern appeal. Spacious BACKYARD with DECK provides the perfect setting for entertaining or relaxing outdoors. Located in a quiet, family-f
Key facts
- Never flooded
- No carpet
- Natural light
Tags
Neighborhood map
What this means for you Summary
Snapshot
- This is a 4-bed/2.5-bath single-family listed at $250k.
Deal economics
- At list price, monthly cash flow is $553 ($7k/yr) — positive.
- The deal already cash-flows at list — no discount required.
- Meets the 1% rule at list price ($3k rent vs $250k).
- Cap rate 8.9% vs local median 4.1% in Atascocita — top-decile yield for the area; either an underpriced asset or a hidden risk that comps aren't pricing in. Stress-test before assuming the spread holds.
Location & tenants
- Location reads 70/100 on livability (#346 in TX) — a middle-class / working-renter tenant base. Strengths: employment A+, cost of living A+, housing A+; Watch: amenities F, commute F, health & safety F.
- Humble ISD (urban): math 38% / reading 44% proficiency, ranked #262 of 826 in TX (top 32%) — families likely to look elsewhere, expect single-tenant / working-renter base with shorter leases.
- Market conditions: Rents flat; 669 active listings in the ZIP; 8 comparable units currently listed for rent nearby; rentals at typical pace (median 22d on market — plan ~3-4 weeks tenant-placement turnaround); high-income renter base; 29,883 units permitted in Harris County in 2024 (8,621 in 5+ unit buildings).
- This rent runs 31% of the median local income ($122k/yr) — at the standard rent-burdened threshold; future hikes will face affordability resistance.
Forward outlook
- Local home prices are declining (-0.9%/yr); year-one equity from $2k of loan paydown is wiped out by about $2k of value loss. Plan a longer hold.
- Harris County population projected at +47% by 2050 — long-run rental-demand tailwind backs the buy-and-hold thesis.
Negotiation context
- Only 9 days on market — expect competitive offers; lowballing is unlikely to land.
- 9 sale attempts since 9y ago; this cycle's ask has dropped $19k (7%) from the opening price — seller is motivated, your offer sets the floor, not the list.
Risks & watch-outs
- Climate carrying-cost: severe wind risk, 99% chance of damaging wind over 30y; extreme-heat days projected 7→23/yr by 2055 (HVAC capex compounding) — expect insurance premiums to compound above CPI over the hold.
Questions for the listing agent
- What does the HOA fee cover, when was the last increase, and are there any pending special assessments or reserve-fund shortfalls?
- Is there a deadline driving the sale (1031 exchange, divorce, estate, relocation)? That informs how much negotiation room exists.
- What's the average days-on-market for RENTAL listings here right now (not sales)? A rising rental-DOM trend means longer vacancies and softer asking-rent achievability than the comps imply.
- What's the recent tenant-quality profile in this submarket — average credit score on applications, eviction rate, late-payment / NSF rate, and stable-employment percentage? A property-management company in the area should have these aggregated.
- How much new for-sale + rental construction is in the pipeline within 1–3 miles? Heavy new supply typically softens prices + rents 12–24 months out; constrained supply supports both.
Investment metrics
- 1% rule
- 1.27% ✓
- Cap rate
- 8.95%
- Cash-on-cash
- 9.48%
- DSCR
- 1.42
- GRM
- 6.5
CMA / ARV
- ARV (median comp)
- $258,565
- List price
- $250,000
- Delta
- 0.17%
- Verdict
- FAIR
- Comps
- 20 within 1.0 mi
Show comp detail 12 sales within ~0.75 mi
| Address | Dist | Beds/Ba | Sqft | Sold | Price | $/sf | Match |
|---|---|---|---|---|---|---|---|
| 19311 Boulder Bay Ln | 0.33mi | 4/2.5 | 2,262 (-6%) | 3mo | $295,000 | $130 | 72 |
| 19119 Sprintwood Ct | 0.45mi | 4/2.5 | 2,487 (+4%) | 4mo | $299,900 | $121 | 70 |
| 20015 Bunker Bend Ct | 0.51mi | 3/2.5 (-1) | 2,452 (+2%) | 3mo | $299,900 | $122 | 66 |
| 19503 Atascocita Shores Dr | 0.25mi | 3/2.0 (-1) | 2,165 (-10%) | 2mo | $255,000 | $118 | 63 |
| 8911 Pine Shores Dr | 0.47mi | 4/2.5 | 2,624 (+9%) | 6mo | $299,000 | $114 | 57 |
| 7722 12th Fairway Ln | 0.62mi | 4/2.5 | 2,573 (+7%) | 4mo | $294,900 | $115 | 56 |
| 7803 Hurst Forest Dr | 0.64mi | 4/2.5 | 2,609 (+8%) | 5mo | $252,000 | $97 | 51 |
| 19142 Sprinters Dr | 0.38mi | 3/2.5 (-1) | 2,756 (+15%) | 2mo | $315,000 | $114 | 51 |
| 8615 Mile Run Rd | 0.60mi | 3/2.0 (-1) | 2,220 (-8%) | 5mo | $300,000 | $135 | 48 |
| 18906 Tranquility Dr | 0.70mi | 4/3.0 | 2,709 (+13%) | 2mo | $429,000 | $158 | 43 |
| 19110 Player Park Dr | 0.67mi | 3/2.5 (-1) | 2,667 (+11%) | 6mo | $299,900 | $112 | 41 |
| 7911 Palmer Place Ln | 0.54mi | 3/3.5 (-1) | 2,723 (+13%) | 5mo | $309,900 | $114 | 40 |
Match score weights: distance 35% · size 25% · config 20% · recency 20%. Top-matched comps best support the ARV.
Projected returns pro-forma
-0.95% appreciation · 0.09% rent growth · sell at horizon
- IRR
- 2.7%
- Equity multiple
- 1.12×
- Total profit
- $8,050
- Equity at exit
- $60,897
- IRR
- 6.4%
- Equity multiple
- 1.56×
- Total profit
- $38,961
- Equity at exit
- $64,417
Cash invested: $70,000 (down + closing). Projections, not guarantees.
Landlord ↔ Tenant lean methodology
- Overall (STATE)
- 87 Strongly Landlord-Friendly
- State Texas
- 87 Strongly Landlord-Friendly · R+5
- County
- — inherits STATE
- City
- — inherits STATE
ZIP-level market 77346
- Home prices YoY
- -0.4%
- Rents YoY
- 0.1%
- Active inventory
- 669
- Price-to-rent
- 6.5×
Monthly cashflow live
- Estimated rent
- $3,186 high interval (Pro) →
- Mortgage (P&I)
- −$1,311
- Tax from tax record
- −$494 /mo · $5,923/yr
- Insurance
- −$104
- HOA
- −$55
- Vacancy / Maint / Mgmt
- −$669
- Net cashflow
- $553
Break-even live
UW: 25.0% down · 7.5% · 30yr · 1.5% tax · 5.0% vac · 8.0% maint · 8.0% mgmt
Financing live
Cash to close
- Down payment
- $62,500
- Closing costs
- $7,500
- Reserves months
- —
- Total cash needed
- —
Loan-product check · same deal, 3 products live
Conventional
25% down · 7.5% · 30yr
- Down + closing
- —
- Monthly P&I
- —
- Monthly cashflow
- —
- DSCR
- —
- Eligible?
- —
Personal DTI + credit; lowest rate.
DSCR
20% down · 8.5% · 30yr
- Down + closing
- —
- Monthly P&I
- —
- Monthly cashflow
- —
- DSCR
- —
- Eligible?
- —
No personal income docs; deal must DSCR.
Hard money
10% down · 12.0% · 12mo
- Down + closing
- —
- Monthly P&I
- —
- Monthly cashflow
- —
- DSCR
- —
- Eligible?
- —
Short-term bridge; refi at stabilization.
Rent comps 8 comps
| Address | Beds | Baths | Sqft | Rent | $/sqft | DOM | Units | Dist |
|---|---|---|---|---|---|---|---|---|
| 19603 Fairway Island Dr Humble, TX | 5.0 | 2.5 | 3329 | $6,500 | $1.95 | 24d | 1 | 0.33mi |
| 19119 Sprintwood Ct Humble, TX | 4.0 | 2.5 | 2487 | $2,425 | $0.98 | 22d | 1 | 0.46mi |
| 18718 Walden Forest Dr Humble, TX | 4.0 | 2.0 | 2224 | $2,600 | $1.17 | 2d | 1 | 0.80mi |
| 20502 Spoonwood Dr Humble, TX | 3.0 | 2.0 | 2302 | $1,975 | $0.86 | 43d | 1 | 1.02mi |
| 7403 Misty Morning Dr Humble, TX | 3.0 | 2.0 | 1628 | $1,900 | $1.17 | 17d | 1 | 1.18mi |
| 7515 Echo Pines Dr Humble, TX | 3.0 | 2.0 | 1655 | $1,850 | $1.12 | 43d | 1 | 1.31mi |
| 7131 Maple Walk Dr Humble, TX | 3.0 | 2.0 | 1808 | $1,895 | $1.05 | 5d | 1 | 1.41mi |
| 18431 Sailfish Cove Dr Humble, TX | 4.0 | 3.0 | 3264 | $2,445 | $0.75 | 10d | 1 | 1.49mi |
HOA detail
- Monthly dues
- $55 · $660/yr
Listing history 46 events
-
2026-06-18days on market $250,000 Pending 9 DOM
-
2026-06-17days on market $250,000 Pending 8 DOM
-
2026-06-16days on market $250,000 Pending 7 DOM
-
2026-06-15days on market $250,000 Pending 6 DOM
-
2026-06-13statusdays on market $250,000 Pending 4 DOM
-
2026-06-13days on market $250,000 Active 3 DOM
-
2026-06-10remarks 699-char remark
-
2026-06-10pricestatusdays on market $250,000 Active 1 DOM
-
2026-05-09historical
-
2026-04-18price $259,000
-
2026-04-14price $270,000
-
2026-03-21status Active
-
2026-03-21status Active
-
2026-03-20historical
-
2026-03-17status Pending
-
2026-03-15price $275,000
-
2026-03-13price $269,000
-
2026-02-23price $273,000
-
2026-02-10price $278,000
-
2026-01-19price $283,000
-
2025-12-23price $288,000
-
2025-12-22$269,000 Active
-
2025-09-03historical
-
2025-08-06status Active
-
2025-07-25status Pending
-
2025-06-19status Active
-
2025-04-13status Pending
-
2025-04-04status Option Pending
-
2025-02-24price $265,000
-
2025-01-11price $250,000
-
2024-12-13$305,000 Active
-
2024-12-10historical
-
2023-07-10soldstatus
-
2023-06-29soldstatus Sold
-
2023-05-30status Pending
-
2023-05-23status Option Pending
-
2023-04-23$300,000 Active
-
2022-05-17soldstatus
-
2017-06-07soldstatus Sold
-
2017-04-20status Pending
-
2017-04-12status Active
-
2017-04-03status Pending
-
2017-03-15price $158,650
-
2017-01-10$167,000 Active
-
2002-08-13soldstatus
-
1995-08-03soldstatus
ⓘ Source: listings_history table (triggers on properties + properties_extension) + one-shot
backfill from property_details.listing_events for pre-trigger history.
Tax reassessment forecast TX · Resets to sale price
- Current annual tax
- $5,923 · $494/mo
- Projected year-2 tax
- $5,923 · $494/mo
- Expected delta
- $0/yr ($0/mo · 0.0%)
ⓘ Screening estimate from a state-policy table — verify with the county assessor before closing.
Climate risk First Street
- Flood 1/10 Low FEMA zone X (unshaded) · 0% chance over 30 yrs
- Wildfire 1/10 Low
- Heat 9/10 Extreme 7 d/yr ≥110°F today · 23 d/yr by 30 yrs out
- Wind 9/10 Extreme 99% chance of damaging wind over 30 yrs
- Air quality 2/10 Low 2 unhealthy d/yr today · 2 by 30 yrs out
Nearby sold comps map
Loading sold comps map…
Walkable amenities ~0.75 mi
Loading nearby amenities…
Taxation est. · year 1
- Rental income
- $38,232
- − Mortgage interest
- −$14,004
- − Property taxes
- −$5,923
- − Insurance
- −$1,250
- − Repairs & maintenance
- −$3,059
- − Management
- −$3,059
- − HOA
- −$660
- − Depreciation
- −$7,273
- Taxable income
- $3,005
- Est. tax owed @ 24.0%
- −$721
- After-tax cash flow
- $5,916/yr
For passive investors: Depreciation is non-cash, so a rental often shows a tax loss while cash-flowing — sheltering income. Rental losses are passive: they offset passive income freely, and up to $25,000/yr can offset ordinary (W-2) income if you actively participate and your MAGI is under $100k (phasing out to $0 by $150k); unused losses carry forward. On sale, claimed depreciation is recaptured at up to 25%, and gains may owe capital-gains tax (a 1031 exchange can defer both). Figures are a year-1 estimate at your 24.0% rate — not tax advice; consult a CPA.
Schools (NCES district)
- District
- Humble ISD
- NCES district ID
- 4823910
- Math proficiency
- 38% ▼ -11.00%
- Reading proficiency
- 44% ▼ -7.00%
- Median HH income
- $83,946
- Composite
- 38.55/100
- National rank
- #4171
- State rank
- #262 of 826 in TX
Livability — Atascocita
- Score
- 70/100
- State rank
- #346
- US rank
- #7586
Category grades
Schools grade is shown separately in the Schools card above.
Census & demographics
- Census place
- Atascocita, TX
- County
- Harris County · 4,702,590 people
- City population
- 79,538
- Metro
- Houston-The Woodlands-Sugar Land, TX
- Population (ZIP)
- 79,538
- Household income
- $122,241
- Rent vs Own
- Severe rent burden
- 1072.0
Population outlook (Harris County) Hauer SSP2
- Today (2025)
- 5,571,493 people
- By 2030
- 6,089,821 · +9.3%
- By 2040
- 7,142,806 · +28.2%
- By 2050
- 8,185,864 · +46.9%
- By 2075
- 10,574,329 · +89.8%
- By 2100
- 12,109,958 · +117.4%
Race, ethnicity, and origin ACS 2023
- Neighborhood character
- Diverse neighborhood (Simpson 0.70)
- Race & ethnicity
- White 42% Hispanic / Latino 28% Black 21% Two or more races 18% Asian 4%
- Hispanic origin (detail)
- Mexican 20% Puerto Rican 2%
- Common ancestry
- Lithuanian 4% Slovak 1% Italian 1%
- Foreign-born
- 10% · Canada, Vietnam, China
- Languages at home
- 78% English-only · Spanish 17% Other Indo-European 1% German/W. Germanic 1%
Political lean MEDSL · Harris
- 2024 margin
- Lean D (+5.5) · D 52.0% · R 46.4% · Other 1.6%
- 2008→2024 swing
- +3.9pp toward D · 2008: 1.6pp · 2024: 5.5pp
- All cycles
- 2024: D+5.5 2020: D+13.3 2016: D+12.4 2012: D+0.1 2008: D+1.6
Not yet ingested
- Civics
- —
Market trends
- HPI YoY
- ▼ -0.95%
- Current HPI
- 218.0478
- Rent YoY
- ▲ 0.09%
- Metro
- Houston-The Woodlands-Sugar Land, TX
- State GDP YoY
- ▲ 3.95%
- F500 in state
- 110
Industry mix (Fortune 500 HQ in TX)
| Industry | F500 HQs | Revenue |
|---|---|---|
| Energy | 16 | $1,198B |
|
||
| Technology | 5 | $198B |
|
||
| Engineering / Construction | 4 | $72B |
|
||
| Energy Services | 3 | $60B |
|
||
| Utilities | 3 | $41B |
|
||
| Healthcare | 2 | $330B |
|
||
Price history
+55.1% since first listed38 events — show timeline
- 2026-05-09 Listing Removed — HARMLS
- 2026-04-18 Price Changed $259,000 HARMLS
- 2026-04-14 Price Changed $270,000 HARMLS
- 2026-03-21 Relisted — HARMLS
- 2026-03-21 Relisted — HARMLS
- 2026-03-20 Listing Removed — HARMLS
- 2026-03-17 Pending — HARMLS
- 2026-03-15 Price Changed $275,000 HARMLS
- 2026-03-13 Price Changed $269,000 HARMLS
- 2026-02-23 Price Changed $273,000 HARMLS
- 2026-02-10 Price Changed $278,000 HARMLS
- 2026-01-19 Price Changed $283,000 HARMLS
- 2025-12-23 Price Changed $288,000 HARMLS
- 2025-12-22 Listed $269,000 HARMLS
- 2025-09-03 Listing Removed — HARMLS
- 2025-08-06 Relisted — HARMLS
- 2025-07-25 Pending — HARMLS
- 2025-06-19 Relisted — HARMLS
- 2025-04-13 Pending — HARMLS
- 2025-04-04 Pending — HARMLS
- 2025-02-24 Price Changed $265,000 HARMLS
- 2025-01-11 Price Changed $250,000 HARMLS
- 2024-12-13 Listed $305,000 HARMLS
- 2024-12-10 Coming Soon — HARMLS
- 2023-07-10 Sold (Public Records) — Public Records
- 2023-06-29 Sold (MLS) — HARMLS
- 2023-05-30 Pending — HARMLS
- 2023-05-23 Pending — HARMLS
- 2023-04-23 Listed $300,000 HARMLS
- 2022-05-17 Sold (Public Records) — Public Records
- 2017-06-07 Sold (MLS) — HARMLS
- 2017-04-20 Pending — HARMLS
- 2017-04-12 Relisted — HARMLS
- 2017-04-03 Pending — HARMLS
- 2017-03-15 Price Changed $158,650 HARMLS
- 2017-01-10 Listed $167,000 HARMLS
- 2002-08-13 Sold (Public Records) — Public Records
- 1995-08-03 Sold (Public Records) — Public Records
Property tax history
+7.7%/yrLatest (2025): $5,923 · +2.8% YoY. Source: county tax records.
Cash-flow waterfall
monthlySold comps — $/sqft
last 12 mo · ≤1 miLoading sold comps…