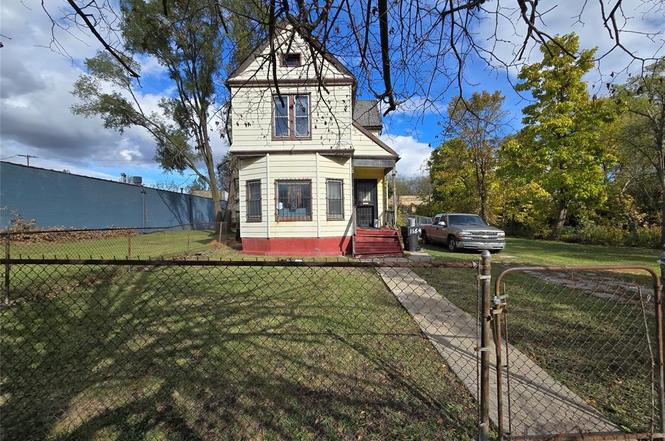
1164 Meldrum St · Detroit, MI
Flood risk 1/10 · Minimal
- FEMA flood zone
- X (unshaded)
- Chance of flooding over 30 yrs
- 0.0%
- Est. flood insurance / yr
- $473 – $860
Fire risk 1/10 · Minimal
- Est. fire insurance / yr
- $784 – $1,456
Heat risk 3/10 · Minor
- Hot days now (above 96°F)
- 7 days/yr
- Hot days in 30 yrs
- 15 days/yr
Wind risk 2/10 · Minimal
- Chance of severe wind over 30 yrs
- —
Air-quality risk 4/10 · Minor
- Unhealthy air days now
- 6 days/yr
- Unhealthy air days in 30 yrs
- 6 days/yr
Risk factors via First Street. Map © Google.
Why this score? — see what drove the D+ grade
The composite is a weighted blend of 9 inputs, each scored 0–100. Each bar is that input's sub-score; the figure is the points it added to the 100-point composite (weight × sub-score).
- Cash flow +15.0/30.0
- ARV discount +7.5/15.0
- 1% rule +5.0/10.0
- DSCR +5.0/10.0
- Livability +3.7/5.0
- Appreciation +3.6/10.0
- Rent growth +3.4/5.0
- Condition / age +2.5/5.0
- Schools +1.3/10.0
$25,000
🖨 Deal sheet 📄 Offer letter ✓ Due diligence
Listing remarks MLS
Great investment opportunity in Island view! Vacant 3-bed, 1-bath 2-story home on an extra lot with solid upside. Property needs a full renovation roof replacement, electrical updates, driveway and garage repairs but offers strong potential in a rapidly improving area. House sell AS IS
Key facts
- Extra lot
- Electrical updates
- Full renovation
Tags
Neighborhood map
What this means for you Summary
Snapshot
- This is a 3-bed/1.5-bath single-family listed at $25k.
Deal economics
- At list price, monthly cash flow is $1k ($16k/yr) — positive.
- The deal already cash-flows at list — no discount required.
- Meets the 1% rule at list price ($2k rent vs $25k).
- Cap rate 72.1% vs local median 10.2% in Detroit — top-decile yield for the area; either an underpriced asset or a hidden risk that comps aren't pricing in. Stress-test before assuming the spread holds.
Location & tenants
- Location reads 73/100 on livability (#218 in MI) — a middle-class / working-renter tenant base. Strengths: amenities A+, commute A+, cost of living A+; Watch: schools F, crime F, employment F.
- Detroit Public Schools Community District (urban): math 10% / reading 24% proficiency, ranked #499 of 540 in MI (top 92%) — low school quality limits family demand, transient renter base, plan for 1-2y turnover; 90% free/reduced lunch — lower-income household profile, screen leases tightly.
- Market conditions: Rents rising (+3.5%/yr); 244 active listings in the ZIP; 27 comparable units currently listed for rent nearby; rentals at typical pace (median 25d on market — plan ~3-4 weeks tenant-placement turnaround); 48% of comp listings sitting > 30 days — soft ceiling on asking rent; 2,639 units permitted in Wayne County in 2024 (1,216 in 5+ unit buildings).
- At $1,953/mo this rent would consume 49% of the median local household income ($48k/yr) (locally 2017% of renters already pay >50% of income on rent) — very limited rent-growth headroom before tenants either downsize or default.
Forward outlook
- Local home prices are declining (-2.8%/yr); year-one equity from $173 of loan paydown is wiped out by about $698 of value loss. Plan a longer hold.
- Wayne County population projected at -17% by 2050 — secular population decline; favor cash flow + early exit over multi-decade hold.
- At projected returns (-2.8% appreciation + 3.5% rent growth), your $7k cash investment doubles in ~1 year — after that, you're playing with house money.
Negotiation context
- Only 8 days on market — expect competitive offers; lowballing is unlikely to land.
- 2 sale attempts with the ask held roughly flat each time — persistent listings suggest the price (not the market) is what's stuck; bring a comps-based counter.
- Current owner paid $10k; list at $25k implies a 150% gain — meaningful room to come down on a strong offer.
Risks & watch-outs
- Watch-outs: built in 1900 — expect roof / HVAC / electrical / plumbing capex.
Questions for the listing agent
- Built in 1900 — when were the roof, HVAC, electrical panel, plumbing, and water heater last replaced?
- Is there a deadline driving the sale (1031 exchange, divorce, estate, relocation)? That informs how much negotiation room exists.
- Schools are F-rated, which usually means shorter tenancies and higher turnover. Who's the typical renter profile here, and what's been the actual vacancy rate?
- Crime grade is F in this area — have there been break-ins, vandalism, or insurance claims at this property in the last 3 years? What carrier currently insures it and at what premium?
- The area grade is low — what's the realistic commute time and amenity access for the typical tenant pool here? Any planned neighborhood developments (good or bad) we should know about?
- What's the average days-on-market for RENTAL listings here right now (not sales)? A rising rental-DOM trend means longer vacancies and softer asking-rent achievability than the comps imply.
- What's the recent tenant-quality profile in this submarket — average credit score on applications, eviction rate, late-payment / NSF rate, and stable-employment percentage? A property-management company in the area should have these aggregated.
- How much new for-sale + rental construction is in the pipeline within 1–3 miles? Heavy new supply typically softens prices + rents 12–24 months out; constrained supply supports both.
Investment metrics
- 1% rule
- 7.81% ✓
- Cap rate
- 72.06%
- Cash-on-cash
- 234.86%
- DSCR
- 11.45
- GRM
- 1.1
CMA / ARV
- ARV (on-the-fly)
- $209,748
- Comps found
- 11
Show comp detail 11 sales within ~0.75 mi
| Address | Dist | Beds/Ba | Sqft | Sold | Price | $/sf | Match |
|---|---|---|---|---|---|---|---|
| 1400 Helen St | 0.33mi | 3/2.0 | 1,464 (-8%) | 3mo | $220,000 | $150 | 67 |
| 1426 Canton St | 0.28mi | 4/1.5 (+1) | 1,464 (-8%) | 10mo | $170,000 | $116 | 60 |
| 2559 Helen St | 0.66mi | 3/1.5 | 1,508 (-5%) | 3mo | $85,000 | $56 | 59 |
| 3140 Woods Cir | 0.55mi | 3/0.5 | 1,678 (+6%) | 5mo | $221,600 | $132 | 57 |
| 370 E Grand Blvd | 0.43mi | 3/2.5 | 1,575 (-1%) | 23mo | $248,000 | $157 | 55 |
| 1415 Baldwin St | 0.64mi | 3/2.0 | 1,720 (+8%) | 3mo | $150,000 | $87 | 52 |
| 368 E Grand Blvd | 0.43mi | 3/2.5 | 1,742 (+10%) | 14mo | $140,000 | $80 | 48 |
| 3104 Woods Cir | 0.52mi | 4/2.5 (+1) | 1,744 (+10%) | 5mo | $265,000 | $152 | 46 |
| 2131 Townsend St | 0.66mi | 3/1.5 | 1,799 (+13%) | 2mo | $75,000 | $42 | 45 |
| 2433 Townsend St | 0.75mi | 3/2.0 | 1,500 (-6%) | 14mo | $295,000 | $197 | 42 |
| 2429 Sheridan St | 0.70mi | 4/2.0 (+1) | 1,800 (+13%) | 21mo | $275,000 | $153 | 21 |
Match score weights: distance 35% · size 25% · config 20% · recency 20%. Top-matched comps best support the ARV.
Projected returns pro-forma
-2.79% appreciation · 3.53% rent growth · sell at horizon
- IRR
- —
- Equity multiple
- 13.07×
- Total profit
- $84,503
- Equity at exit
- $3,961
- IRR
- —
- Equity multiple
- 28.23×
- Total profit
- $190,593
- Equity at exit
- $2,564
Cash invested: $7,000 (down + closing). Projections, not guarantees.
Landlord ↔ Tenant lean methodology
- Overall (STATE)
- 62 Landlord-Friendly
- State Michigan
- 62 Landlord-Friendly · EVEN
- County
- — inherits STATE
- City
- — inherits STATE
ZIP-level market 48207
- Home prices YoY
- -2.0%
- Rents YoY
- 3.5%
- Active inventory
- 244
- Price-to-rent
- 1.1×
Monthly cashflow live
- Estimated rent
- $1,953 high interval (Pro) →
- Mortgage (P&I)
- −$131
- Tax est. 1.5%
- −$31 /mo · $375/yr
- Insurance
- −$10
- HOA
- −$0
- Vacancy / Maint / Mgmt
- −$410
- Net cashflow
- $1,370
Break-even live
UW: 25.0% down · 7.5% · 30yr · 1.5% tax · 5.0% vac · 8.0% maint · 8.0% mgmt
Financing live
Cash to close
- Down payment
- $6,250
- Closing costs
- $750
- Reserves months
- —
- Total cash needed
- —
Loan-product check · same deal, 3 products live
Conventional
25% down · 7.5% · 30yr
- Down + closing
- —
- Monthly P&I
- —
- Monthly cashflow
- —
- DSCR
- —
- Eligible?
- —
Personal DTI + credit; lowest rate.
DSCR
20% down · 8.5% · 30yr
- Down + closing
- —
- Monthly P&I
- —
- Monthly cashflow
- —
- DSCR
- —
- Eligible?
- —
No personal income docs; deal must DSCR.
Hard money
10% down · 12.0% · 12mo
- Down + closing
- —
- Monthly P&I
- —
- Monthly cashflow
- —
- DSCR
- —
- Eligible?
- —
Short-term bridge; refi at stabilization.
Rent comps 27 comps
| Address | Beds | Baths | Sqft | Rent | $/sqft | DOM | Units | Dist |
|---|---|---|---|---|---|---|---|---|
| 1440 Robert Bradby Dr Detroit, MI | 2.0 | 2.0 | 1250 | $1,472 | $1.18 | 43d | 1 | 0.22mi |
| 1738 Canton St Unit 1 Detroit, MI | 4.0 | 1.0 | 2244 | $1,650 | $0.74 | 43d | 1 | 0.30mi |
| 6533 E Jefferson Ave Detroit, MI | 2.0 | 1.0–2.0 | 1181 | $1,500 | $1.27 | 24d | 3 | 0.40mi |
| 6533 E Jefferson Ave Detroit, MI | 2.0 | 1.0–2.0 | 1094 | $1,500 | $1.37 | 17d | 2 | 0.40mi |
| 6533 E Jefferson Ave #421 Detroit, MI | 2.0 | 1.0 | 1063 | $2,200 | $2.07 | 15d | 1 | 0.40mi |
| 374 E Grand Blvd Unit 2A Detroit, MI | 2.0 | 2.0 | 1450 | $2,750 | $1.90 | 43d | 1 | 0.42mi |
| 1348 Village Dr Detroit, MI | 3.0 | 2.5 | 2100 | $2,295 | $1.09 | 24d | 1 | 0.44mi |
| 1454 Townsend St #101 Detroit, MI | 2.0 | 2.0 | 1268 | $2,500 | $1.97 | 3d | 1 | 0.61mi |
| 2928 Prince Hall Dr Detroit, MI | 2.0 | 2.0 | 1425 | $2,000 | $1.40 | 5d | 1 | 0.65mi |
| 3500 E Jefferson Detroit, MI | 1.0–2.0 | 1.0–2.0 | 1012 | $2,560 | $2.53 | 2d | 5 | 0.71mi |
| 7700 E Jefferson Ave Detroit, MI | 2.0 | 1.0 | 877 | $1,795 | $2.05 | 43d | 1 | 0.76mi |
| 7918 E Lafayette St #4 Detroit, MI | 3.0 | 1.0 | 1150 | $1,800 | $1.57 | 18d | 1 | 0.79mi |
| 2972 Field St Detroit, MI | 3.0 | 1.0 | 1225 | $1,395 | $1.14 | 17d | 1 | 0.83mi |
| 8001 Kercheval Ave Detroit, MI | 1.0–2.0 | 1.0–2.0 | 984 | $2,270 | $2.31 | 1d | 3 | 0.88mi |
| 500 River Pl Dr Detroit, MI | 1.0–3.0 | 1.0–2.0 | 950 | $2,000 | $2.11 | 43d | 1 | 0.89mi |
| 8100 E Jefferson Ave Detroit, MI | 3.0 | 1.0–3.0 | 1089 | $2,210 | $2.03 | 19d | 20 | 0.98mi |
| 3631 Helen St Unit 3635 Detroit, MI | 4.0 | 2.0 | 2157 | $1,650 | $0.76 | 43d | 1 | 1.00mi |
| 3325 Gratiot Ave Unit R Detroit, MI | 2.0 | 1.0 | 1200 | $1,000 | $0.83 | 43d | 1 | 1.04mi |
| 3323 Gratiot Ave Unit R Detroit, MI | 2.0 | 1.0 | 1200 | $975 | $0.81 | 43d | 1 | 1.04mi |
| 2003 Orleans St Unit 528 Detroit, MI | 4.0 | 2.0 | 1800 | $2,500 | $1.39 | 44d | 1 | 1.28mi |
| 1544 1566 E LAFAYETTE St Detroit, MI | 2.0 | 1.0–2.0 | 848 | $2,515 | $2.97 | 3d | 16 | 1.30mi |
| 8845 E Jefferson Ave Unit 206 Detroit, MI | 2.0 | 1.5 | 1230 | $1,660 | $1.35 | 43d | 1 | 1.35mi |
| 8845 E Jefferson Ave Unit 207 Detroit, MI | 2.0 | 1.5 | 1500 | $1,695 | $1.13 | 43d | 1 | 1.35mi |
| 8845 E Jefferson Ave Unit 204 Detroit, MI | 2.0 | 1.5 | 1150 | $2,350 | $2.04 | 43d | 1 | 1.35mi |
| 8925 E Jefferson Ave Detroit, MI | 1.0–2.0 | 1.0–2.0 | 1050 | $1,945 | $1.85 | 43d | 9 | 1.39mi |
| 229 Orleans St Detroit, MI | 1.0–2.0 | 1.0–2.5 | 1087 | $2,779 | $2.56 | 2d | 10 | 1.41mi |
| 1 Lafayette Plaisance St Detroit, MI | 2.0 | 1.0 | 840 | $2,337 | $2.78 | 1d | 28 | 1.46mi |
Listing history 6 events
-
2025-12-12soldstatus $10,000
-
2025-12-12soldstatus $30,000
-
2025-12-04status Pending 286-char remark
Show marketing remark (286 chars)
Great investment opportunity in Island view! Vacant 3-bed, 1-bath 2-story home on an extra lot with solid upside. Property needs a full renovation roof replacement, electrical updates, driveway and garage repairs but offers strong potential in a rapidly improving area. House sell AS IS
-
2025-12-04status Pending
Show marketing remark (286 chars)
Great investment opportunity in Island view! Vacant 3-bed, 1-bath 2-story home on an extra lot with solid upside. Property needs a full renovation roof replacement, electrical updates, driveway and garage repairs but offers strong potential in a rapidly improving area. House sell AS IS
-
2025-11-26$25,000 Active
Show marketing remark (286 chars)
Great investment opportunity in Island view! Vacant 3-bed, 1-bath 2-story home on an extra lot with solid upside. Property needs a full renovation roof replacement, electrical updates, driveway and garage repairs but offers strong potential in a rapidly improving area. House sell AS IS
-
2025-11-26$25,000 Active 286-char remark
Show marketing remark (286 chars)
Great investment opportunity in Island view! Vacant 3-bed, 1-bath 2-story home on an extra lot with solid upside. Property needs a full renovation roof replacement, electrical updates, driveway and garage repairs but offers strong potential in a rapidly improving area. House sell AS IS
ⓘ Source: listings_history table (triggers on properties + properties_extension) + one-shot
backfill from property_details.listing_events for pre-trigger history.
Climate risk First Street
- Flood 1/10 Low FEMA zone X (unshaded) · 0% chance over 30 yrs
- Wildfire 1/10 Low
- Heat 3/10 Moderate 7 d/yr ≥96°F today · 15 d/yr by 30 yrs out
- Wind 2/10 Low
- Air quality 4/10 Moderate 6 unhealthy d/yr today · 6 by 30 yrs out
Nearby sold comps map
Loading sold comps map…
Walkable amenities ~0.75 mi
Loading nearby amenities…
Taxation est. · year 1
- Rental income
- $23,435
- − Mortgage interest
- −$1,400
- − Property taxes
- −$375
- − Insurance
- −$125
- − Repairs & maintenance
- −$1,875
- − Management
- −$1,875
- − Depreciation
- −$727
- Taxable income
- $17,058
- Est. tax owed @ 24.0%
- −$4,094
- After-tax cash flow
- $12,347/yr
For passive investors: Depreciation is non-cash, so a rental often shows a tax loss while cash-flowing — sheltering income. Rental losses are passive: they offset passive income freely, and up to $25,000/yr can offset ordinary (W-2) income if you actively participate and your MAGI is under $100k (phasing out to $0 by $150k); unused losses carry forward. On sale, claimed depreciation is recaptured at up to 25%, and gains may owe capital-gains tax (a 1031 exchange can defer both). Figures are a year-1 estimate at your 24.0% rate — not tax advice; consult a CPA.
Schools (NCES district)
- District
- Detroit Public Schools Community District
- NCES district ID
- 2601103
- Math proficiency
- 10% ▼ -2.00%
- Reading proficiency
- 24% ▲ 6.00%
- Median HH income
- $25,815
- Composite
- 13.06/100
- National rank
- #9564
- State rank
- #499 of 540 in MI
Livability — Detroit
- Score
- 73/100
- State rank
- #218
- US rank
- #5427
Category grades
Schools grade is shown separately in the Schools card above.
Census & demographics
- Census place
- Detroit, MI
- County
- Wayne County · 1,562,939 people
- City population
- 572,865
- Metro
- Detroit-Warren-Dearborn, MI
- Population (ZIP)
- 20,848
- Household income
- $47,831
- Rent vs Own
- Severe rent burden
- 2017.0
Population outlook (Wayne County) Hauer SSP2
- Today (2025)
- 1,675,273 people
- By 2030
- 1,620,300 · -3.3%
- By 2040
- 1,502,341 · -10.3%
- By 2050
- 1,384,039 · -17.4%
- By 2075
- 1,124,592 · -32.9%
- By 2100
- 881,193 · -47.4%
Race, ethnicity, and origin ACS 2023
- Neighborhood character
- Predominantly Black (74%)
- Race & ethnicity
- Black 74% White 18% Two or more races 4% Asian 3% Hispanic / Latino 2%
- Common ancestry
- Romanian 2% Italian 1% Lithuanian 1%
- Foreign-born
- 5% · Canada, South Korea
- Languages at home
- 94% English-only · Spanish 2% Other Indo-European 1% Arabic 1%
Political lean MEDSL · Wayne
- 2024 margin
- Strong D (+29.0) · D 62.7% · R 33.7% · Other 3.6%
- 2008→2024 swing
- -20.5pp toward R · 2008: 49.5pp · 2024: 29.0pp
- All cycles
- 2024: D+29.0 2020: D+38.1 2016: D+37.3 2012: D+46.9 2008: D+49.5
Not yet ingested
- Civics
- —
Market trends
- HPI YoY
- ▼ -2.79%
- Current HPI
- 136.6328
- Rent YoY
- ▲ 3.53%
- Metro
- Detroit-Warren-Dearborn, MI
- State GDP YoY
- ▲ 1.37%
- F500 in state
- 28
Industry mix (Fortune 500 HQ in MI)
| Industry | F500 HQs | Revenue |
|---|---|---|
| Automotive Parts | 3 | $48B |
|
||
| Automotive | 2 | $372B |
|
||
| Chemicals | 1 | $45B |
|
||
| Automotive Retail | 1 | $29B |
|
||
| Healthcare / Medical Devices | 1 | $23B |
|
||
| Automotive Technology | 1 | $20B |
|
||
Price history
+20.0% since first listed6 events — show timeline
- 2025-12-12 Sold (Public Records) $30,000 Public Records
- 2025-12-12 Sold (Public Records) $10,000 Public Records
- 2025-12-04 Pending — MiRealSource-MiMLS
- 2025-12-04 Pending — REALCOMP
- 2025-11-26 Listed $25,000 REALCOMP
- 2025-11-26 Listed $25,000 MiRealSource-MiMLS
Property tax history
+10.6%/yrLatest (2025): $1,635 · -54.2% YoY. Source: county tax records.
Cash-flow waterfall
monthlySold comps — $/sqft
last 12 mo · ≤1 miLoading sold comps…